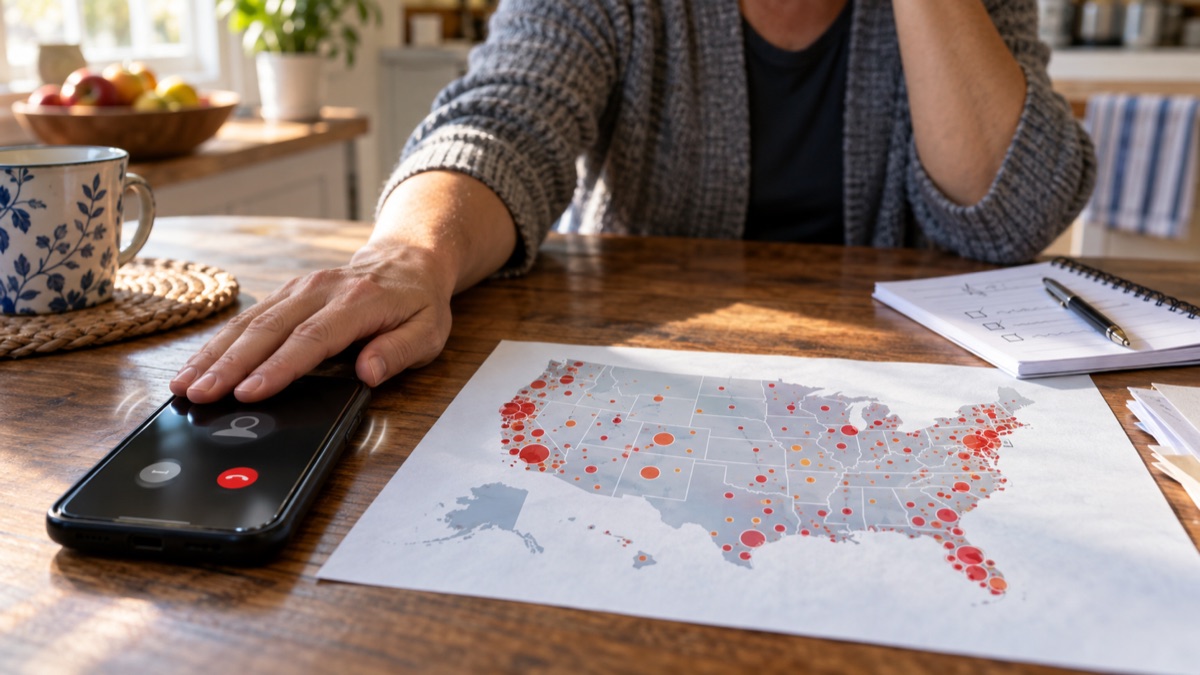
Arizona residents filed 1,028 National Do Not Call Registry complaints for every 100,000 people in fiscal 2025, the highest rate among the 50 states. Tennessee followed at 1,017. At the other end of the table, Hawaii recorded 393 complaints per 100,000—meaning Arizona’s reported rate was about 2.6 times Hawaii’s.
Those figures provide a useful answer to a seemingly simple question: where do Americans complain most often about unwanted calls? They do not, however, show where phones ring most, where telemarketers break the law most frequently, or where residents suffer the greatest financial losses.
That distinction matters because the underlying numbers are complaints submitted by consumers to the Federal Trade Commission. They reflect both unwanted calls and a person’s willingness and ability to report them. They are neither a survey of households nor a comprehensive census of calls.
Batmandir · Founders A numbered seat at the table. S3 · The Founders Club — 161 seats per location. By invitation. Explore membership →Even with that limitation, the FTC’s fiscal 2025 data book offers a detailed national view of the problem. Consumers filed 2,618,077 complaints during the year. Robocalls accounted for 1,601,611, or 61.2 percent. Live callers accounted for 802,144, or 30.6 percent, while consumers did not report the call type in the remaining 214,322 complaints.
| Selected state | Complaints per 100,000 | Position in the distribution |
|---|---|---|
| Arizona | 1,028 | Highest |
| Tennessee | 1,017 | Second highest |
| Nevada | 960 | Third highest |
| Illinois | 943 | Fourth highest |
| Florida | 933 | Fifth highest |
| Median state | 755 | Middle of 50 ranked states |
| North Dakota | 425 | Second lowest |
| Hawaii | 393 | Lowest |
Do Not Call complaints per 100,000 residents
Selected states, FTC fiscal 2025 reporting rate
1,028Tennessee
1,017Nevada
960Median
755North Dakota
425Hawaii
393
A rebound after a steep decline
The 2025 total was 25.5 percent higher than the 2,085,410 complaints logged in fiscal 2024. That rebound followed several years of sharp decline: the FTC recorded 5,008,987 complaints in 2021, 3,054,237 in 2022 and 2,118,808 in 2023.
The longer trend therefore looks different from the one-year comparison. Fiscal 2025 complaints remained 47.7 percent below the 2021 level, even after rising by more than half a million from 2024. The data show a renewed increase in consumer reporting, not a return to the peak seen four years earlier.
Robocalls drove most of the year-over-year change. Their reported count rose from 1,099,229 in 2024 to 1,601,611 in 2025, an increase of 45.7 percent. Complaints about live callers rose more modestly, from 764,138 to 802,144, while reports without a call type declined.
Where complaint rates were highest
After Arizona and Tennessee, the highest rates were in Nevada, with 960 complaints per 100,000 residents; Illinois, with 943; and Florida, with 933. Ohio, Colorado, New Jersey, North Carolina and Virginia completed the top 10.
The unweighted median among the 50 states was 755 complaints per 100,000. Fifteen states recorded rates of 827 or higher. At the bottom were Rhode Island at 441, North Dakota at 425 and Hawaii at 393. Other relatively low-rate states included Iowa at 498, Maine and Minnesota at 525, and South Dakota at 545.
The District of Columbia appeared in the FTC table at 802 complaints per 100,000, but the agency did not assign it a state rank. Puerto Rico, also unranked, recorded 28 per 100,000. The FTC says its rates use 2023 Census population estimates.
Raw totals tell a somewhat different story because they are heavily influenced by population. California generated the most complaints among the states, with 304,497, followed by Texas with 228,370, Florida with 204,702, New York with 125,810 and Illinois with 119,697. California’s per-capita rate, however, was 776—22nd among the 50 ranked states and well below the leading states. A large total is therefore not evidence of unusually high complaint intensity.
Debt reduction led the reported topics
The FTC also classifies complaints by subject when consumers provide enough information. Reducing debt was the largest listed topic in fiscal 2025, with 441,430 complaints. Imposter calls followed with 243,628, and medical and prescription calls produced 204,312.
The remaining named topics were much smaller: energy, solar and utilities generated 34,801 complaints; home improvement and cleaning, 28,042; warranties and protection plans, 21,316; vacations and timeshares, 13,574; lotteries, prizes and sweepstakes, 11,996; computer and technical support, 11,198; and money-making opportunities, 7,461.
Those categories do not cover every complaint, and a complaint’s topic is what a consumer reported, not a legal finding. The FTC warns that complaint data are unverified. A report can alert investigators to patterns, but its presence in the database does not establish that a company violated the Telemarketing Sales Rule or another law.
Why state comparisons need caution
Several factors can separate complaint rates from actual call exposure. Residents may differ in their awareness of the complaint portal, their access to the internet, their tolerance for unwanted calls, or their willingness to spend time filing a report. State officials and local media may publicize reporting channels differently. Caller-ID blocking tools and carrier filtering can also change which calls reach consumers.
The FTC dataset does not provide a representative denominator of calls received in each state. Dividing complaints by population adjusts for state size, but it cannot adjust for reporting behavior. It would be inaccurate to call Arizona the state with the most illegal telemarketing or Hawaii the state with the least based on these figures alone.
Registration rates are a separate measure. The Do Not Call Registry contained 258.5 million actively registered phone numbers on September 30, 2025, after 4.7 million numbers were added during the fiscal year. New Hampshire led the FTC’s separate ranking of active registrations per 100,000 residents, followed by Connecticut, Vermont, Massachusetts and Kansas. A state can rank high in registration without ranking high in complaints.
The registry itself also cannot prevent every unwanted call. Legitimate sellers are generally required to scrub covered numbers from their lists, but scammers may ignore the law, spoof caller identification or operate from beyond easy regulatory reach. Certain calls, including some political and charitable calls, are treated differently under federal rules.
What the numbers are good for
Used carefully, complaint data can show where reporting is concentrated, which subjects consumers identify most often, and how the reported mix of robocalls and live calls changes over time. It can also help reporters and regulators spot anomalies worth investigating.
The 2025 data support three clear findings. Consumer complaints rebounded after three consecutive annual declines. Robocalls represented more than three-fifths of reported calls and accounted for most of the rebound. And state complaint rates varied widely, from more than 1,000 per 100,000 residents in Arizona and Tennessee to fewer than 400 in Hawaii.
What the data cannot settle is why. Answering that would require additional evidence—such as representative call-volume measurements, carrier filtering statistics, demographic analysis and consistent measures of public awareness. The state ranking is a map of consumer reports. It is a starting point for investigation, not a verdict on where the phone rings worst.
Methodology
USA Times analyzed the FTC’s fiscal 2025 Do Not Call Registry tables. Percentages were calculated from the agency’s national complaint totals. The median rate uses the 50 ranked states and excludes the District of Columbia and Puerto Rico, which the FTC lists but does not rank. Values are rounded to one decimal place where appropriate. The FTC calculated state rates using 2023 Census population estimates. The source tables and calculations should be preserved with any published version of this article.
Primary sources
- FTC National Do Not Call Registry Data Book for Fiscal Year 2025
- FTC release announcing the fiscal 2025 data book
- FTC Do Not Call reported-calls API documentation
- U.S. Census Bureau population-estimates datasets