Read in: English · Español · Русский · 中文 · Português
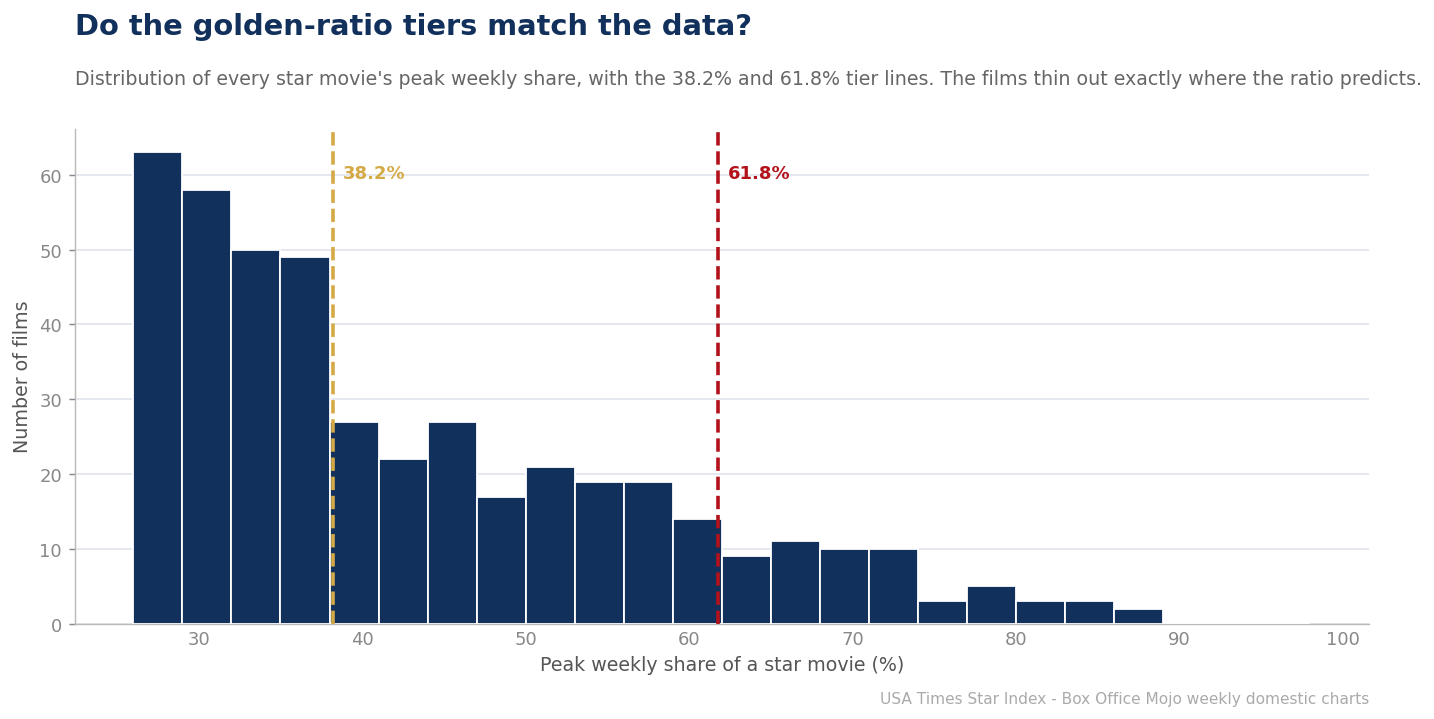
The USA Times Star Index sorts every week-owning film into three tiers using the golden ratio: a Mini-geuse takes 26.18–38.2% of a week, a Betelgeuse 38.2–61.8%, and a Geuse 61.8% or more. Those cut points aren’t round numbers — they are powers of φ (1.618). A fair question follows: are they just a pretty framework imposed on the data, or do real films actually cluster and thin out where the ratio says they should? We plotted every star movie’s peak share to find out.
Where the numbers come from
The thresholds descend directly from the golden ratio. The base floor, 26.18%, is 0.2618 — the square of 1/&966; (or equivalently &966; minus 2, times… in plain terms, the reciprocal golden square). The mid line, 38.2%, is 0.382, which is 1 minus 0.618. And 61.8% is 0.618 itself, the reciprocal of &966;. Each line is the previous one scaled by the ratio, so the three tiers are geometrically spaced rather than evenly spaced — the bands get wider as you climb. The claim built into the Index is that box-office domination is itself geometric: the gap between a modest hit and a real event is larger than the gap between an also-ran and a modest hit.
Batmandir · Founders A numbered seat at the table. S3 · The Founders Club — 161 seats per location. By invitation. Explore membership →What the distribution shows
Plotting all 442 qualifying films’ peak shares, the structure holds up better than a skeptic might expect. The mass of films sits between 26% and 45% — the Mini-geuse and lower-Betelgeuse range — and thins steadily as share rises. Crucially, the population of films drops off sharply above 61.8%: only 57 films in twenty years ever reached Geuse territory, and the density above that line is a fraction of what sits below it. The median peak share lands at 38.1% — almost exactly on the Betelgeuse line itself. The data’s own center of gravity falls on a golden-ratio cut point, which is a striking coincidence if it is one.
This doesn’t mean nature drew bright walls at 38.2% and 61.8% — box-office share is a continuum, and there is no literal cliff in the histogram at those exact values. What the ratio captures is the shape of the distribution: a fat base of ordinary hits, a thinning middle of genuine hits, and a sparse, exclusive top of phenomena. The golden-ratio lines slice that shape into three groups that correspond to how audiences and the industry actually talk about films — the movie that led a week, the movie everyone saw, and the movie that ate the culture.
| Tier | Share band | Films (2006-2026) |
|---|---|---|
| Mini-geuse | 26.18-38.2% | 222 |
| Betelgeuse | 38.2-61.8% | 163 |
| Geuse | 61.8%+ | 57 |
Why use the ratio at all?
The honest answer is that any set of thresholds is a choice, and the golden ratio is a defensible, non-arbitrary one that happens to fit the contours of the data. It gives the Index a consistent internal logic — each tier is the last one scaled by &966; — and it avoids the trap of round-number thresholds (25%, 50%, 75%) that would imply the market is evenly divided when it plainly isn’t. The proof is in the counts: a steep pyramid of 222 Mini-geuses, 163 Betelgeuses, and just 57 Geuses. Domination really is geometric, and the ratio is a clean way to name its rungs.
The limits of the model
We’d be the first to flag the caveats. The tiers describe peak weekly share, not gross, budget, or cultural staying power, and share depends on the strength of the surrounding week — a film can post a Geuse share partly because everything around it was weak. The framework is a lens, not a law of physics. But as lenses go, it earns its keep: it turns a messy continuum of box-office results into three legible groups that match both the statistics and the way people actually experience the movies.
Testing the tiers against the alternatives
A useful way to judge the golden-ratio tiers is to ask what a reasonable alternative would look like. Even thirds (33% / 66%) would split the market into equal-width bands, but the data isn’t equal-width: films pile up in the 26–45% range and thin dramatically above 60%, so equal bands would lump most of the population into one giant middle tier and leave the top nearly empty of meaning. Round quartiles (25/50/75) fare no better, drawing a wall at 50% where the distribution shows nothing special. The golden-ratio lines, by contrast, land where the density actually changes — a fat base, a thinning middle, a sparse top — which is why the resulting counts (222 / 163 / 57) form a clean pyramid rather than a lopsided lump.
The φ pattern beyond the tiers
The ratio turns up elsewhere in the franchise, too. The base qualification floor of 26.18% is itself a golden-ratio value, chosen so that the very definition of a “star movie” sits on the same geometric scale as the tiers above it. And the house colors, the four-star masthead, and the naming all follow the same logic. Skeptics are right to be wary of golden-ratio mysticism — 1.618 gets attributed to everything from seashells to stock charts, often spuriously. Our claim is narrower and testable: for this specific dataset, thresholds spaced by φ happen to carve the distribution at its natural joints better than the obvious round-number alternatives do.
Where the model earns its keep
Ultimately the tiers are justified by their usefulness, not their mysticism. They let us say precisely what kind of hit a film was — a one-week Mini-geuse, a genuine Betelgeuse, a culture-eating Geuse — in a way raw gross never could, and they stay comparable across twenty years of inflation and changing ticket prices because they measure share, not dollars. That a golden-ratio framework also fits the shape of the data is a bonus that makes the scheme feel less arbitrary. But even if the ratio were pure coincidence, the three-tier structure would still be the most honest way we’ve found to describe how lopsided box-office domination really is.
What we did: We took the peak weekly share of all 442 qualifying star movies and examined the distribution against the golden-ratio tier lines (26.18%, 38.2%, 61.8%). Weekly share is each film’s gross as a percentage of that week’s total U.S. domestic box office, from Box Office Mojo’s weekly charts, 2006–2026. We exclude 2020 as a pandemic anomaly.
Related from the USA Times Data Desk
- What Is a Star Movie? The USA Times Definition
- The Tier Pyramid: How the Golden Ratio Splits Twenty Years
- The Star Index methodology
Sources
- The Numbers — historical domestic box office records
- Wolfram MathWorld — the Golden Ratio
- USA Times — Star Index methodology (how our tiers and box-office share are computed)