Read in: English · Español · Русский · 中文 · Português
Six months after New York switched on the nation’s first urban congestion toll at midnight on January 5, 2025, the argument that dominated the run-up — that the whole thing was a revenue gimmick doomed to snarl into chaos — had quietly lost its evidence. The tolls did not empty out. The revenue did not collapse. And the composition of who actually rolled under the cameras below 60th Street turned out to be simpler than either side predicted: overwhelmingly private cars, and right behind them, the yellow cabs and app dispatches that never left.
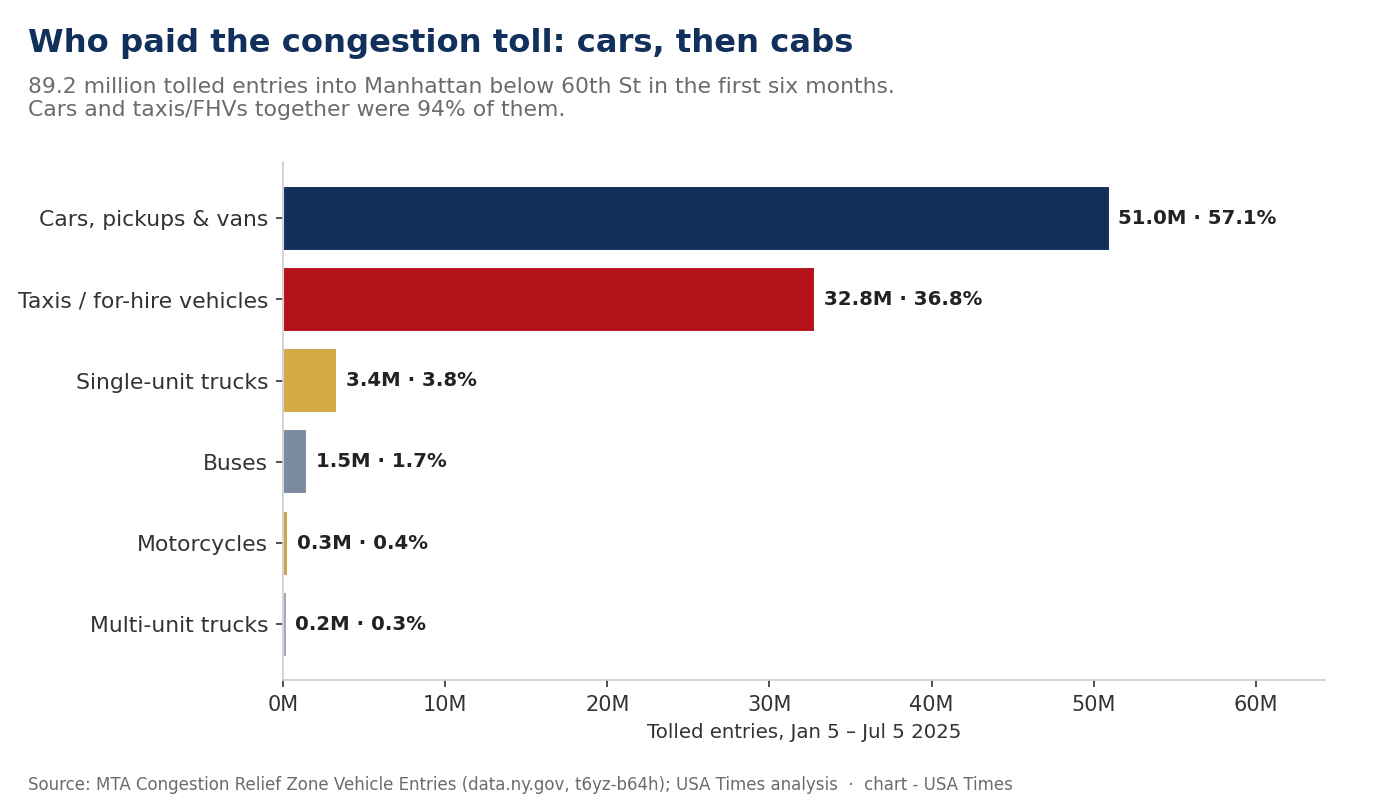
We pulled the Metropolitan Transportation Authority’s own entry data — every tolled crossing into the Congestion Relief Zone, logged in ten-minute blocks and broken out by vehicle class — and counted the first six months for ourselves. From January 5 through July 5, 2025, the cameras recorded 89.2 million tolled entries into Manhattan below 60th Street. Another 11.9 million vehicles slipped in on the two roadways the program deliberately leaves free, the FDR Drive and the West Side Highway, which ring the zone without dropping a driver into it. This piece is a ledger of that first half-year: what the state collected, how the streets changed, and — using the entry records line by line — exactly who paid.
Batmandir · Guest Passes Step inside for a day. Guest passes from $161/day — brought in by a member. See guest passes →The revenue held its forecast
The number the whole program was underwritten on was $500 million in the first year. By the six-month mark, the MTA said congestion pricing was “on track to reach the forecasted $500 million in 2025” — the figure that lets the authority issue roughly $15 billion in bonds against its 2020–2024 capital plan. That is the entire point of the toll: not the cash itself, but the borrowing the cash makes possible. The $15 billion is already spoken for — new R211 subway cars, signal modernization on the A, C, B, D, F and M lines, accessibility work at more than 20 stations, and the tunneling contract for Phase 2 of the Second Avenue Subway.
A caution on the revenue, and it is the MTA’s own: the public entry dataset we analyzed cannot be used to reconstruct dollars. It counts entries, not payers. It does not know which vehicles were exempt, which paid the overnight rate, which were making a second or third trip through the zone that day, or which qualified for the low-income discount. So we do not translate our 89.2 million entries into a revenue figure — the $500-million run-rate comes from the MTA’s financial reporting, and the entry file tells a different, complementary story: who and what actually moved.
The traffic actually thinned
The headline traffic claim is an 11% drop in vehicles entering the zone versus the year before — about 67,000 fewer vehicles a day, and more than 10 million fewer over the six months. That is the reduction the toll was designed to produce, and it is the kind of number that is easy to assert and hard to feel. The felt version showed up in delay data assembled by the Regional Plan Association and Waze: traffic delays down 25% inside the Congestion Relief Zone and 9% across the wider metropolitan region, with double-digit improvements reaching into the Bronx (10%) and parts of Bergen County, New Jersey (14%). The gridlock relief, in other words, did not stop at the toll line.
The river crossings tell the sharpest version. Travel times on the tunnels and bridges into Manhattan fell anywhere from 6% to as much as 42% compared with 2024. In the Holland Tunnel, rush-hour delays dropped 65%. In the Lincoln Tunnel, MTA express buses ran nearly 24% faster than the year before — a straightforward transfer of time from the toll to the people who took the bus instead of driving. Inside the zone, average bus speeds rose 3.2%, with some routes gaining as much as 25%.
The quality-of-life numbers moved in the same direction. Crashes in the zone were down 14% and traffic injuries down 15%; the city’s transportation department reported pedestrian fatalities at their lowest since 2018. And in a detail that says something about how much of Manhattan’s noise is simply idling engines, honking and vehicle-noise complaints to 311 fell 45% year over year — a data point we will return to in a companion piece on which 311 complaints are rising and falling fastest across the city.
Who paid: cars first, cabs a close second
Here is where our own count adds something the press releases did not. Of the 89.2 million tolled entries in the first six months, cars, pickups and vans made up 57.1% — just under 51 million entries. Taxis and for-hire vehicles were 36.8%, close to 33 million. Together, those two categories accounted for 94% of everything that paid to enter. Trucks, for all the noise about delivery costs, were a rounding error by count: single-unit trucks 3.8%, multi-unit trucks a quarter of one percent. Buses were 1.7%, motorcycles 0.4%.
Those shares are entries, not dollars, and the distinction matters because the four vehicle classes pay on completely different terms. A private car pays the peak toll — $9 with E-ZPass — once per day no matter how many times it crosses. A taxi or for-hire vehicle is charged a much smaller per-trip surcharge (75 cents for a yellow cab, $1.50 for an Uber or Lyft) that is added to the passenger’s fare, every trip, all day. So the 33 million taxi and FHV entries do not map to 33 million $9 tolls; they map to tens of millions of small surcharges paid by riders, not drivers. Trucks pay more per entry than cars. The upshot: the entry file shows cars as the dominant presence in the zone, while the dollar burden is spread across a car-heavy base of daily tolls and an enormous volume of small taxi and rideshare surcharges. That rideshare surcharge is a story in itself — one we have traced through the collapse in shared Uber and Lyft trips and the stacking of surcharges on top of the driver pay floor.
Where they came in
The entry file also maps the doors. The single busiest tolling point was the East 60th Street cordon — the northern boundary crossings on the East Side — with 13.8 million tolled entries in six months. The Lincoln Tunnel (8.3 million), the Queens-Midtown Tunnel (7.9 million), the Holland Tunnel (7.4 million) and the Williamsburg Bridge (7.3 million) followed. The Queensboro (6.6 million), Manhattan (5.2 million) and Brooklyn (5.0 million) bridges rounded out the East River crossings. Notably, the FDR Drive and West Side Highway “at 60th Street” detection points — the free bypass roads — logged 9.3 million and 7.8 million entries respectively that were not billed, a reminder that the zone was drawn to let through traffic skirt the island without paying to sit in Midtown.
The trend line: a ramp, then a plateau
Month by month, the entries settled into a rhythm. January, a partial month starting on the 5th and running through the deep-winter lull, logged 12.7 million tolled entries. February came in at 13.4 million. Then March jumped to 15.3 million and the following months held there — 15.1 million in April, 15.9 million in May, 15.1 million in June. The pattern is the ordinary one for a new toll: an initial dip as drivers test whether they can avoid it, a seasonal thaw, and then a stable band once behavior settles. There is no sign in the data of the mass abandonment critics predicted, and no sign of the tolls quietly climbing back to pre-program levels either. The zone found a new normal at roughly 15 million paid entries a month.
The fight that could still unwind it
None of this settled the legal question. Through the first six months, the U.S. Department of Transportation under the Trump administration repeatedly moved to terminate the program, and New York repeatedly went to court to stop it. In May 2025 a federal judge issued a preliminary injunction in Metropolitan Transportation Authority v. Duffy, keeping the cameras on pending further proceedings and barring the federal government from retaliating in the meantime. The tolls that produced every number above have been collected under a legal cloud that had not fully cleared — a reminder that the most consequential figure in the whole program is not revenue or speed but whether a court lets it keep running.
What we did
We downloaded the MTA Congestion Relief Zone Vehicle Entries dataset (data.ny.gov identifier t6yz-b64h), which records every tolled and excluded-roadway entry into Manhattan below 60th Street in ten-minute blocks by vehicle class and detection point. Using the Socrata query API, we summed entries for the program’s first six months, January 5 through July 5, 2025, and grouped them by vehicle class, by detection group, and by month. Those figures — 89.2 million tolled entries and the class breakdown charted above — are our own computation. Per the MTA’s published caveat, entry counts exclude exemption status, payment method and repeat trips and cannot be used to compute revenue; the $500-million run-rate, the 11% traffic reduction, the delay, speed, safety, ridership and economic figures come from the MTA’s and Governor’s six-month reports and the Regional Plan Association/Waze analysis they cite. Where a figure could be checked two ways, we checked it; the vehicle-class shares are ours, the program-wide outcomes are the MTA’s.
Sources
- MTA Congestion Relief Zone Vehicle Entries: Beginning 2025 (NY State Open Data, t6yz-b64h)
- MTA / Governor’s Office: Six Months In, Governor Hochul Highlights Success of Congestion Pricing (July 5, 2025)
- MTA: The most detailed view of NYC traffic (so far)
- USA Times: NYC’s Congestion Toll Cut Shared Uber and Lyft Rides in Half
- USA Times: NYC’s Rideshare Driver Pay Floor and the Second Surcharge