New York City’s congestion relief zone toll went into effect on January 5, 2025, charging private cars up to $9 a day to drive into Manhattan below 60th Street. Uber and Lyft trips get a different deal: instead of a daily flat fee, every trip that starts, ends, or passes through that zone gets hit with a flat $1.50 charge, every time, with no discount for sharing a ride with another passenger. Regular taxis and green cabs pay half that, at $0.75 a trip.
The city’s own numbers on what that did to ride-hail demand look almost like a wash. The TLC’s own tracking, covering January through September 2025, found for-hire vehicle trips in the congestion zone down 4.5%, taxi trips up 17%, for a net increase of 1.4% in overall for-hire activity. Read quickly, that sounds like the toll barely moved the needle — people just shifted from app-based rides to yellow cabs, and total demand for door-to-door transportation held roughly steady.
A peer-reviewed study published in February 2026, using the same public trip-level data the TLC itself publishes, tells a considerably sharper story — and finds an effect the top-line numbers don’t show at all.
Batmandir · Guest Passes Step inside for a day. Guest passes from $161/day — brought in by a member. See guest passes →What NYC’s Congestion Toll Did to Uber & Lyft Trips
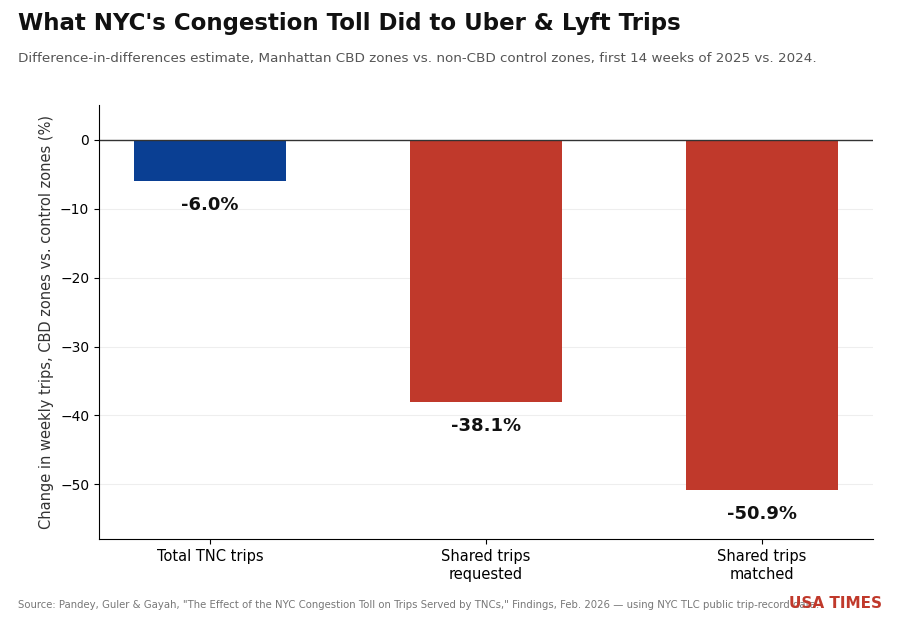
Difference-in-differences estimate: Manhattan congestion-zone taxi zones vs. non-toll control zones, first 14 weeks of 2025 vs. 2024. Hover each bar for detail.
What the rigorous version of this analysis actually found
Researchers Ayush Pandey, Ilgin Guler, and Vikash Gayah, publishing in the transportation research journal Findings, pulled trip-level records directly from the NYC Taxi and Limousine Commission’s public dataset — origin and destination zone, fare, distance, and whether each trip was requested and matched as a shared ride — for every weekday from the start of 2024 through the 14th week of 2025. Rather than simply comparing before-and-after totals the way a basic tracking report does, they ran a difference-in-differences analysis: comparing how trip volume changed in the taxi zones inside the congestion zone against how it changed, over the same weeks, in zones elsewhere in Manhattan that the toll doesn’t apply to. That comparison strips out normal year-over-year demand shifts and isolates the toll’s actual effect.
The results, all statistically significant at the 0.1% level: total trips served by Uber, Lyft, and other high-volume for-hire apps fell 5.95% in the congestion zone relative to the control areas. Shared trips requested by riders fell 38.08%. Shared trips that were actually matched with another passenger fell 50.87% — cut essentially in half. The researchers re-ran the same analysis using Brooklyn and Queens as separate control groups instead of the rest of Manhattan, and got results in the same direction and of similar magnitude both times.
Why shared rides took the hit almost alone
The mechanism the researchers point to is in the toll’s own structure. NYC’s pre-existing congestion surcharge, which has applied to for-hire trips since 2019, offers a reduced rate for shared trips. The new congestion relief zone toll doesn’t. Two strangers matched into the same UberX Share trip each still get charged the full $1.50 — meaning a shared ride can cost the same combined toll as two separate solo trips would have, while offering none of the trip-time savings a rider gets from booking a private car directly. The economic case for choosing the shared option, already a thinner margin than most riders realize, mostly evaporated the moment the toll took effect with no carve-out for it.
That distinction — solo trips down modestly, shared trips down by half — is exactly what’s invisible in a simple before-and-after trip count. The TLC’s own report tracks total for-hire volume, which nets out a small decline in solo Uber/Lyft trips against a shift toward taxis, and reports something close to flat. It isn’t set up to isolate what happened specifically to the shared-ride product, because doing that credibly requires the kind of control-group comparison the TLC’s tracking report doesn’t run.
The awkward part, for a toll meant to fight congestion
Shared rides are, per passenger carried, the most congestion-efficient thing a TNC offers — two or three riders splitting one vehicle’s road space instead of each taking a separate car. A policy whose entire premise is reducing the number of vehicles clogging Manhattan’s core has, according to this analysis, landed its heaviest blow specifically on the ride-hail option that puts the fewest vehicles on the road per passenger. If some of the roughly 40% of riders who stopped requesting a shared trip switched to booking solo TNC rides instead — which the data can’t fully rule out — the toll may be nudging demand in the opposite direction from its own stated goal, even while succeeding at making solo TNC trips modestly more expensive and less frequent.
The researchers are careful about the limits of their own method: a difference-in-differences design assumes the control zones would have tracked the treatment zones absent the toll, and they note that shared-trip demand was already trending slightly differently between the two groups before January 2025, which complicates a fully clean read on the shared-ride numbers specifically. The total-trip finding is on firmer ground. Even accounting for that caveat, a decline of roughly 40 to 50% in shared-ride activity is too large to be explained by ordinary noise in the pre-existing trend.
An early window, not the full first year
One honest limit on how far this study’s numbers travel: it covers only the toll’s first 14 weeks, January through early April 2025, not the full first year. The MTA released its own one-year evaluation of congestion pricing in January 2026, and the TLC’s most recent for-hire vehicle report — covering January through September 2025 — is already the broader, longer window referenced above, showing that modest 1.4% net change in overall for-hire activity. It’s possible demand patterns settled differently as riders and drivers adjusted over months rather than weeks; a shared-ride option that collapses by half in the first quarter after a policy change isn’t guaranteed to stay collapsed by the same margin a year in. What the Findings study establishes reliably is that the toll caused a real, statistically significant behavior change in its early months, disproportionately concentrated in shared trips — not that the exact 51% figure is where things permanently settled.
For drivers, the shift has a direct earnings dimension too: a shared trip that doesn’t get requested, or gets requested but never matched, still puts a driver’s car on the road for a solo fare — meaning the $1.50 toll gets paid on more individual trips overall relative to how many passengers are actually being moved, even as total trip count ticks down. Whether that toll is passed through in the fare, absorbed by the platform, or eaten by the driver depends on Uber and Lyft’s own pricing decisions, which neither the TLC’s report nor the academic study tracks directly.
What we did
We read the full published study — methodology, regression tables, and robustness checks included — rather than relying on the abstract, to confirm the reported percentages matched the underlying difference-in-differences coefficients and that the robustness checks (alternate control groups in Brooklyn and Queens) supported the headline result. We separately pulled the NYC TLC’s own congestion-pricing tracking figures to compare the study’s causal estimate against the city’s simpler before-and-after reporting, and confirmed the toll structure — the $1.50 per-trip TNC charge with no shared-ride discount, versus $0.75 for taxis — against the MTA’s published toll schedule.