
This series set out to answer a simple-sounding question — what does the gap between box office revenue and ticket admissions actually mean — and ended up mapping a single, consistent story across nine separate angles: a shrinking audience, paying substantially more per visit, for a smaller and more concentrated slate of films, increasingly funneled toward premium formats and a handful of dominant genres and studios. None of those trends look like a temporary disruption working itself out. Laid end to end, they look like a new equilibrium the industry has already, quietly, settled into.
The thirty-year shape of the story
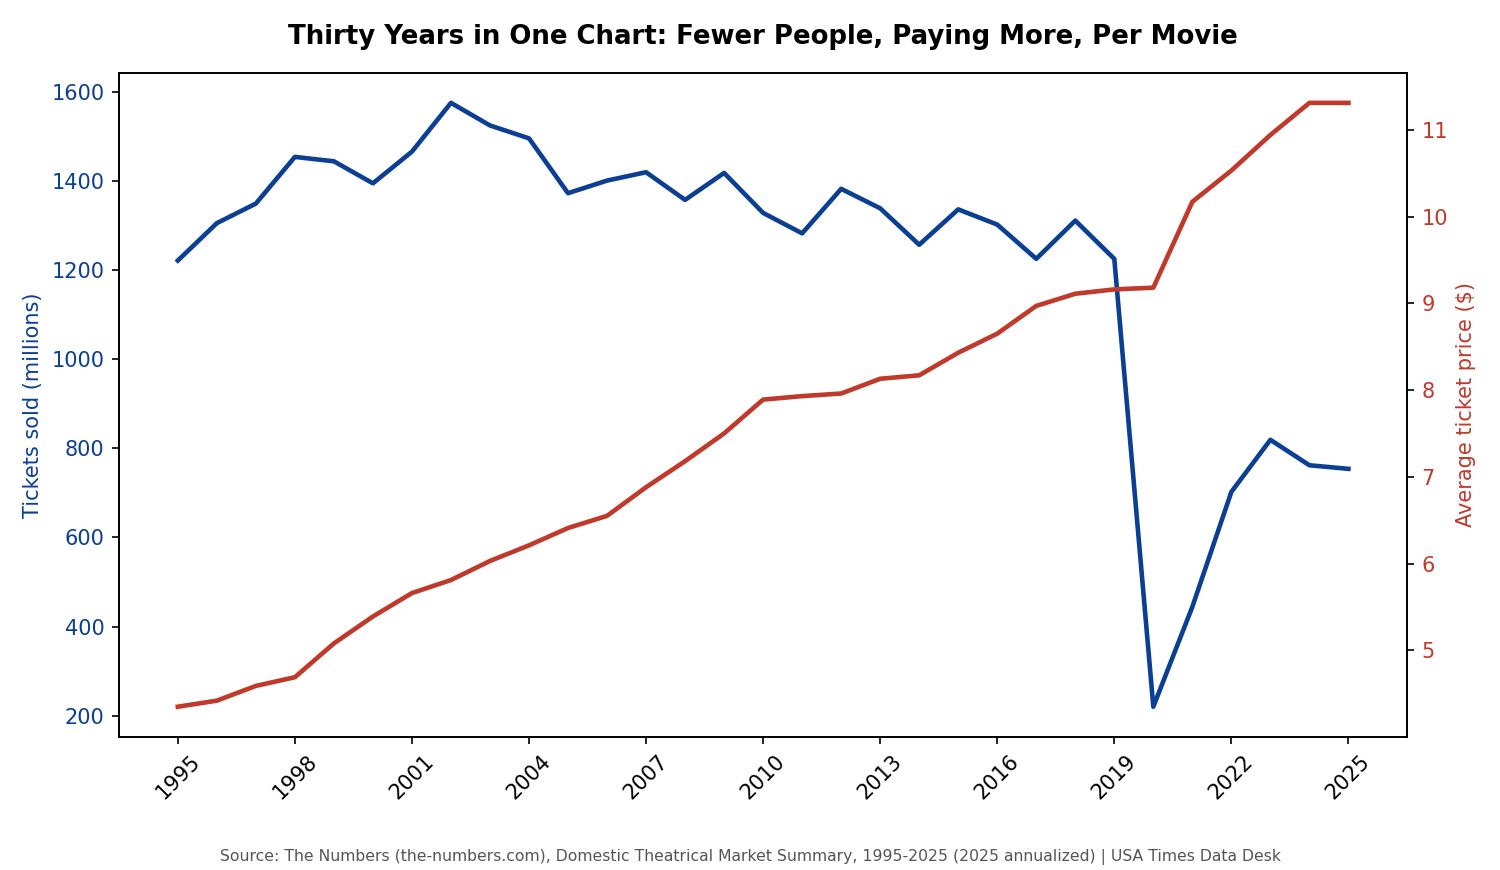
Viewed across the full three decades this dataset covers, the pattern is unmistakable: ticket sales rose gently through the late 1990s and early 2000s, peaked around 2002, drifted downward with cyclical bumps through the 2010s, then fell off a cliff in 2020 and have only partially recovered since — while average ticket price has climbed in an almost unbroken line the entire time, accelerating rather than slowing after the pandemic. Two lines that used to occupy the same rough territory on a chart have ended up in completely different places: tickets sold down about 45% from their mid-2000s levels, average price up more than 75% over the same window.
What this series found, in one list
Revenue has held roughly flat in nominal terms while admissions collapsed, because price increases have offset volume losses almost dollar for dollar. In real, inflation-adjusted terms, the box office actually peaked in 2002 and has never recovered — meaning even the “healthy” pre-pandemic years were already a diminished version of the industry’s own historical high. Per-capita moviegoing has fallen by more than half since 2005, meaning the decline isn’t just a population-adjusted illusion — the actual habit of going to the movies has genuinely eroded. The pandemic didn’t create these trends but sharply accelerated them, and the post-pandemic recovery has plateaued well below 2019 levels rather than continuing to climb. Studios have responded by releasing fewer, bigger films concentrated overwhelmingly in Adventure and Action genres, funded disproportionately by six major studios that control 77% of all box office revenue, while premium formats like IMAX have become one of the few genuine growth stories in an otherwise shrinking market.
Why “new normal” is the right frame, not “temporary slump”
A slump implies a return to a prior baseline is the expected outcome, absent from any specific data point in this series. Admissions plateaued in 2024-2025 well below 2019 levels rather than continuing to climb. Real box office has been below its 2002 peak for more than two decades, including in years with no obvious disruption to explain the gap. Per-capita moviegoing has fallen steadily across multiple distinct eras — pre-pandemic, pandemic, and post-pandemic — rather than dropping sharply in one period and holding flat elsewhere. Trends that persist across that many distinct time periods, disruptions, and economic conditions are better described as a structural shift in how large a role theatrical moviegoing plays in American entertainment consumption, not a temporary dip awaiting a rebound.
Three ways this could go from here
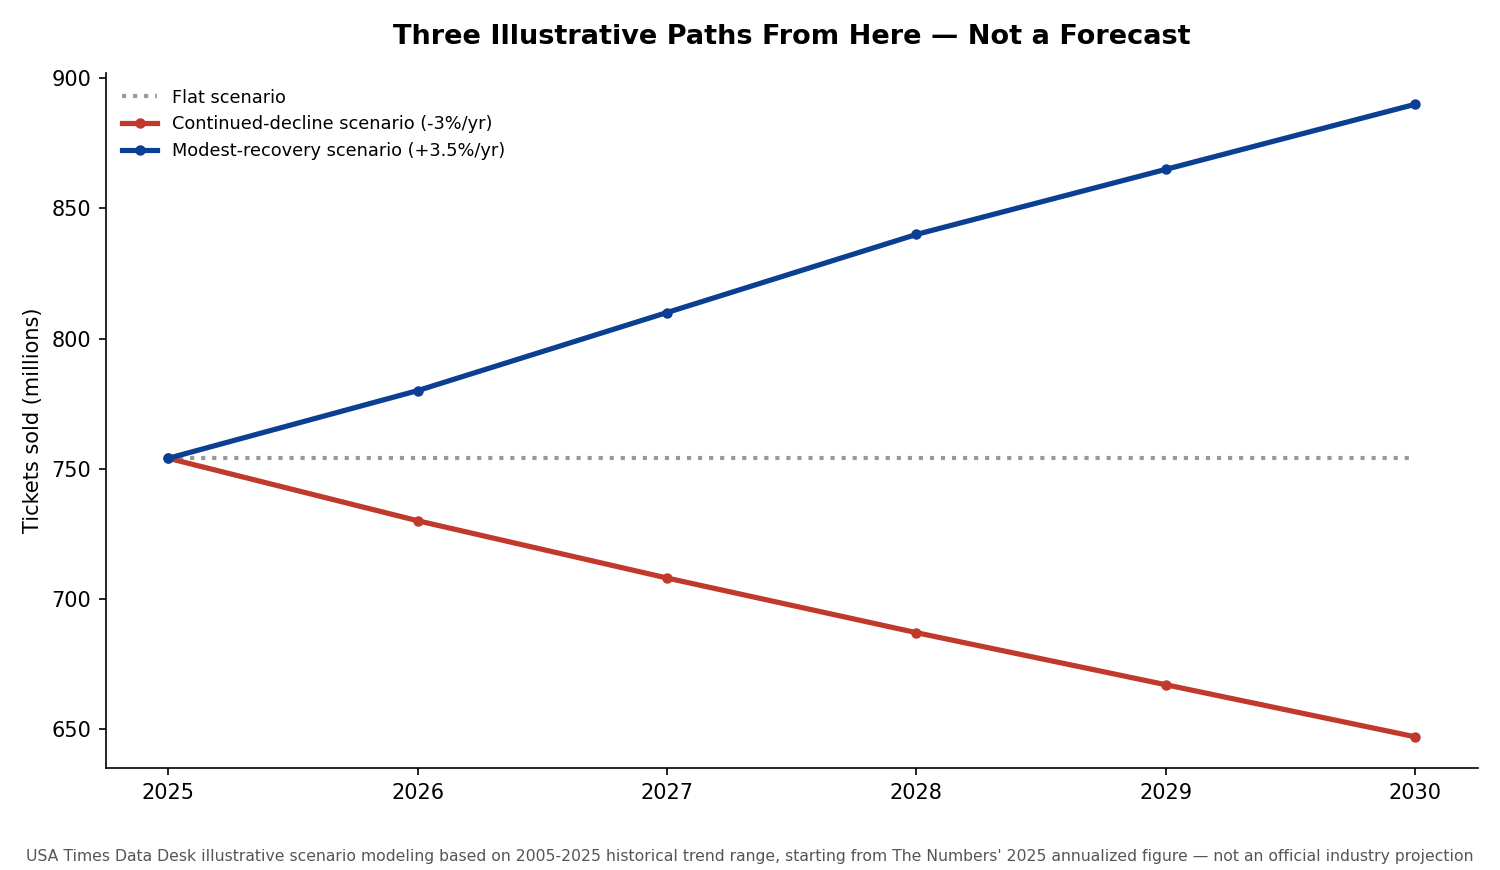
None of what follows is a forecast in any rigorous statistical sense — box office admissions depend on variables (release slates, macroeconomic conditions, competitive entertainment options, unpredictable cultural moments) far too complex for a simple trend extrapolation to capture reliably. But it’s useful to sketch the range of plausible paths the data’s own recent trajectory implies. A continued-decline scenario, extending the roughly 3% annual admissions erosion seen in parts of the pre-pandemic 2010s, would put admissions around 647 million by 2030 — a genuinely smaller industry than today’s already-diminished one. A flat scenario, matching the 2024-2025 plateau, would hold admissions roughly where they are now indefinitely. A modest-recovery scenario, requiring a sustained 3.5% annual admissions gain (roughly matching some of the stronger post-pandemic recovery years), would bring admissions to around 890 million by 2030 — still well below 2019’s 1.23 billion, but a meaningfully healthier trajectory than either of the other two paths.
What would actually move the needle
Based on the specific mechanisms this series identified, a few levers stand out as more plausible drivers of a genuine recovery than others. Continued premium-format expansion could keep growing revenue but, by this series’ own analysis, does relatively little to grow total admissions — it’s a per-ticket price lever, not a volume lever. A meaningful expansion of the release calendar back toward its mid-2010s scale, with a genuine mix of budget tiers and genres rather than continued concentration in Adventure and Action tentpoles, could in theory win back some of the “casual” moviegoer audience this series found evidence of losing — but that would require studios to bet against the fewer-bigger-releases logic that has otherwise looked financially rational to them for the past decade. And any reversal in ticket-price growth relative to general inflation — pricing that tracks the broader economy rather than consistently outpacing it — could plausibly slow the erosion of price-sensitive casual attendance, though it would also mean giving up some of the revenue cushion that premium pricing has provided against declining volume.
The honest bottom line
Nothing in twenty years of this data points toward theatrical moviegoing returning to its early-2000s scale, and nothing in the post-pandemic trend suggests a return to 2019 levels is imminent either. What the data does show is an industry that has adapted its business model successfully to a smaller audience — protecting revenue through pricing and format strategy even as the underlying customer base has shrunk by nearly half. Whether that adapted model represents a stable, sustainable new normal or merely a slower version of the same decline remains the one question this dataset, on its own, genuinely cannot answer — and it’s the question worth watching most closely in the years ahead.
What we did
This synthesis piece draws on the same core dataset used throughout this series: annual admissions, nominal and inflation-adjusted box office revenue, average ticket price, and wide-release counts from The Numbers’ Domestic Theatrical Market Summary (the-numbers.com), 1995-2025 (2025 figures annualized per The Numbers’ own labeling), alongside U.S. Census Bureau population estimates, Bureau of Labor Statistics CPI data, and IMAX Corporation’s public investor disclosures, each sourced in detail in this series’ individual articles. The three admissions scenarios shown in the second chart (continued-decline, flat, and modest-recovery) are explicitly labeled illustrative modeling by USA Times Data Desk, built from historical trend ranges observed in this dataset — they are not official industry forecasts from any studio, trade organization, or research firm, and should not be read as predictions. The discussion of “what would move the needle” reflects our own analysis and synthesis of the patterns documented across this series, informed by general industry commentary, rather than a claim of privileged insight into any studio’s or exhibitor’s actual strategic plans.