This is the first entry in USA Times Box Office Tracker, a recurring look at the weekend domestic box office chart, theater counts, and how titles are trending week over week. Figures below are for the weekend ending July 10, 2026, compiled from publicly reported studio estimates.
Minions & Monsters holds the top spot
Minions & Monsters topped the chart for another weekend with $20.5M across 4,244 theaters, pushing its domestic total past $108M. Young Washington held at No. 2 with $6.4M, while newcomer The Invite opened in third on a comparatively narrow 1,610-screen release.
Long tail: the real story is in the totals column
Michael is still playing on 270 screens and has quietly crossed $371M domestic — a reminder that weekend rank and total gross tell very different stories. Obsession and Backrooms are both well past the $190M mark while barely registering in weekend charts anymore.
Batmandir · Guest Passes Step inside for a day. Guest passes from $161/day — brought in by a member. See guest passes →Where this data comes from
Numbers are compiled from publicly reported studio box office estimates (the same figures used across the industry — Box Office Mojo and The Numbers both track and publish this data). Format-specific splits (IMAX, premium large format, 3D) generally require a licensed data feed such as Comscore or EntTelligence and aren’t included in this free tier of tracking; we’ll flag it clearly on any story where we have that data and where we don’t.
USA Times Box Office Tracker runs weekly. Have a chart trend or format story you want us to dig into? Send a tip.
What a quiet week at the top reveals
A week in which an animated holdover like Minions & Monsters retains the number-one spot without a major new challenger is, in its own understated way, a revealing snapshot of the modern box office. These are the weeks between the giants — the stretches when no franchise tentpole is scheduled to detonate, and the top of the chart belongs to whatever family film or holdover happens to have the broadest, most durable appeal. Animation excels in exactly these conditions, because family audiences spread their business across weeks rather than stampeding on opening night, giving a well-liked animated title the legs to hold the top spot through several quieter frames.
The steady, unflashy climb of a title like Michael past a major cumulative milestone tells a complementary story. Not every success at the box office announces itself with a record-breaking opening weekend; some films build their totals patiently, week over week, on word of mouth and repeat business, quietly accumulating a large gross without ever dominating a single frame. These slow-burn earners are easy to overlook in a media environment fixated on opening-weekend records, but they are often among the most profitable films of any given period, precisely because their long runs are cheap to sustain and their audiences are loyal.
Why the weekly tracker matters
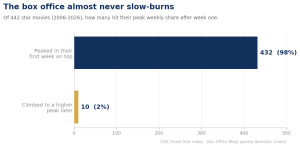
Following the box office week by week, rather than only at the headline-grabbing openings, is the only way to see the real shape of the market. The opening weekend captures anticipation; the weeks that follow capture satisfaction — whether audiences actually embraced a film or merely showed up once out of curiosity. A film that opens huge and collapses the next week tells a very different story than one that opens modestly and holds for a month, and only sustained tracking reveals the difference. The weekly view is where the durable hits separate themselves from the flashes in the pan.
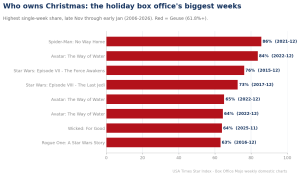
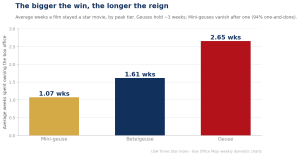
It is also where the broader trends of the USA Times Star Index become visible. Whether a given week produces an outright Geuse, a clear but modest number-one, or a fragmented field with no dominant film at all is a data point in the long story of box-office concentration — the steady drift, across two decades, from a shared and plural marketplace toward one increasingly owned by a handful of giants. Each weekly update is a single frame in that longer film, and following them in sequence is how the pattern reveals itself.
As with all box-office reporting, the figures here are the best available estimates at the time of writing, drawn from studio reports and industry trackers, and early numbers are occasionally revised as final totals are confirmed. But the relative picture — which film led, how completely, and how the week was shaped — is the durable and meaningful part, and it is what the tracker is built to capture.
Reading the field beneath the leader
The number-one film is only ever half the story of a box-office week; the shape of the field beneath it matters just as much. A week in which the leader holds a modest share and several other titles cluster close behind describes a healthy, competitive marketplace where audiences have real choices. A week in which one film towers over a barren field describes the opposite — a market narrowed to a single option. Tracking not just who leads but how completely, and what fills the space below, is what turns a simple chart of grosses into a genuine reading of the industry’s health. The films that quietly hold and build in the middle of the chart are, collectively, the connective tissue of a functioning box office, and their presence or absence tells us as much as the identity of whoever sits on top.
Ultimately, a single week’s chart is a frame in a much longer film, and its real value emerges only in sequence. One quiet week in which an animated holdover keeps the top spot means little on its own; strung together with the weeks around it, it becomes part of the evidence for how the modern box office actually behaves — where the giants fall on the calendar, how long hits hold, and how completely the market concentrates around its biggest titles. That is why we track it week after week: not because any single frame is decisive, but because the pattern only becomes visible once you have watched enough of them in a row.
Related from the USA Times Data Desk
- The Marathoners: The Films That Owned the Box Office the Longest
- The Efficiency Champions: How Cheap Horror Owns the Box Office
- Wikipedia le atribuye a una película de Bollywood de 1982 casi el doble de la recaudación de Sholay. Sus citas son sobre películas completamente distintas.
- When the Rules Broke: The Pandemic Movies That Owned an Empty Box Office
- Box-office coverage index · the Star Index methodology
Sources
- Box Office Mojo — Weekend Domestic Box Office
- Box Office Mojo — Yearly Domestic Box Office
- The Numbers — Weekly Box Office Chart
- USA Times — Star Index methodology & data sources