Read in: English · Español · Русский · 中文 · Português
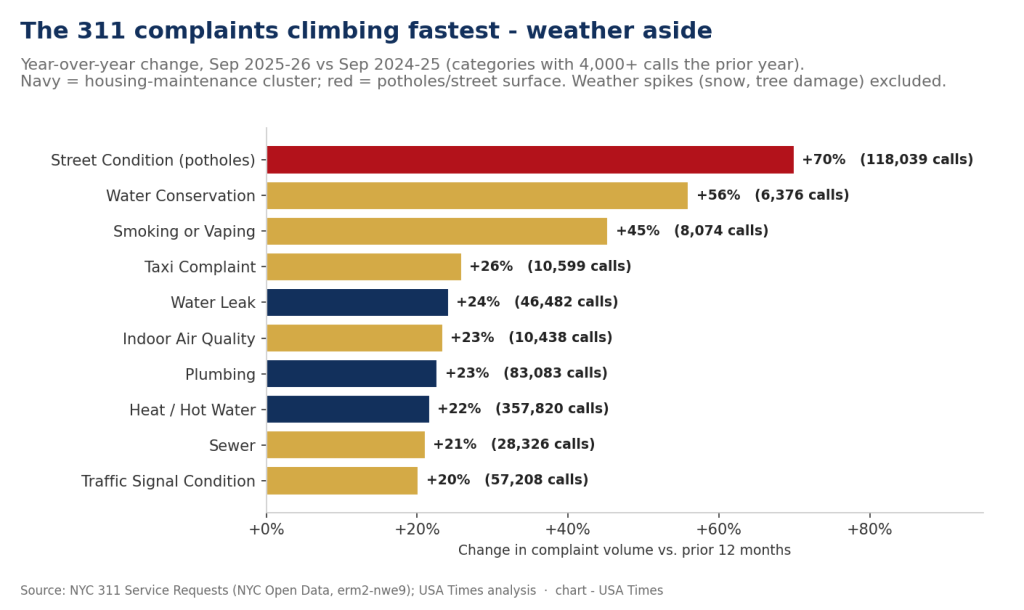
New Yorkers filed nearly four million 311 service requests in the last twelve months, and the mix is never static. Some complaints are seasonal noise; some are the slow signal of a city changing under its residents’ feet. We compared the most recent twelve months of 311 data – September 2025 through August 2026 – against the twelve months before it, category by category, to find which complaints are climbing fastest and where the increases are concentrated. Two real stories emerged from the noise: the streets are falling apart, fastest in Queens, and the housing-maintenance complaints that spike every winter are running higher than they did a year ago.
First, the weather caveat
The single fastest-rising category in the raw data was “Snow or Ice,” up an eye-watering 626% – from about 8,800 calls to nearly 64,000. That is not a trend; it is a snowier winter. “Damaged Tree” (+60%) and “Overgrown Tree/Branches” (+20%) move with storms the same way. We’ve set those weather-driven categories aside in the chart above, because a responsible reading of 311 has to separate what the sky did from what the city is doing. What’s left, once you strip the weather out, is more telling.
Batmandir · Guest Passes Step inside for a day. Guest passes from $161/day — brought in by a member. See guest passes →The streets: up 70%, and nearly doubling in Queens
The clearest non-weather signal is the road surface itself. “Street Condition” complaints – the 311 catch-all for potholes, cracked asphalt, failed roadbeds and sunken cuts – jumped 70% citywide, from about 69,000 calls to 118,000. Among high-volume categories, nothing structural rose faster. And it did not rise evenly. Broken out by borough, Queens nearly doubled, from 24,713 complaints to 48,926 (+98%). The Bronx was close behind at +77%, Brooklyn +53%, Staten Island +52% and Manhattan +45%. Queens alone now generates more street-condition complaints than any other borough by a wide margin – a plausible consequence of a harsh freeze-thaw winter landing on the borough’s vast, aging arterial road network.
Street-condition complaints are worth watching precisely because they are a leading indicator of spending: every one is a potential pothole repair, and a sustained doubling in a borough is the kind of thing that shows up months later in a paving budget. If the Queens surge holds through another winter, it will be hard for the city to treat as noise.
The housing cluster: heat, plumbing and leaks all up together
The second real story is quieter but broader. Four housing-maintenance categories rose in lockstep, roughly 22 to 24 percent each: “Water Leak” (+24%), “Plumbing” (+23%), and the giant of the whole 311 system, “Heat/Hot Water” (+22%), which at 357,820 calls is the third-largest complaint category in the city behind only illegal parking and residential noise. When leaks, plumbing and heat all climb by similar amounts at once, it usually points the same direction: aging building systems and landlords slower to fix them, not a single weather event.
Geographically, the heat-and-hot-water burden falls where it always has – the Bronx logs the most in absolute terms, 122,410 complaints in the latest year – but the fastest increase was in Brooklyn, up 30% to nearly 99,000, followed by Manhattan (+24%). Heat complaints are governed by the city’s heat season, which runs October 1 through May 31 and requires landlords to keep apartments at a minimum temperature; a rise across multiple boroughs means more tenants spent more of that season cold enough to call.
| Complaint | Borough | Prior yr | Latest yr | Change |
|---|---|---|---|---|
| Street Condition | Queens | 24,713 | 48,926 | +98% |
| Street Condition | Bronx | 7,118 | 12,574 | +77% |
| Street Condition | Brooklyn | 18,638 | 28,504 | +53% |
| Heat / Hot Water | Brooklyn | 75,802 | 98,755 | +30% |
| Heat / Hot Water | Manhattan | 69,937 | 86,393 | +24% |
| Heat / Hot Water | Bronx | 106,188 | 122,410 | +15% |
The smaller risers, and what’s falling
A few mid-size categories rose sharply enough to note. “Smoking or Vaping” complaints climbed 45% – consistent with the city’s continuing crackdown on unlicensed smoke shops. “Taxi Complaint” rose 26%, and “Water Conservation” (largely open-hydrant and running-water reports) rose 56% off a small base. On the other side of the ledger, several categories fell hard: “Drug Activity” complaints dropped 62%, “Lead” complaints fell 44%, and “New Tree Request” collapsed 82% – the last almost certainly a change in how the Parks Department intakes planting requests rather than a loss of civic interest in trees.
One decline is directly connected to a story we’ve reported: honking and vehicle-noise complaints fell sharply after congestion pricing began, part of the quality-of-life shift we documented in the toll’s first six months. And the drop in rat complaints we tracked below pre-pandemic levels continues to hold. 311 is at its best read this way – not as a scoreboard, but as the city telling you, in millions of small calls, which problems are getting worse and where.
The giants that dwarf everything else
None of the fast risers above comes close to the sheer scale of the categories that dominate 311 every year. The single largest complaint type in the city is Illegal Parking, with 612,319 calls in the latest twelve months – and it is not standing still either, up about 12% from 548,860 the year before. Behind it sit Noise – Residential (436,971) and Heat/Hot Water (357,820). Those three categories alone account for well over a third of all service requests in New York. When people picture what 311 is for, they picture exactly this: a neighbor’s blocked hydrant, a party two floors up, a cold apartment in January. The fast-rising categories are the news; the giants are the weather system everything else moves through.
That illegal parking keeps climbing is its own small story. It is partly a real enforcement-and-behavior phenomenon and partly a reporting one: the city has made it easier to file a blocked-hydrant or blocked-bike-lane complaint, and New Yorkers have taken up the tool enthusiastically. It is a useful reminder that 311 counts calls, not conditions – a rise can mean a problem is getting worse, or simply that more people know how to report it, or both. We read the housing-maintenance and street-condition surges as real because they move together and align with physical drivers (a hard winter, aging systems); we treat a category like illegal parking with more caution precisely because reporting friction has changed.
What fell, and why it’s worth noticing
The declines are as revealing as the increases. “Drug Activity” complaints fell 62%, “Lead” complaints 44%, and “Noise – Helicopter” 38%. Some of these reflect genuine change on the ground; others reflect changes in how complaints are routed between agencies or intake forms are structured, which is why we resist reading any single category’s drop as unambiguous good news. The one decline we can tie directly to a documented cause is vehicle noise: honking and engine-noise complaints fell sharply after congestion pricing thinned traffic below 60th Street, a quality-of-life dividend the MTA itself highlighted and one small piece of the roughly 45% drop in that category the agency reported. When a policy changes the physical city, 311 registers it – which is exactly what makes the system worth reading as a sensor and not just a switchboard.
The “where” is not just color; it is operationally useful. A 70% jump in street-condition complaints concentrated in Queens is a Department of Transportation paving problem; a broad rise in heat and hot-water complaints that leans on the Bronx and Brooklyn is a Housing Preservation and Development enforcement problem. Reading 311 by category and borough together is how you turn four million individual gripes into something a city agency can actually plan around – which corridor to repave first, which landlords to lean on before the next heat season. That is the quiet civic value of the dataset: it is the largest continuously updated survey of what is going wrong in New York, block by block, that anyone has.
What we did
We queried the NYC 311 Service Requests dataset (NYC Open Data identifier erm2-nwe9) through the Socrata API, counting service requests by complaint type for two twelve-month windows: September 1, 2025 to August 31, 2026 (the latest full year available) and September 1, 2024 to August 31, 2025 (the prior year). We computed year-over-year percentage change for every category and, to avoid the volatility of tiny samples, restricted the “fastest-rising” ranking to categories with at least 4,000 complaints in the prior year. We excluded weather-driven categories (snow/ice, tree damage) from the headline chart and flagged them in the text. For the two largest structural risers, street condition and heat/hot water, we re-ran the query grouped by borough to locate the increases. All figures are counts of service requests, which reflect reporting behavior as well as underlying conditions.
Sources
- NYC 311 Service Requests from 2010 to Present (NYC Open Data, erm2-nwe9)
- NYC 311
- NYC HPD: Heat and Hot Water rules (heat season Oct 1 – May 31)
- USA Times: Congestion Pricing, Six Months In
- USA Times: NYC Rat Complaints Fell Below Pre-Pandemic Levels