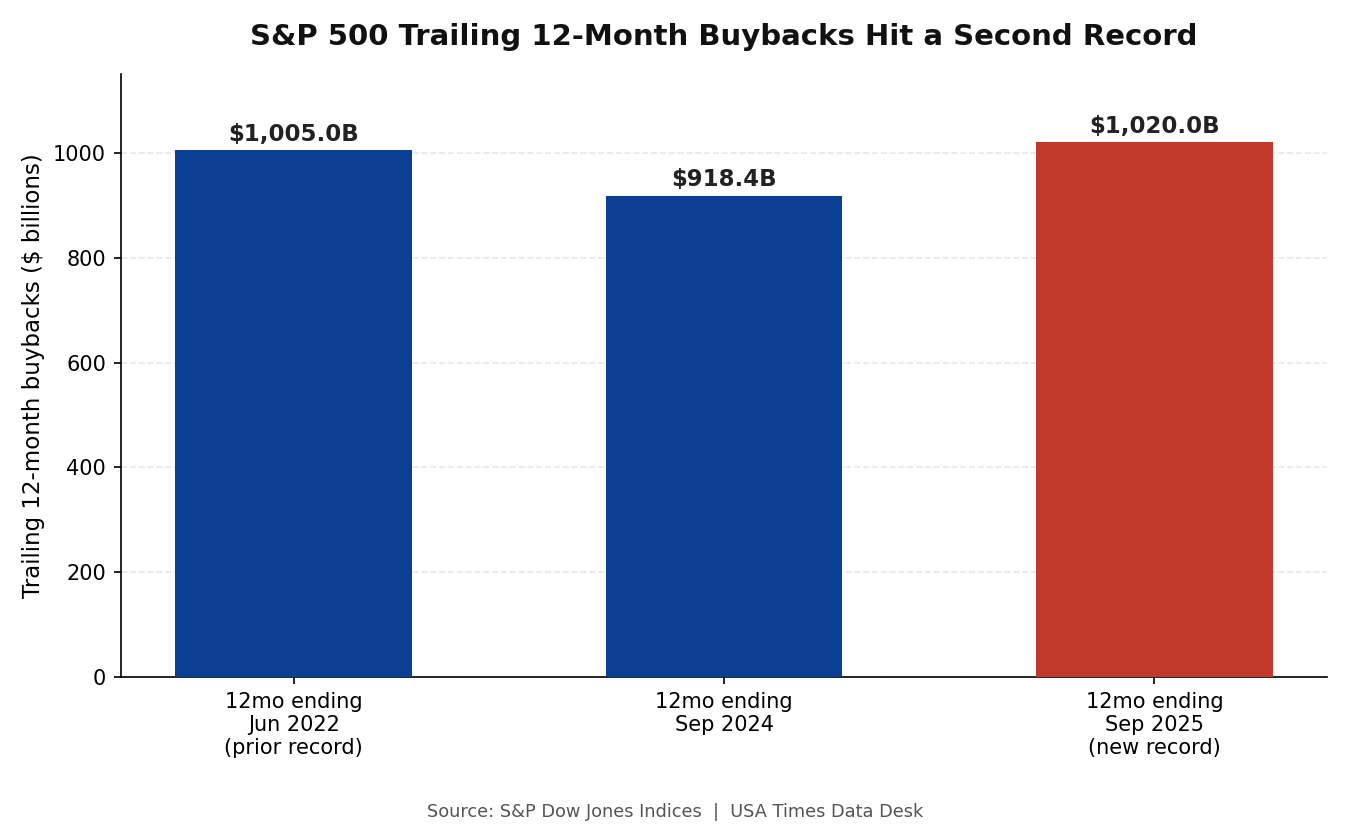
S&P 500 companies spent a record $1.020 trillion buying back their own shares in the 12 months ending September 2025, according to preliminary data from S&P Dow Jones Indices. It is only the second time in history the trailing 12-month total has topped $1 trillion — and it broke the previous record of $1.005 trillion, set for the year ending June 2022, by about 1.5%.
Buybacks reduce a company’s share count, which mechanically raises earnings per share even if total profit doesn’t grow — one reason the pace of buybacks has become something Wall Street watches as closely as dividends. Combined with dividends, S&P 500 companies returned a record $1.685 trillion to shareholders over the same 12-month window.
A choppier year than the trailing total suggests
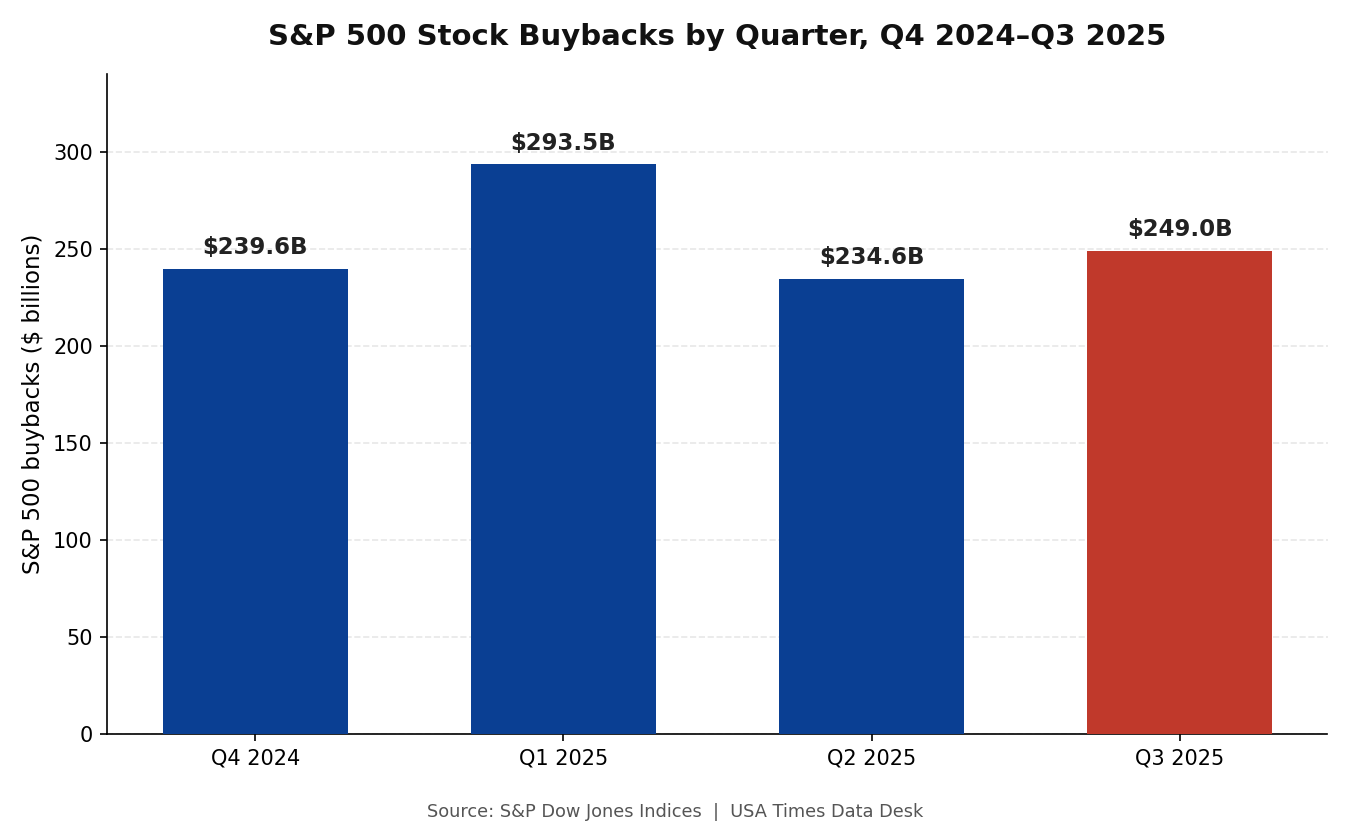
The quarter-by-quarter pattern in 2025 wasn’t a straight climb. Q1 2025 buybacks hit $293.5 billion, itself a quarterly record. Then Q2 dropped sharply to $234.6 billion, a 20.1% decline, before Q3 recovered to $249.0 billion — up 6.2% from Q2 and up 9.9% from Q3 2024. The trailing 12-month record, in other words, was built on a strong start to the year and a partial rebound in the back half, not on sustained quarter-over-quarter growth throughout 2025.
Batmandir · Founders A numbered seat at the table. S3 · The Founders Club — 161 seats per location. By invitation. Explore membership →Dividends followed a steadier path. S&P 500 companies paid $168.1 billion in dividends in Q3 2025, pushing the trailing 12-month dividend total to a record $664.9 billion. Unlike buybacks, which companies can turn on and off from quarter to quarter depending on cash position and share price, dividend payments tend to move in one direction — up, slowly, and rarely cut — which is why the dividend total has now set records for several consecutive periods without the volatility visible in the buyback chart.
Four companies did an outsized share of the buying
Buyback spending is concentrated. The 20 largest buyback companies accounted for 49.5% of the entire S&P 500 total in Q3 2025 — down slightly from 51.3% in Q2, but still well above the historical average of 47.8% for that group, according to S&P Dow Jones Indices.
Four of the largest individual buyers in Q3 2025 were NVIDIA ($14.9 billion for the quarter, $51.8 billion over the trailing 12 months), Alphabet ($11.5 billion for the quarter, $55.8 billion trailing 12 months), Meta Platforms ($8.5 billion for the quarter, $44.2 billion trailing 12 months), and JPMorgan Chase ($8.3 billion for the quarter, $27.6 billion trailing 12 months). Between them, those four companies’ trailing 12-month buyback spending — roughly $180 billion — is close to a fifth of the entire S&P 500 total.
Top Q3 2025 Buyback Spenders — Quarter vs. Trailing 12 Months
Hover a bar for exact figures
Source: S&P Dow Jones Indices | USA Times Data Desk
Where the money moved by sector
Sector-level buyback activity shifted noticeably in Q3 2025. Financials led with $65.3 billion in buybacks, up 26.3% from Q2 and equal to 26.2% of the entire S&P 500 total for the quarter — the largest single-sector share. Health Care buybacks jumped 32.2% to $21.0 billion. Materials moved the opposite direction, falling 21.0% to $3.6 billion, one of the sharpest sector pullbacks in the quarter.
The swing toward Financials buybacks lines up with a broader pattern this year: bank stress-test results and capital-return plans, released each summer, tend to unlock buyback authorizations that show up in Q3 spending. Materials companies, by contrast, are more directly exposed to commodity-price swings and tariff-driven input-cost uncertainty, which can make boards more conservative about committing cash to repurchases in a given quarter.
The buyback excise tax is a small but real drag
Since 2023, corporations doing buybacks have paid a 1% federal excise tax on the value of stock repurchased, a provision from the Inflation Reduction Act. S&P Dow Jones Indices estimates the tax reduced S&P 500 operating earnings by 0.36% in Q3 2025 and by 0.40% over the trailing 12 months — a real cost, but a small one relative to the scale of buyback spending itself, and not enough on its own to explain the quarter-to-quarter swings in repurchase activity.
Why this matters beyond the headline number
Trillion-dollar buyback years get attention as a headline, but the more useful signal is what the pattern says about corporate cash allocation. Companies buy back stock instead of, or alongside, reinvesting in the business, paying down debt, or raising dividends — and a record buyback year during a period of elevated interest rates and heavy AI-related capital spending by some of the same top buyback companies (Alphabet and Meta both appear on the top-buyer list while also disclosing record capital expenditure guidance) suggests many boards see enough free cash flow to do both at once, rather than facing a real trade-off between the two.
The concentration figures are worth watching too. When roughly half of all S&P 500 buyback spending comes from 20 companies, the index-level “record” is materially a story about a small number of very large, cash-generative firms — not a broad-based shift in payout policy across the median S&P 500 company.
The number is still preliminary
S&P Dow Jones Indices publishes buyback data on a rolling basis and labels each new quarterly release as preliminary, since not every S&P 500 constituent has filed by the time the report goes out. Figures typically get revised — usually modestly upward — as more companies file their quarterly reports in the weeks after a report’s initial publication. That means the $249.0 billion Q3 2025 figure, and the $1.020 trillion trailing 12-month total built on it, could tick higher once S&P Dow Jones Indices issues its next update. It’s a pattern that has held in prior quarters: preliminary buyback totals have rarely been revised down by a material amount, since the missing filings are additions to the count rather than corrections to it.
What we did
All quarterly and trailing 12-month buyback, dividend, and shareholder-return figures, the sector breakdowns, the top-buyer figures, the buyback-concentration percentages, and the excise-tax earnings-impact estimates in this piece come directly from S&P Dow Jones Indices’ Q3 2025 buyback report, a preliminary release based on S&P 500 constituent filings, viewed via a syndicated PR Newswire distribution. The Q4 2024 quarterly figure used for chart context is derived by subtracting the sum of Q1–Q3 2025 buybacks from the trailing 12-month total for the period ending September 2025, since S&P Dow Jones Indices reports the quarterly and trailing totals but not always every individual back-quarter figure in the same release; that one figure is therefore a calculated estimate, not a directly reported number, and is presented as approximate. All other figures are reported directly by the source. We did not independently verify individual company buyback totals against each company’s own 10-Q filings for this piece; S&P Dow Jones Indices sources those figures from the same public filings.