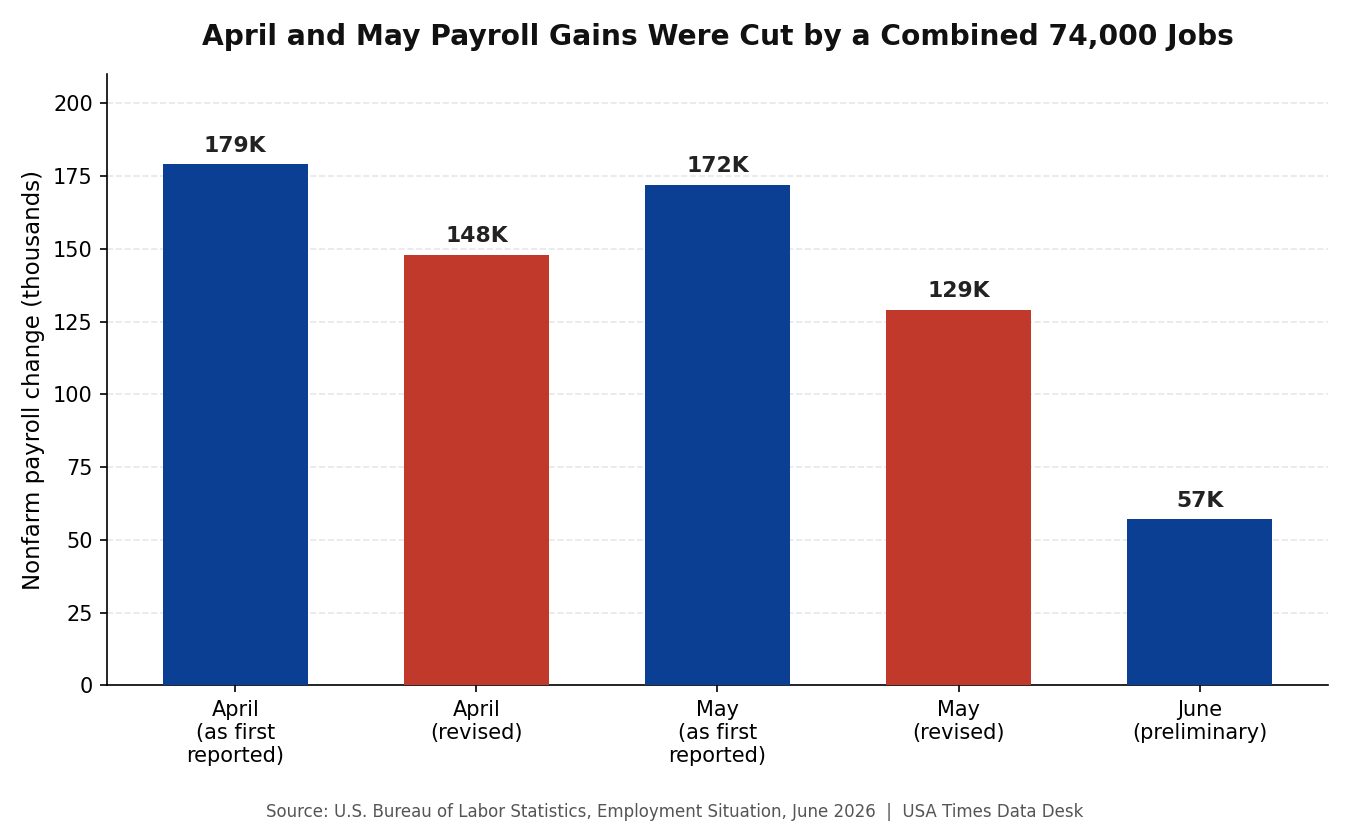
U.S. employers added 57,000 jobs in June 2026 and the unemployment rate held at 4.2%, according to the Bureau of Labor Statistics’ Employment Situation report. On its own, that headline reads as an unremarkable, in-line month. The more consequential number was buried three paragraphs down: BLS revised April’s payroll gain from a previously reported 179,000 down to 148,000, and cut May’s from 172,000 down to 129,000 — a combined 74,000 fewer jobs than the government had told the public just one and two months earlier.
Revisions of this size aren’t unusual in isolation — BLS revises nearly every month as more employer survey responses come in — but two consecutive months revised down by a combined 74,000, landing the same week as a soft 57,000 June print, describes a labor market that has been running cooler than the initial headlines suggested for three straight months now.
The unemployment rate is flat, but two other numbers moved
The topline unemployment rate — 4.2%, with 7.1 million people counted as unemployed — barely changed in June and barely changed over the past year. But two supporting numbers moved in a direction worth flagging. The labor force participation rate fell 0.3 percentage point to 61.5%, and the employment-population ratio edged down 0.2 point to 59.0%. Both measure a shrinking share of the population that is either working or actively looking for work — a decline that keeps the unemployment rate itself artificially flat, since people who stop looking for a job aren’t counted as unemployed at all.
Batmandir · Guest Passes Step inside for a day. Guest passes from $161/day — brought in by a member. See guest passes →That distinction matters because it’s the same dynamic USA Times’ Data Desk found in the JOLTS quits rate data two months ago: a “low-hire, low-fire” labor market where headline stability masks reduced churn underneath. Workers aren’t quitting because they don’t trust they can find something better; some workers aren’t job-hunting at all because they don’t expect success. BLS counted 6.0 million people not in the labor force who say they currently want a job — people the unemployment rate simply doesn’t see.
Long-term unemployment keeps climbing
The number of long-term unemployed — people out of work 27 weeks or longer — held at 1.9 million in June but is up 286,000 over the past year, and now accounts for 27.3% of all unemployed people. That share is a meaningful signal on its own: when more than a quarter of unemployed workers have been searching for over six months, it typically points to a market where job losses are concentrated and re-hiring is slow, rather than a broad-based downturn hitting everyone equally. The number of discouraged workers — people who’ve stopped looking because they don’t believe jobs are available to them — was essentially unchanged at 477,000.
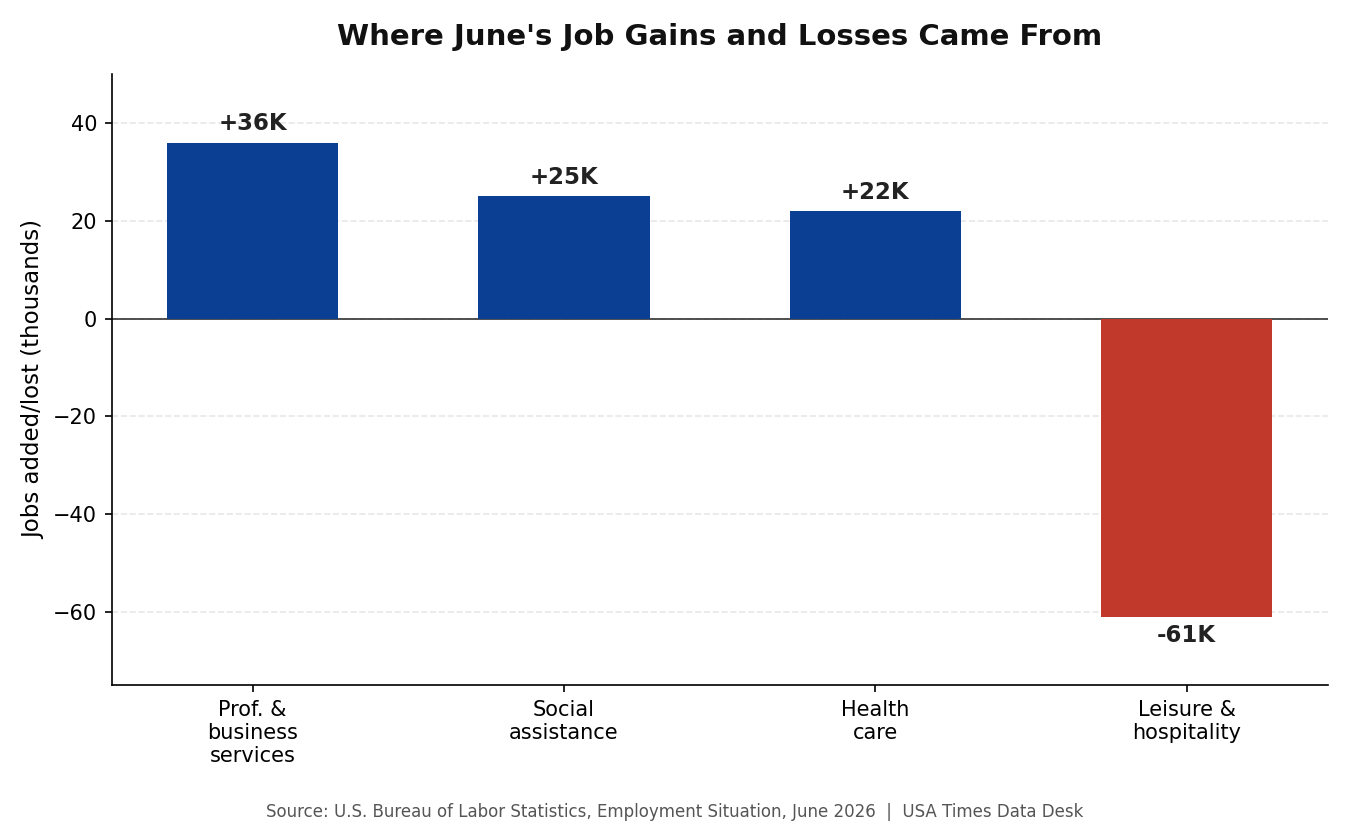
Leisure and hospitality is the one industry actually shrinking
Underneath the flat topline, industry-level hiring in June was uneven. Professional and business services added 36,000 jobs, continuing a trend that has now added 172,000 jobs to the sector since a low point in October 2025. Social assistance added 25,000, mostly in individual and family services. Health care added 22,000, though that’s a slower pace than its 38,000-a-month average over the prior year.
Leisure and hospitality was the outlier in the other direction, losing 61,000 jobs in June — a decline BLS attributed to weaker-than-usual seasonal summer hiring. The industry has shown essentially no net job growth for all of 2026 so far, a notable stall for a sector that reliably added jobs through most of the post-pandemic recovery.
Unemployment by group looks nothing alike
The 4.2% national unemployment rate is an average that hides sharply different realities by group. Adult men were at 3.9% in June and adult women at 3.7% — both little-changed. Teenagers, as is typical, ran far higher at 14.6%. By race and ethnicity, the June rates were 3.6% for White workers, 3.9% for Asian workers, 5.2% for Hispanic workers, and 6.6% for Black workers — a gap of exactly 3 percentage points between the lowest and highest of the four groups BLS tracks in this breakout. None of these group-level rates moved by a statistically meaningful amount month over month, but the persistent spread between them is itself the more durable story than any single month’s headline number: a “healthy” 4.2% national rate is still, underneath, an unemployment rate approaching 7% for Black workers specifically.
The same pattern shows up in the part-time data. BLS counted 4.7 million people employed part time “for economic reasons” in June — meaning they wanted full-time work but either had their hours cut or couldn’t find a full-time position. That number has changed little in recent months, but it represents a segment of the workforce the unemployment rate doesn’t capture at all: these are people counted as employed, full stop, even though they’re working fewer hours than they want.
June 2026 Unemployment Rate by Group
Hover a bar for the exact rate
Source: U.S. Bureau of Labor Statistics, Employment Situation, June 2026 | USA Times Data Desk
Wages are still outrunning the softer hiring numbers
Average hourly earnings for all private-sector employees rose 13 cents in June, or 0.3%, to $37.64 — up 3.5% over the past year. That’s the one number in the report that hasn’t softened: wage growth has stayed comfortably ahead of the roughly 2.5-3% range most recent inflation readings have shown, meaning workers who keep their jobs are still gaining real purchasing power even as the pace of new hiring cools. It’s a pattern consistent with an economy where employers are reluctant to lay off workers they already have — the “low-fire” half of “low-hire, low-fire” — even as they slow down on posting new roles.
What we did
Every figure in this piece — the June payroll and unemployment numbers, the April and May revision amounts, the labor force participation and employment-population figures, the long-term unemployment and discouraged-worker counts, the industry-level job changes, and the average hourly earnings data — comes directly from the Bureau of Labor Statistics’ Employment Situation news release for June 2026, published July 2, 2026, and read directly from bls.gov. We did not use any secondary aggregator or estimate for these figures. The July 2026 Employment Situation report is scheduled for release the same day this piece is being prepared; where we reference “the most recent report,” that refers to the June 2026 data, the most recent Employment Situation release confirmed published at the time of writing. BLS notes that monthly revisions result from additional employer survey responses received after the initial estimate and from recalculated seasonal factors — routine methodology, not a data error, though the size of these particular revisions is still noteworthy against the prior 12-month average monthly gain of 36,000.