
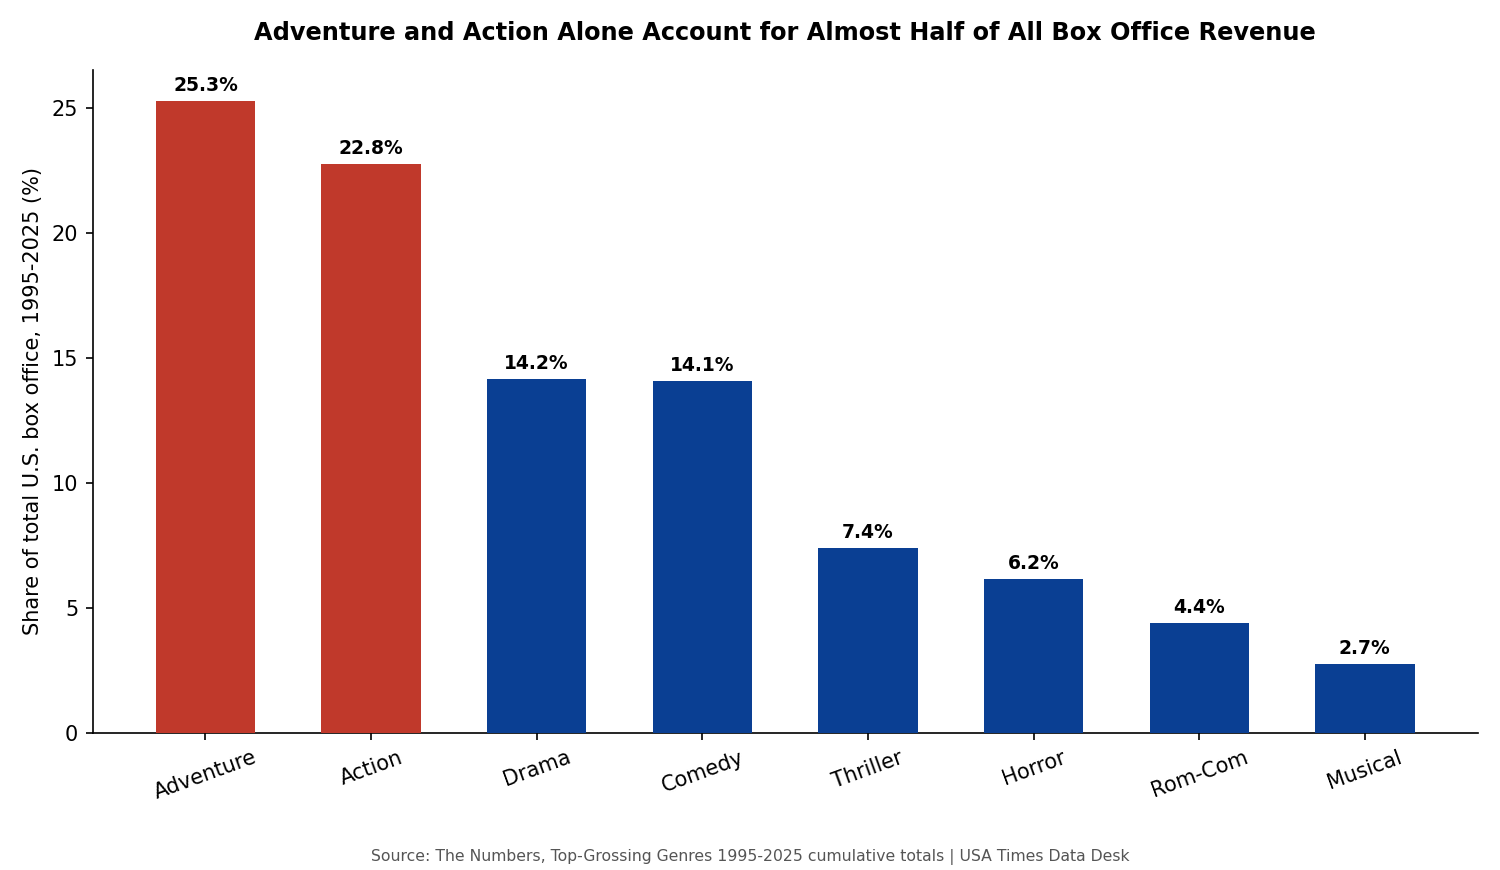
Adventure and Action films alone have accounted for 48% of every dollar the U.S. box office has generated since 1995 — nearly half of all theatrical revenue concentrated in two genres, according to three decades of data from The Numbers. Drama and Comedy, once the reliable backbone of a varied studio release calendar, combine for just over 28%. Every other genre tracked — Thriller, Horror, Romantic Comedy, Musical, Black Comedy, and Documentary — splits the remaining quarter of the market between them.
The two-genre economy
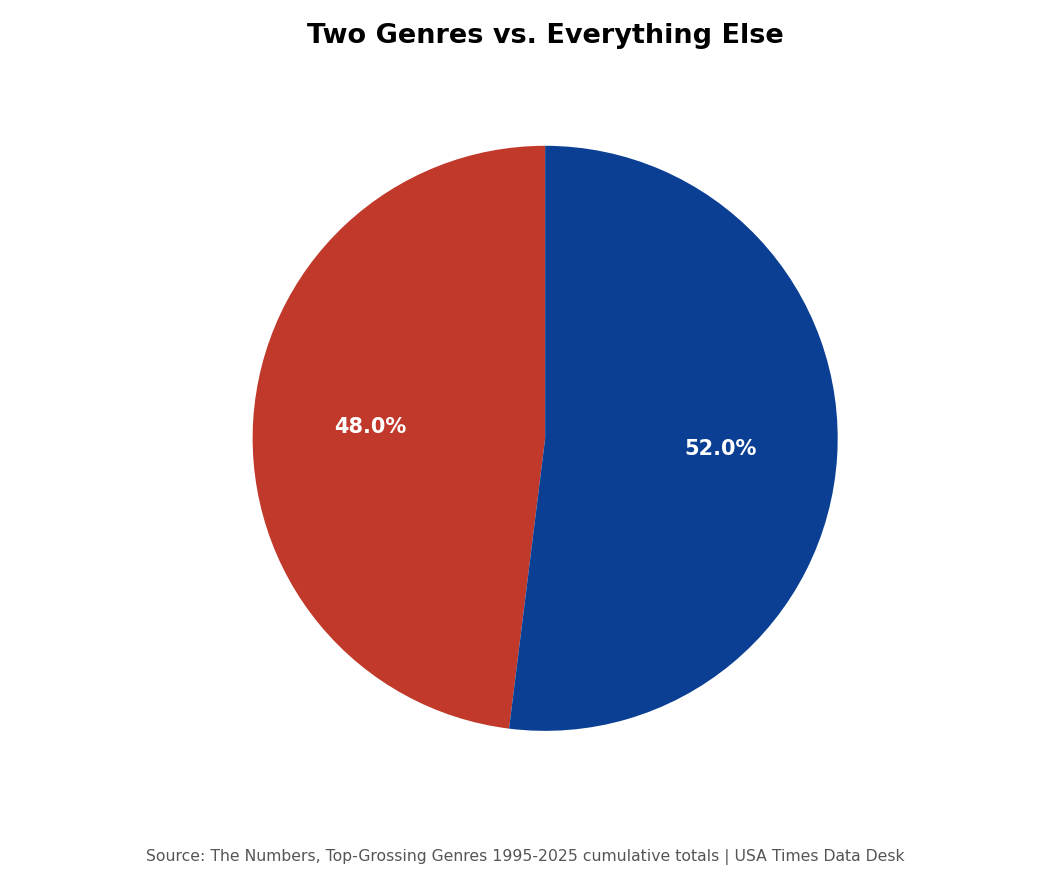
Grouping Adventure and Action together as “spectacle” genres — the kind of large-scale, effects-driven filmmaking built around theatrical spectacle rather than character-driven or dialogue-driven storytelling — makes the concentration even starker as a single visual: two genres out of the ten tracked in this dataset account for essentially half of all box office revenue generated since 1995, with the other eight genres splitting the remainder. That’s not a subtle tilt in audience preference; it’s close to an even split between “spectacle” and “everything else” at the level of total industry revenue.
Why this connects to the shrinking release calendar
This genre concentration doesn’t exist in isolation — it’s the genre-level expression of the same fewer-bigger-releases dynamic this series documents in its piece on wide-release counts. As studios have consolidated their release calendars around a smaller number of high-stakes tentpoles, and as those tentpoles have increasingly needed to justify enormous marketing and production budgets against a shrinking overall audience, Adventure and Action franchises — built on established intellectual property, global marketability, and a demonstrated track record of drawing the premium-format, event-oriented audience covered elsewhere in this series — have become the safer, more bankable bet relative to original dramas or character-driven comedies that carry more built-in box office uncertainty.
Where Drama and Comedy actually went
Drama’s 14.17% share and Comedy’s 14.09% share, while smaller than the spectacle genres’, still represent meaningful total dollar figures — roughly $37.9 billion and $37.7 billion respectively over the full thirty-year window — so it would be inaccurate to say these genres have disappeared from theatrical release entirely. What the data can’t directly show is where the genre’s center of gravity has shifted within that overall figure: industry reporting outside this dataset has repeatedly suggested that mid-budget dramas and comedies, the kind that used to fill a studio’s release calendar between tentpoles, have increasingly migrated to streaming platforms rather than theatrical release altogether — meaning some of what would have counted as theatrical Drama or Comedy revenue in 2005 may simply not exist as theatrical revenue at all today, having moved to a different distribution channel this box office dataset doesn’t track.
The genres that barely register
At the bottom of the genre breakdown, Musical (2.74%), Black Comedy (1.09%), and Documentary (0.90%) collectively account for less than 5% of all theatrical revenue over three decades — a reminder that theatrical distribution has always been genre-selective to some degree, not a new phenomenon created by the past twenty years of admissions decline. What has changed is the degree of concentration at the top: as the overall pool of moviegoers has shrunk (documented in this series’ piece on per-capita admissions), studios appear to have responded by doubling down further on the genres already proven to draw the largest, most reliable audiences, rather than diversifying the release slate to try to win back a broader range of moviegoers with a wider range of genre offerings.
A narrowing definition of “going to the movies”
Taken together with the rest of this series, the genre data suggests something beyond simple audience preference: a feedback loop in which a shrinking audience makes studios more risk-averse, risk-aversion pushes investment toward the genres and franchises with the most proven box office track record (disproportionately Adventure and Action), and the resulting release calendar increasingly signals to moviegoers that “going to the movies” means a spectacle-format tentpole rather than the fuller range of theatrical experiences — dramas, character comedies, smaller original stories — that used to define a trip to the theater alongside the blockbusters. Whether that’s a cause or a consequence of the broader admissions decline this series documents is difficult to establish definitively from box office data alone, but the two trends have clearly moved together over the same twenty-year window.
Horror’s outsized efficiency
One genre in this dataset defies the “bigger is safer” logic driving Adventure and Action’s dominance: Horror, at 6.17% of total revenue, has consistently punched above its weight relative to typical production budgets, which run dramatically lower than tentpole Adventure or Action films. A studio genre slate built around a handful of expensive spectacle films and a smaller number of comparatively inexpensive horror titles represents a genuinely different risk profile than either extreme alone — horror’s relatively modest but reliable revenue share suggests it has survived the broader concentration trend not by competing with Adventure and Action on scale, but by offering a structurally different, lower-risk financial proposition that remains attractive even in an industry increasingly focused on tentpole economics elsewhere in its release calendar.
What the genre data can’t tell us
The Numbers’ genre categorization system assigns each film a single primary genre, which necessarily flattens films that blend multiple genres — a superhero film with significant comedic elements, for instance, or an animated adventure with a strong original-screenplay dramatic core, gets counted under whichever single category the classification system considers primary. That’s a reasonable and consistent methodology for aggregate analysis, but it means the sharp-looking boundaries in this article’s charts are somewhat less rigid in practice than a simple bar chart suggests — some of what’s counted as “Adventure” or “Action” revenue may carry meaningful Comedy or Drama elements that don’t show up as a separate line in this data, a limitation worth naming rather than glossing over in an article that leans heavily on genre categorization to make its central argument.
What we did
Genre revenue-share figures (Adventure 25.26%, Action 22.77%, Drama 14.17%, Comedy 14.09%, Thriller/Suspense 7.39%, Horror 6.17%, Romantic Comedy 4.38%, Musical 2.74%, Black Comedy 1.09%, Documentary 0.90%) come from The Numbers’ Top-Grossing Genres 1995-2025 ranking (the-numbers.com). These are cumulative totals across the full thirty-year window, not a year-by-year time series — we did not have access to genre revenue share broken out by individual year, so this article describes overall positioning across the full period rather than tracking how genre concentration has changed year to year, which would be a natural and valuable follow-up if that data becomes available. The “Adventure + Action combined” framing and the resulting pie chart are our own grouping and calculation applied to The Numbers’ underlying category totals. The characterization of mid-budget dramas and comedies migrating toward streaming platforms reflects general, widely reported industry commentary rather than data we independently verified against streaming platform release figures, which were outside the scope of this analysis.
