Read in: English · Español · Русский · 中文 · Português
New York adds and sheds restaurants faster than almost any city on earth, and most of that turnover happens out of sight – a shuttered awning here, a fresh coat of paint there. But the city keeps a running record of one side of it. Every time a new food business prepares to open, the Health Department inspects it before it can get its permit; every time an operating restaurant is caught with conditions dangerous enough to warrant it, the same department orders it closed. We pulled twelve months of those records – September 2025 through September 2026 – and mapped where the openings clustered and where the closures fell.
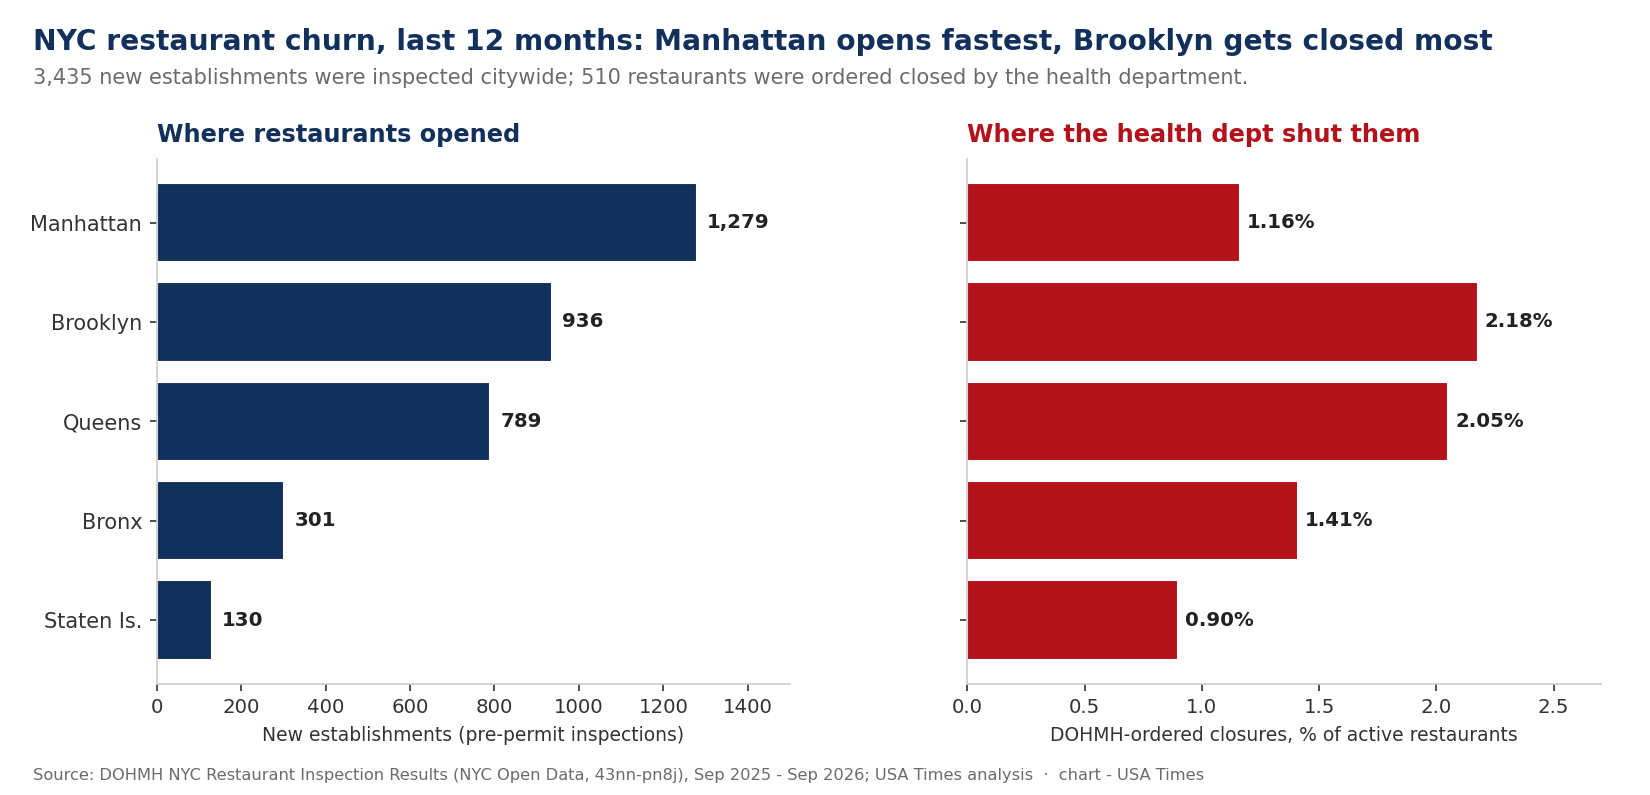
The short version: 3,435 new establishments went through their opening inspection citywide, and 510 restaurants were ordered closed by the Department of Health and Mental Hygiene (DOHMH). Manhattan opened the most in raw numbers. But measured against each borough’s existing base of restaurants, Brooklyn and Queens were the churniest – and their restaurants were about twice as likely as Manhattan’s to be shut by an inspector.
Batmandir · Founders A numbered seat at the table. S3 · The Founders Club — 161 seats per location. By invitation. Explore membership →What this data can and can’t tell you
A necessary caveat up front, because it shapes everything below. DOHMH’s inspection dataset is not a business registry. It reliably captures two moments in a restaurant’s life: the pre-permit inspection when it is getting ready to open, and any inspection where the department orders it closed for violations. It does not track the far more common way restaurants die – quietly not renewing a lease, going dark between inspection cycles. Closed businesses simply fall out of the active file. So we are careful with language here. “Openings” means new establishments entering the inspection system – a strong, direct signal of a restaurant getting ready to serve. “Closures” means health-department-ordered closures, which are a specific enforcement action for serious violations, not the count of businesses that went under. Both are real; neither is the whole picture.
Openings: Manhattan by volume, Flushing by intensity
Manhattan led with 1,279 new establishments, followed by Brooklyn (936), Queens (789), the Bronx (301) and Staten Island (130). That ranking mostly tracks the size of each borough’s restaurant base, and in fact the rate of new openings was strikingly uniform: everywhere in the city, new establishments equaled roughly 10 to 12 percent of the active restaurant count. New York is not opening restaurants faster in one borough than another so much as churning at a steady clip across all five.
Zoom to the ZIP-code level and the concentration sharpens. The single busiest area for new restaurants was 11354 – downtown Flushing, Queens – with 101 new establishments, edging out every Manhattan neighborhood. Behind it came a cluster of Manhattan’s densest dining ZIPs: Chelsea/NoMad (10001), the East Village and Union Square (10003), and the Lower East Side/Chinatown (10002). Williamsburg and Downtown Brooklyn tied at 67 apiece. The pattern is the one anyone who eats out already senses: the action is in Flushing’s food halls, the Manhattan core, and the north-Brooklyn corridor.
| ZIP / area | New establishments (12 mo.) |
|---|---|
| 11354 — Flushing, Queens | 101 |
| 10001 — Chelsea / NoMad, Manhattan | 95 |
| 10003 — East Village / Union Sq. | 94 |
| 10002 — Lower East Side / Chinatown | 79 |
| 11211 — Williamsburg, Brooklyn | 67 |
| 11201 — Downtown Brooklyn | 67 |
| 10036 — Times Sq. / Hell’s Kitchen | 65 |
| 10013 — Tribeca / SoHo / Chinatown | 64 |
By cuisine, “American” led new openings (380), but the more telling story is what came next: Chinese (342), coffee and tea shops (312), pizza (187), Latin American (146), Mexican (145) and Japanese (142). The café boom is real – coffee/tea was the third-largest opening category citywide – and Chinese restaurants opened at nearly the rate of the catch-all American category, powered heavily by Flushing and Sunset Park.
Closures: the enforcement map runs through the outer boroughs
Health-ordered closures tell a different geographic story. In absolute counts, Brooklyn (173 restaurants closed), Manhattan (145) and Queens (144) were close. But normalized against each borough’s restaurant base, the gap opens up. Brooklyn ordered closures on 2.18% of its active restaurants and Queens 2.05% – roughly double Manhattan’s 1.16% and Staten Island’s 0.90%. The Bronx sat in between at 1.41%.
The closure hot spots were, by ZIP: Jamaica, Queens (11432) and Sunset Park, Brooklyn (11220), tied at the top, followed by Tribeca/Chinatown (10013), Downtown Brooklyn (11201), Flatbush (11226), Flushing (11354), the Lower East Side (10002) and the Kissena Park stretch of Flushing (11355). These are, overwhelmingly, dense immigrant food corridors with older building stock and thin margins – exactly the places where a failed refrigeration unit or a pest problem is most likely to tip an inspection into a closure order. It is worth stating plainly what a DOHMH closure is and isn’t: most closed restaurants correct the problem and reopen, often within days. A closure order is a health intervention, not a death certificate.
The churn, in one sentence
Put the two halves together and New York’s restaurant metabolism comes into focus. For every restaurant the health department ordered closed last year, roughly seven new establishments went through their opening inspection. The openings pile up in Flushing, the Manhattan core and north Brooklyn; the enforcement closures land hardest, proportionally, on the outer-borough immigrant corridors that are also doing much of the opening. It is the same neighborhoods, in other words, generating both ends of the cycle – which is what a healthy, brutally competitive restaurant city looks like from the inspector’s clipboard.
This is the ground-level counterpart to the citywide trends we track elsewhere: the fall in rat complaints below pre-pandemic levels, the markups delivery apps add on top of these same menus, and the congestion-pricing shifts reshaping who reaches these blocks and how.
Closed, then reopened: what a DOHMH shutdown really is
It bears repeating, because the word “closed” carries so much weight: a DOHMH closure order is usually the start of a short story, not the end of one. The department reopens establishments once the hazard – a pest infestation, a broken refrigerator, no hot water – is corrected, and the inspection record is full of “Establishment re-opened by DOHMH” entries that follow closures within days or weeks. Only a minority of health closures lead to a restaurant staying dark for good. So the 510 closures we counted are best read as a map of where serious health hazards were found and forced offline, not a body count of restaurants that died. The distinction matters most in exactly the outer-borough corridors where closures cluster, because it separates “these neighborhoods have failing restaurants” from the truer “these neighborhoods have hard-pressed restaurants that got caught and, mostly, fixed the problem.”
The cuisines opening fastest
The menu of new New York is worth dwelling on. Behind the catch-all “American” category (380 new establishments), the fastest-opening cuisines were Chinese (342), coffee and tea shops (312), pizza (187), Latin American (146), Mexican (145) and Japanese (142). Two trends stand out. First, the café: coffee-and-tea was the third-largest opening category in the entire city, a direct read on how much of new food retail is now built around a counter, a espresso machine and a laptop crowd rather than a dining room. Second, the enduring strength of Chinese openings – nearly matching the generic “American” bucket – powered overwhelmingly by Flushing and Sunset Park, the two neighborhoods that also lead the borough-level opening counts. The cuisines that are opening fastest are, to a striking degree, the cuisines of the specific immigrant neighborhoods doing the opening.
One caveat on timing. The opening signal is spread across the year, but the raw dates carry a cluster in December that looks more like a data-loading artifact – a batch of records stamped at once – than a real winter opening rush. We rely on the twelve-month totals and their geographic and cuisine breakdowns, which are robust, rather than reading too much into any single month’s spike. The shape of the year is churn at a steady clip; the location and character of that churn is the story.
What we did
We queried the DOHMH New York City Restaurant Inspection Results dataset (NYC Open Data identifier 43nn-pn8j) via the Socrata API for the twelve months from September 13, 2025 to September 13, 2026. We counted “openings” as the number of distinct establishments (unique CAMIS ids) with a “Pre-permit (Operational) / Initial Inspection” in the window – the inspection a new food business undergoes before it can be permitted to open – grouped by borough, ZIP code and cuisine. We counted “closures” as distinct establishments with an action beginning “Establishment Closed by DOHMH” in the window; because that action text repeats across the multiple violation rows of a single closure inspection, we deduplicated to unique establishments. Closure rates use each borough’s count of distinct active establishments in the file as the denominator. The dataset lists only active establishments and does not record ordinary business closures (non-renewals), so these figures describe new-establishment activity and health-enforcement closures, not net business openings and failures.
Sources
- DOHMH New York City Restaurant Inspection Results (NYC Open Data, 43nn-pn8j)
- NYC Health: Restaurant Grading and Inspections
- USA Times: NYC Rat Complaints Fell Below Pre-Pandemic Levels
- USA Times: We Audited 30 NYC Restaurants’ Delivery Prices