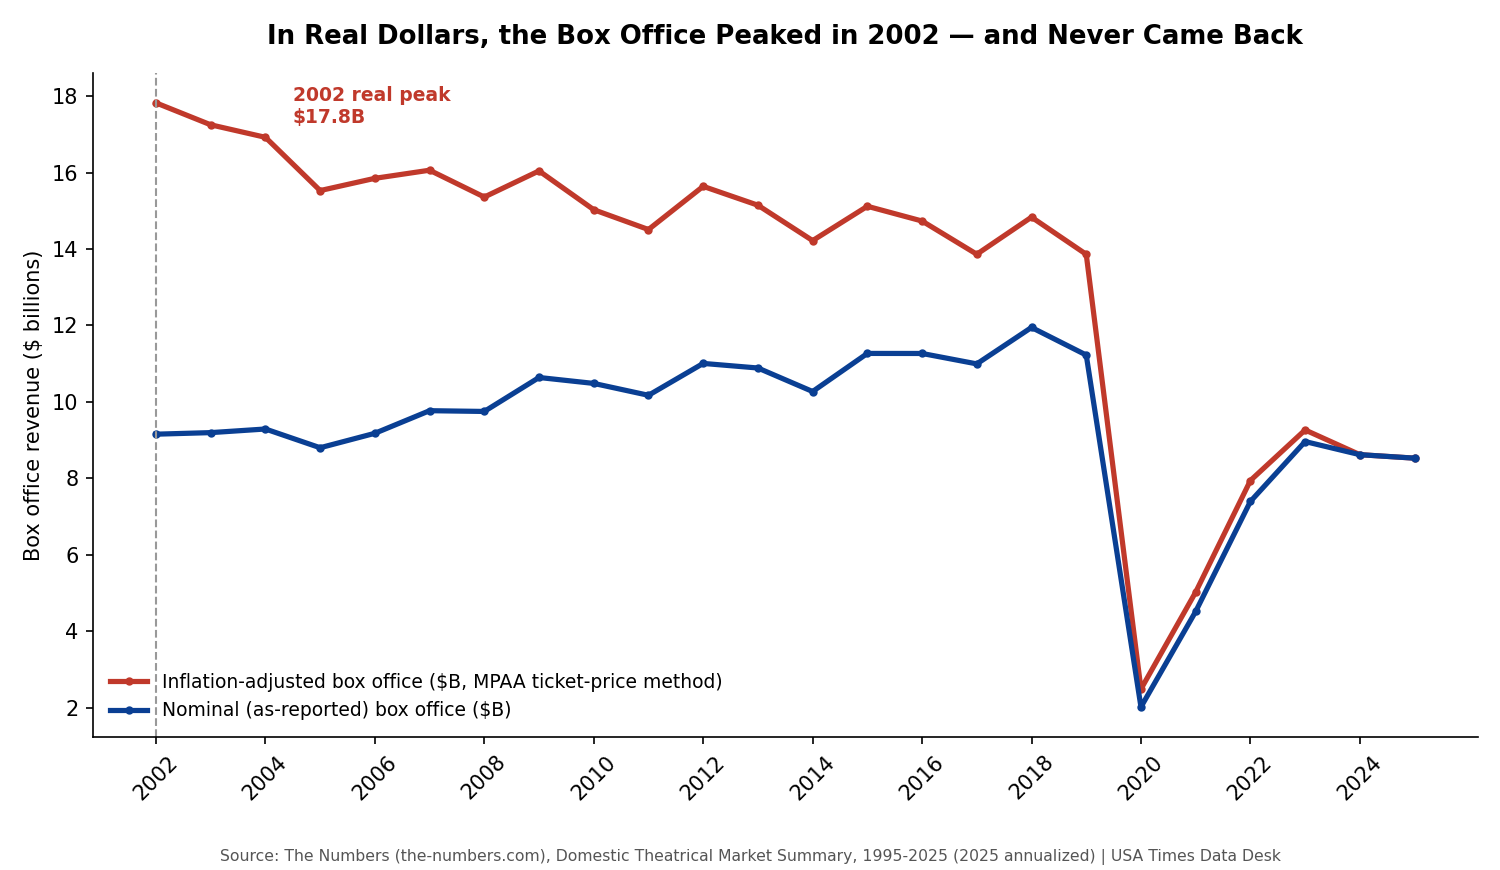
Every year, trade headlines tally the domestic box office and compare it to the year before, sometimes celebrating a “recovery” when the number ticks up. Almost none of those comparisons adjust for inflation. When you do — converting every year’s box office into constant, ticket-price-adjusted dollars using the same methodology the Motion Picture Association uses in its own annual reports — a very different picture appears: the U.S. box office, in real terms, peaked in 2002 at $17.8 billion and has never come close to that level again, including in the most celebrated “recovery” years since.
Why “record year” headlines are often nominal, not real
The distinction matters because nominal dollars and real (inflation-adjusted) dollars tell almost opposite stories about the same industry. In nominal terms, the U.S. box office grew from about $8.8 billion in 2005 to a pre-pandemic high of nearly $11.95 billion in 2018 — a headline-friendly, seemingly healthy trajectory. But $11.95 billion in 2018 dollars doesn’t buy what $8.8 billion bought in 2005; general prices rose in between. Once you strip that out, 2018’s real box office — about $14.8 billion in ticket-price-adjusted terms — was still well below the $17.8 billion real peak set in 2002. The industry has spent more than two decades not recovering to a level it already hit once, even in its best conventional years.
How far below the peak every year has actually been
Charting each year’s real box office as a percentage above or below the 2002 peak turns this into a single, stark visual: every year since 2002 sits in negative territory, and the gap only widens after 2017. By 2024, the real box office sat more than 50% below the 2002 peak. Even setting aside the pandemic years entirely — which obviously distort any year-over-year comparison — the pre-pandemic 2017-2019 stretch, often described in trade coverage as a stable, mature period for the industry, was already running 20-25% below the real 2002 high. The “stability” of those years was stability at a permanently lower real level, not a plateau near the top.
Batmandir · Founders A numbered seat at the table. S3 · The Founders Club — 161 seats per location. By invitation. Explore membership →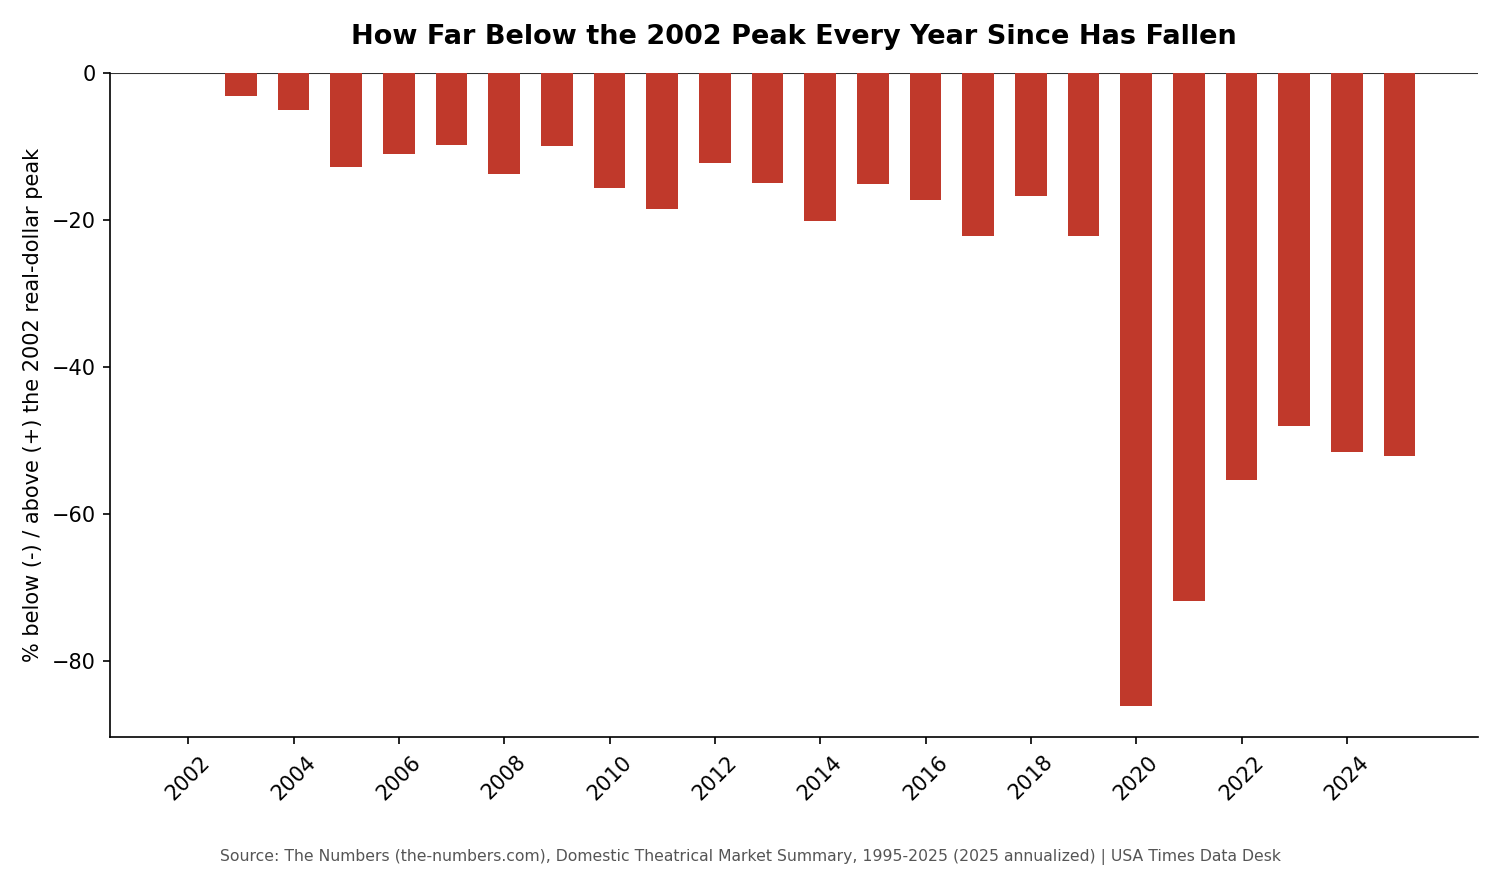
What made 2002 the peak in the first place
2002 wasn’t an outlier driven by one blockbuster; it was near the tail end of a run of historically strong admissions years. U.S. and Canadian admissions in 2002 hit nearly 1.58 billion tickets — the highest single-year total in the entire 1995-2025 dataset examined for this series, and a level the industry has not approached since, even before accounting for population growth that would make matching that raw ticket count even harder today. High admissions at a relatively low, pre-premium-format average ticket price ($5.81 that year) combined to produce a real-dollar peak that subsequent years, with their higher prices but sharply lower attendance, simply haven’t been able to replicate.
The pandemic didn’t cause this — it deepened an existing hole
It would be easy to attribute the entire real-dollar decline to COVID-19, but the data doesn’t support that as a complete explanation. The real box office was already down roughly 22% from its 2002 peak by 2019 — a full year before the pandemic touched theaters at all. What the pandemic did was take an industry already two decades into a slow real-dollar erosion and knock it down further and faster than the underlying trend would have on its own; 2020’s real box office of about $2.5 billion represented roughly an 86% collapse from the 2002 peak in a single year. The subsequent years have been a genuine recovery from that pandemic floor — 2023’s real box office of roughly $9.3 billion is meaningfully better than 2021’s $5.0 billion — but that recovery has been a climb back toward the pre-pandemic (already-diminished) trend line, not toward the 2002 high-water mark.
Why the nominal number persists in coverage anyway
Inflation adjustment is more work, requires picking a methodology (this series uses the MPA/The Numbers approach, which adjusts using historical average ticket prices rather than the broader CPI, arguably the more relevant deflator for a ticket-denominated business), and produces headlines that are structurally less flattering to an industry that studios, exhibitors, and trade press all have some interest in describing optimistically. None of that makes the nominal figure wrong, exactly — it’s an accurate count of dollars that changed hands in a given year. But treating a flat or modestly rising nominal number as evidence of industry health, without acknowledging that the same dollars buy meaningfully less than they used to, understates just how much smaller the real theatrical business has become relative to its own recent history.
Choosing a deflator changes the story, but not the direction
It’s worth being explicit that “inflation-adjusted” isn’t a single, universally agreed-upon calculation — different deflators produce different real-dollar figures, even applied to the same nominal data. This series uses the ticket-price-based adjustment The Numbers publishes (following the Motion Picture Association’s own methodology), which adjusts based on how much movie tickets themselves have cost over time rather than the broader Consumer Price Index. A CPI-based adjustment, using the roughly 65% cumulative general inflation figure discussed elsewhere in this series, would produce a somewhat different real-dollar trend line — likely showing a less extreme decline from the 2002 peak, since general inflation ran meaningfully below movie-ticket-specific inflation over the same period. Both approaches, however, point in the same direction: nominal box office growth substantially overstates the industry’s real growth, regardless of which reasonable inflation measure you apply to correct for it.
What a “real recovery” to 2002 would actually require
Putting a number on the gap makes it more concrete: matching 2002’s real box office of $17.8 billion at 2025’s average ticket price of $11.31 would require selling roughly 1.58 billion tickets in a single year — more than double 2025’s actual annualized total of 754 million, and modestly higher than any single year’s admissions total anywhere in this three-decade dataset, including 2002 itself. Alternatively, holding admissions at 2025’s actual level while trying to reach the same real revenue figure would require an average ticket price north of $23 — more than double today’s actual average. Neither path looks remotely plausible based on any trend currently visible in the data, which is precisely why this article frames the 2002 real peak as a historical marker the industry has structurally moved away from, not a target realistically within reach through any combination of the levers currently being pulled.
What we did
All nominal and inflation-adjusted box office figures in this article come from The Numbers’ Domestic Theatrical Market Summary (the-numbers.com), which publishes both series back to 1995. The inflation adjustment used in that dataset — and reproduced in our charts — is based on average ticket price movement over time (the same underlying methodology the Motion Picture Association uses in its annual State of the Industry reporting), not the broader Consumer Price Index; we chose to use this ticket-price-based adjustment because it is the standard the industry itself reports against, though a CPI-based adjustment would produce a somewhat different, though directionally similar, real-dollar trend. The 2025 figures are labeled by The Numbers as an annualized run-rate rather than a final closed-year total. The characterization of trade-press coverage tendencies (favoring nominal, “record year” framing) reflects our own general observation of how box office figures are commonly reported, not a systematic content analysis of specific outlets’ coverage.