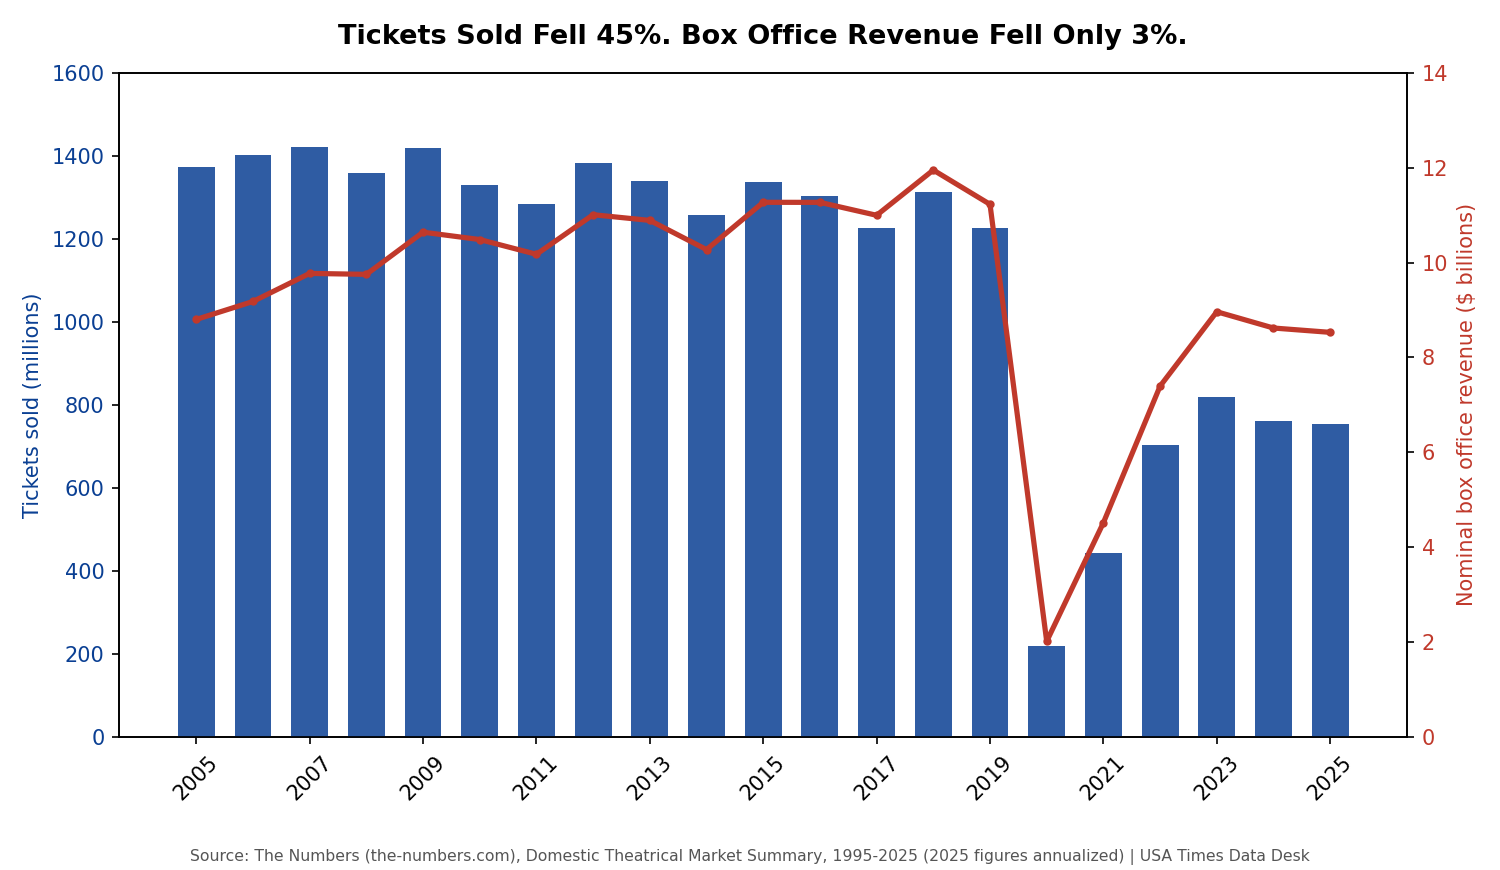
In 2005, American and Canadian moviegoers bought 1.37 billion tickets and handed theaters $8.8 billion. Twenty years later, in 2025, they bought 754 million tickets — 45% fewer — and handed theaters $8.5 billion, a decline of barely 3%. Two numbers that used to move together, almost in lockstep, have quietly come apart. This is the story of that split, and what it says about what a “movie ticket” has actually become.
The math that makes the divergence possible
Box office revenue is simple arithmetic: tickets sold multiplied by average ticket price. When admissions fall but revenue barely moves, only one thing can be doing the offsetting work — price. And the price has moved a lot. The average U.S. movie ticket cost $6.41 in 2005. By 2025 it was $11.31, an increase of 76%. That’s not a coincidence sitting next to a 45% drop in attendance; it’s the mechanism. Multiply 1.37 billion tickets by $6.41 and you get $8.8 billion. Multiply 754 million tickets by $11.31 and you get $8.5 billion. The revenue line barely budged because the price line did almost all of the work that the attendance line used to do.
When the two lines actually split
Indexing both series to 2005 (setting that year to 100) makes the divergence visually obvious. Tickets and nominal revenue tracked each other reasonably closely through the mid-2000s and into the early 2010s — both drifted, both dipped in recession years, both recovered. The real break comes after 2018-2019: admissions begin a steady decline even before the pandemic, then the 2020 shutdown collapses attendance by 82% in a single year. Revenue collapses too, but by a smaller relative amount in the years that follow, because ticket prices kept climbing right through the disruption — from $9.16 in 2019 to $11.31 by 2024-2025, even as the industry was still trying to coax people back into seats.
Batmandir · Guest Passes Step inside for a day. Guest passes from $161/day — brought in by a member. See guest passes →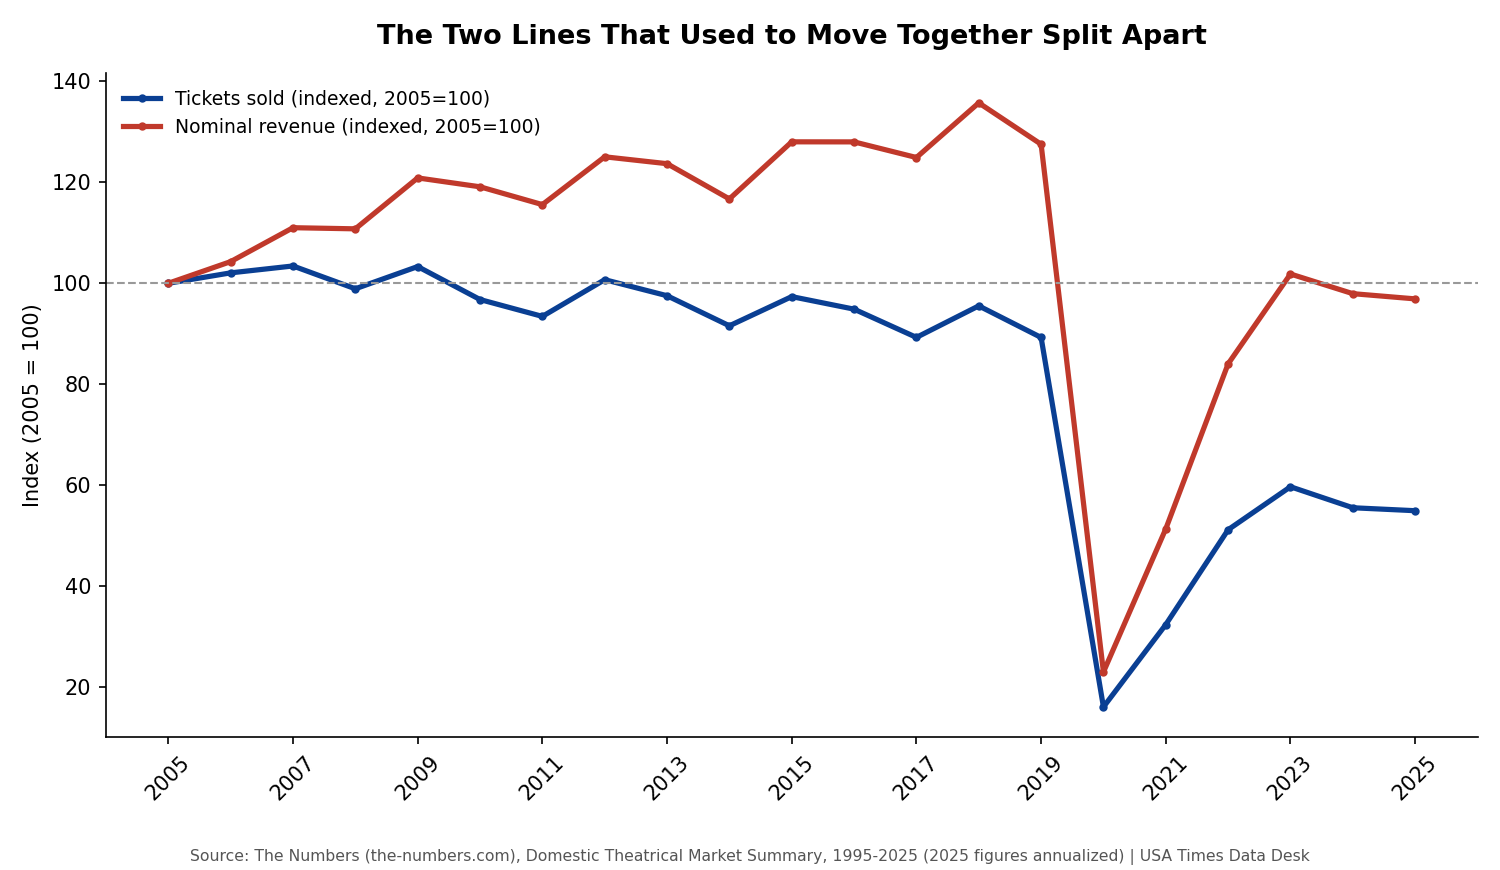
This isn’t just inflation
It’s tempting to wave this off as ordinary inflation — everything costs more than it did in 2005, so why not movie tickets? But general consumer prices rose about 65% cumulatively over that same 20-year span, while the average movie ticket rose 76%. Movie tickets got more expensive faster than the average basket of goods and services in the economy did. That gap — and what’s driving it — is its own story, one this series covers in detail separately (average ticket price versus general inflation). What matters here is that pricing power, not renewed enthusiasm for moviegoing, is what has kept the top-line revenue number from telling the more dramatic story sitting underneath it.
Why the headline number hides the real trend
Every January, industry trade coverage reports the year’s domestic box office gross, and — outside of the pandemic years — it tends to land somewhere in a familiar multi-billion-dollar range that doesn’t sound especially alarming. That framing is technically accurate and substantively misleading. A theatrical industry that needs to charge each remaining customer 76% more just to keep the top line roughly flat is not a stable business; it’s a business substituting price for volume, which works until it doesn’t. Every additional price increase further narrows the population willing or able to treat moviegoing as a routine habit rather than an occasional event, and the data on per-capita admissions (covered elsewhere in this series) shows that narrowing already well underway.
What’s driving the price side
Several forces plausibly combine here. Premium formats — IMAX, Dolby Cinema, other premium-large-format (PLF) screens — carry meaningfully higher ticket prices and have grown their share of total screens and revenue over the past decade, pulling the overall average up even without every ticket getting more expensive individually. Reserved-seating and dynamic pricing, now standard at most major chains, allow theaters to charge more for popular showtimes rather than a single flat price. And simple inflation in real estate, labor, and film-rental terms pushes the baseline ticket price upward regardless of format. Untangling exactly how much of the 76% price increase comes from each of these forces would require chain-level pricing data this analysis didn’t have access to — a limitation worth stating plainly rather than guessing past.
A closer look at the years the two lines held together
It’s worth dwelling on the stretch where the divergence hadn’t happened yet, because it clarifies what “normal” used to look like. Between 2005 and 2012, tickets sold and nominal revenue moved in a recognizably similar band: admissions bounced between roughly 1.28 billion and 1.42 billion a year, while revenue climbed steadily from $8.8 billion to $11 billion — a gain largely explained by a ticket price rising from $6.41 to $7.96, a pace not wildly out of step with general inflation over the same seven years. Neither line was flat, but neither was doing dramatically more work than the other. That’s the baseline the more recent divergence should be measured against: not a hypothetical ideal, but the industry’s own recent past, within living memory of anyone who was regularly going to the movies in the early 2010s.
The middle years already showed the crack forming
Look closely at 2013 through 2017 and the crack that would later become a chasm is already visible, just smaller. Admissions fell from 1.34 billion in 2013 to 1.23 billion in 2017 — a real decline of about 8% in four years, well before any pandemic. Revenue over the same span went essentially nowhere in a straight line, dipping and recovering, ending 2017 at $10.99 billion versus $10.89 billion in 2013 — flat, propped up by average ticket price climbing from $8.13 to $8.97. In other words: the mechanism this article describes as splitting the two lines apart after 2018 was already operating, quietly, for most of the preceding decade. 2018-2019 and the pandemic didn’t invent the divergence; they made it impossible to ignore.
What we did
All admissions, nominal box office, and average ticket price figures in this article come from The Numbers (the-numbers.com), an industry data provider whose Domestic Theatrical Market Summary tracks the U.S. and Canadian (“domestic”) theatrical market back to 1995; average ticket prices in that dataset are calculated using figures the Motion Picture Association (MPA) publishes in its annual State of the Industry report. The 2025 figures are explicitly labeled by The Numbers as annualized (a partial-year run rate), not a final closed-year total, and should be read with that caveat. The cumulative general-inflation comparison (65% over 2005-2025) comes from U.S. Bureau of Labor Statistics Consumer Price Index data as aggregated by a third-party inflation calculator; we did not independently pull the raw BLS series. The explanation of premium-format and dynamic-pricing effects on average ticket price reflects general, widely reported industry dynamics rather than a chain-by-chain pricing analysis, which was outside the scope of what we had access to for this piece.