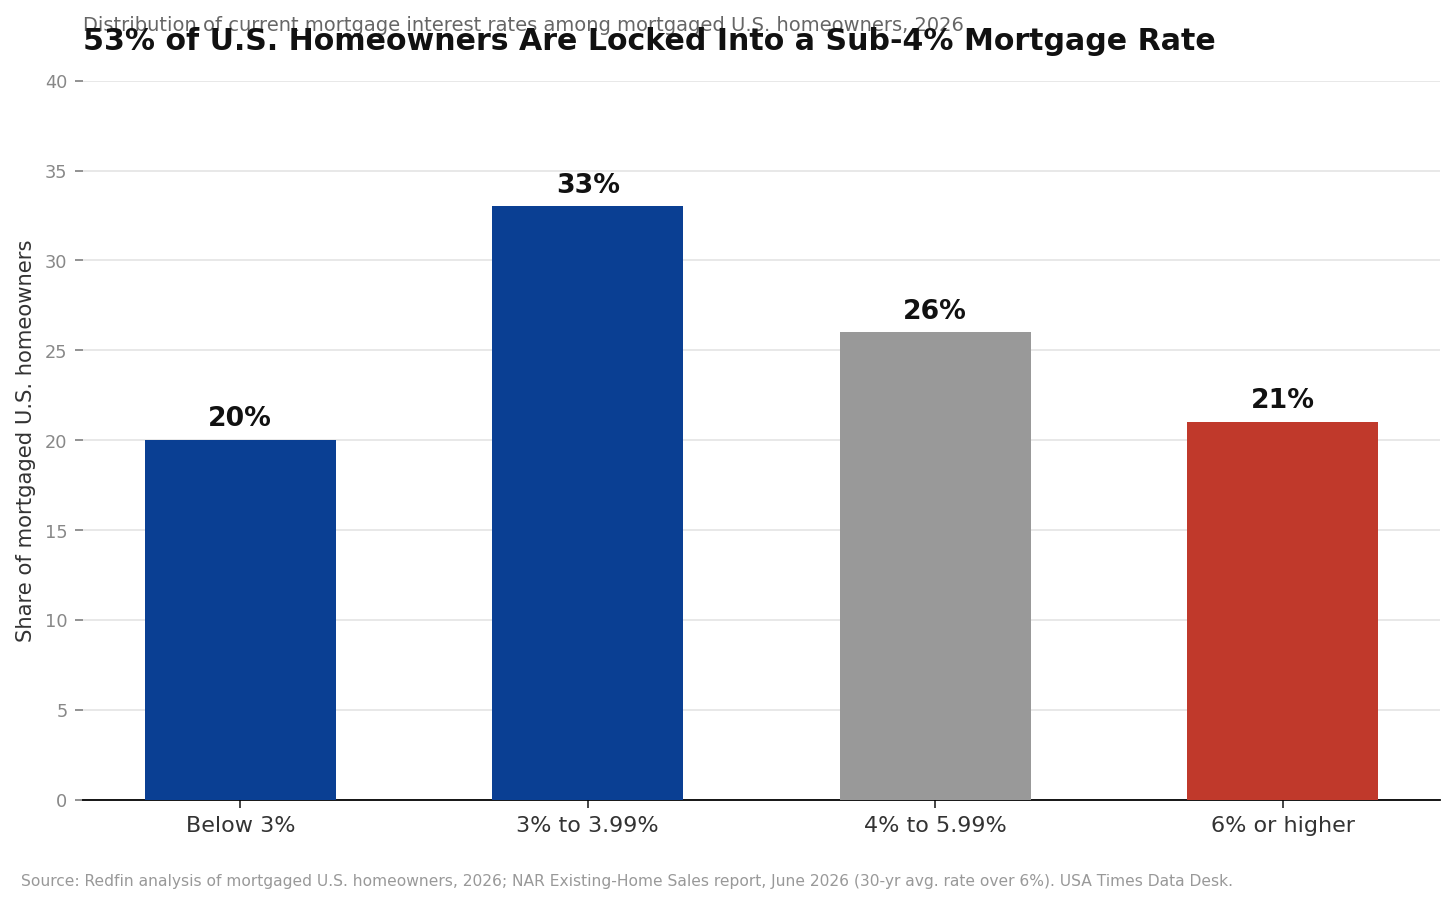
The median existing-home price in the United States reached an all-time high in June 2026, according to the National Association of Realtors — even as the number of homes actually sold that month fell 2.4% from May, to a seasonally adjusted annual rate of 4.09 million units. That combination, prices climbing while sales volume shrinks, isn’t the contradiction it looks like on the surface. NAR Chief Economist Lawrence Yun pointed to the actual mechanism directly: “progress on long-term housing affordability could be hampered if inventory growth continues to stall. Without consistent gains in inventory, home prices can accelerate.” And the reason inventory keeps stalling has a specific, quantifiable cause: according to Redfin’s analysis of current mortgage rates, 53% of mortgaged U.S. homeowners are sitting on a rate below 4% — a rate they’d lose the moment they sold and bought again at today’s market rate, which averaged above 6% for a 30-year fixed loan as of May 2026.
Where 100% of Mortgaged Homeowners Fall
Hover each segment of the bar.
Batmandir · The Circle Full access to theatres, museums & exhibitions. S2 · ongoing membership, without a Founder’s seat. Explore membership →How the “lock-in effect” actually works
The mechanism is straightforward once you isolate it: a homeowner who refinanced or bought during the historically low-rate years of 2020-2021 may be paying 3% or less on their existing mortgage. Selling that home and buying a new one at today’s rates — even a comparably priced one — could mean doubling their monthly interest cost on the same loan balance. Redfin’s survey-based research found that 16% of homeowners are staying in their current home specifically because they don’t want to give up their low rate, rather than because they don’t want to move. That’s a purely financial disincentive layered on top of whatever housing needs a family might actually have — more space, a job relocation, downsizing after kids move out — meaning a meaningful share of the country’s existing housing stock isn’t reaching the market not because it isn’t needed elsewhere, but because moving comes with a specific, calculable interest-rate penalty.
The rate distribution behind the number
Redfin’s breakdown shows the lock-in effect is concentrated but not universal. Roughly 20% of mortgaged homeowners have a rate below 3% — the lowest share in five years, meaning even that ultra-locked-in group has been gradually shrinking as some sell anyway or pay off their loans. Add the next band, 3% to just under 4%, and the below-4% total reaches 53%, down from 65% in 2022 at the effect’s peak. At the other end, 21% of mortgaged homeowners now carry a rate of 6% or higher — the highest share in nearly a decade — representing homeowners who bought or refinanced recently enough to face today’s market rates directly, with nothing to lose by moving again rate-wise. That 21% is notable because Redfin’s own reporting flagged it as a milestone: for the first time in five years, more homeowners now carry a rate above 6% than carry one below 3%, a crossover that reflects both new buyers entering at high rates and the slow erosion of the ultra-low-rate cohort through time and turnover.
What this means for the inventory numbers
NAR’s June 2026 data shows the practical result: 4.6 months of supply nationally — up from tighter levels in prior years, but still below the roughly six months that’s traditionally considered a balanced market favoring neither buyers nor sellers. Total existing-home inventory did rise in the report, and Yun’s commentary noted that job growth (more than half a million jobs added since the start of 2026) is providing some underlying support for the market. But the core tension Yun described is unresolved: home-price growth is currently outpacing wage growth by enough that affordability has technically improved year-over-year, even as the median price sets a new record, because incomes are rising faster than prices are — a distinction that matters statistically but may not feel meaningful to a buyer facing a $440,600 median price with a mortgage rate more than double what a seller locked in years ago.
Why the lock-in effect is slowly easing anyway
Several outlets covering Redfin’s data describe the lock-in effect as “easing” rather than intensifying, and the math supports that framing even though the effect remains historically large. The below-4% share has fallen from 65% to 53% over roughly four years — meaning more than a tenth of the country’s mortgaged homeowners have moved out of that locked-in category since the peak, through some combination of selling anyway, paying off loans, or simply the passage of time as older loans season and new buyers enter at higher rates. Industry commentary tracked in trade coverage attributes part of this to buyers and sellers gradually “adapting to a new normal” of rates that, while elevated compared with the pandemic-era lows, remain below the roughly 7% peak the market saw in 2023 — meaning some of the psychological resistance to moving may be softening even without rates themselves falling further.
Who benefits and who’s squeezed out
The lock-in effect doesn’t distribute its costs evenly. Existing homeowners with sub-4% rates are, in effect, sitting on a form of housing wealth that’s invisible in home-price statistics but very real in monthly cash flow — staying put costs them nothing extra, while moving would mean giving up a below-market rate permanently. First-time buyers and renters face the other side of that same equation: they’re competing for a smaller pool of available listings, precisely because rate-locked owners are withholding supply, in a market where the median price just set a record. That dynamic helps explain why housing affordability debates in 2026 increasingly center on inventory and construction policy rather than mortgage rates alone — even if the Federal Reserve were to cut rates further, a large share of existing homeowners would still be comparing any new rate against their own sub-4% baseline rather than against the market rate a first-time buyer has no choice but to accept.
What we did
The existing-home sales figures, median price, months-of-supply figure, and both Lawrence Yun quotes come directly from the National Association of Realtors’ own “Existing-Home Sales” data page and its linked June 2026 news release, which we read in full. The mortgage-rate distribution figures (the 20% below-3%, 53% below-4%, and 21% at-6%-or-higher figures, and the 65%-in-2022 comparison) come from Redfin’s published analyses of mortgaged U.S. homeowners, cited across several of Redfin’s own news releases on the topic through 2025 and 2026. The 16% figure on homeowners specifically staying put to protect their rate comes from a Redfin homeowner survey, which is separate from Redfin’s mortgage-rate-distribution analysis (one measures actual loan terms in aggregate; the other measures self-reported reasons for not moving) — we’ve kept those two data sources distinct in how we’ve presented them rather than treating them as the same measurement. We did not independently verify Redfin’s underlying loan-level data, which Redfin describes as drawn from a large sample of mortgaged homeowners; we’re presenting it as Redfin’s own published analysis rather than an independently-replicated figure.