New York City developers filed permits for 28,773 residential and hotel units in the first quarter of 2026 — double the 14,338-unit quarterly average recorded throughout 2025, according to New York YIMBY’s Q1 2026 construction report, built from NYC Department of Buildings permit-filing data. Total filed square footage more than doubled too, from a 16.9-million-square-foot quarterly average in 2025 to 34.6 million square feet in the first three months of 2026. The surge wasn’t gradual: January filings were up 71% year-over-year, February 49%, and March very nearly doubled the prior year’s total, up 99%.
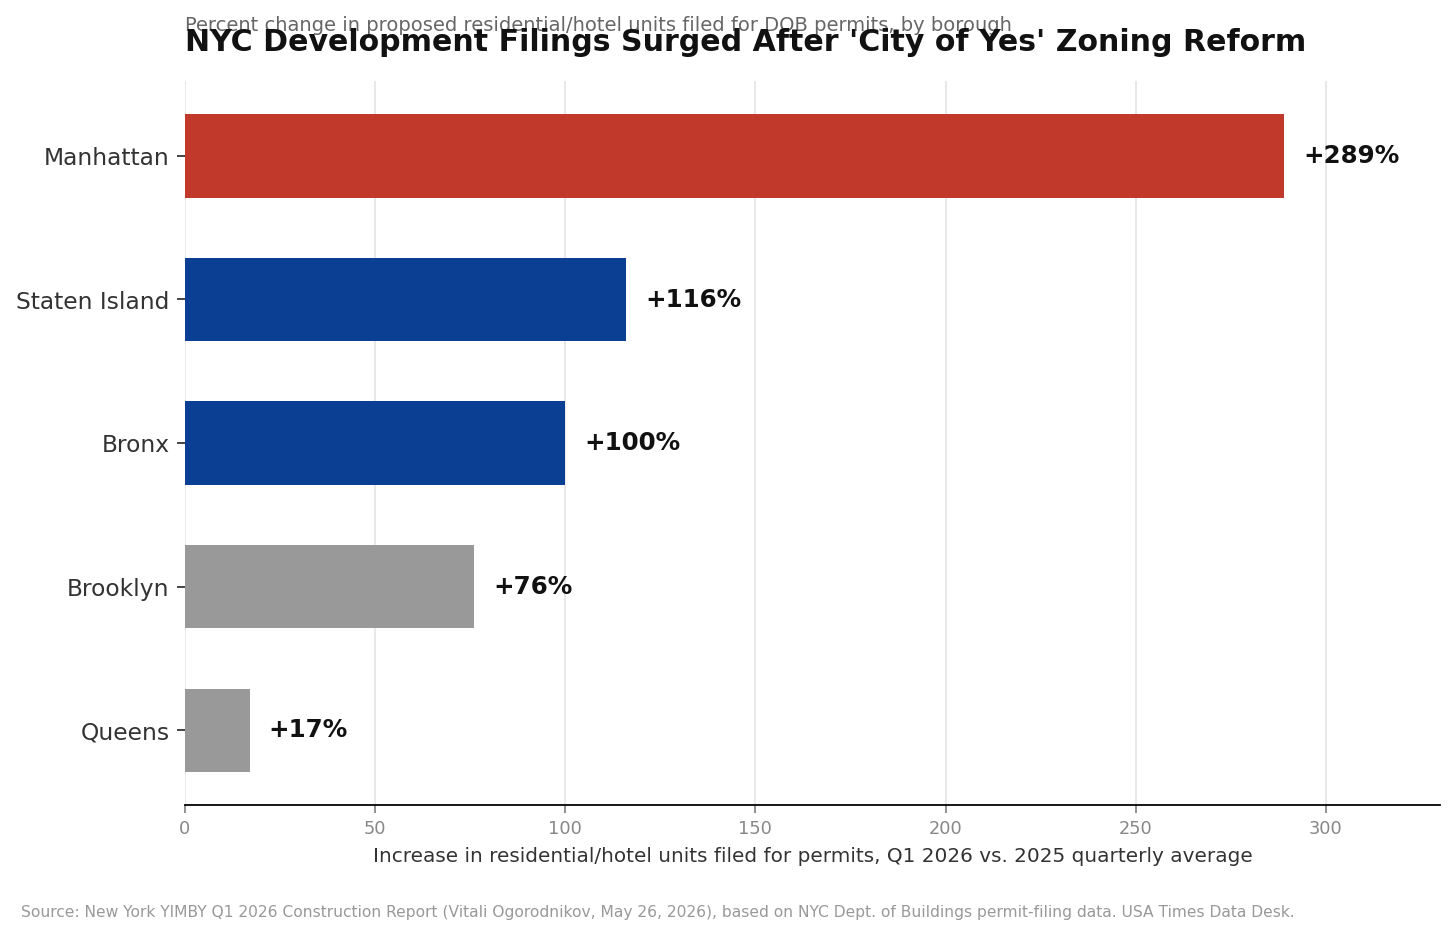
Q1 2026 vs. 2025 Quarterly Average, by Borough
Click or hover each card for the full breakdown.
Batmandir · Founders A numbered seat at the table. S3 · The Founders Club — 161 seats per location. By invitation. Explore membership →The zoning change behind the numbers
New York YIMBY attributes the jump specifically to “City of Yes for Housing Opportunity,” the citywide zoning amendment the City Council passed in December 2024 to loosen restrictions on residential construction across all five boroughs. As the report puts it: “A year later, the legislative measure already appears to yield much-welcome positive results.” The timing lines up: a zoning reform passed in December 2024 wouldn’t be expected to show up in permit-filing data immediately, since architects and developers need time to redesign projects around new, looser rules before filing — meaning early 2026, roughly 13 months after passage, is close to the earliest point the reform’s effects could plausibly appear in filing volume at this scale.
Manhattan is the standout, Queens the laggard
The borough-level data shows City of Yes isn’t affecting the city evenly. Manhattan’s filed units rose 289% versus its 2025 quarterly average — from 2,131 units to 8,285 — the largest percentage increase of any borough by a wide margin, and Manhattan’s filed floor area rose 232%, also the largest. Staten Island (+116% in units) and the Bronx (+100%) posted the next-largest jumps. Brooklyn rose a still-substantial 76%. Queens, by contrast, posted the smallest increase across nearly every metric YIMBY tracked: units up just 17%, permit count up 20%, and it was the only borough where the average size of filed buildings didn’t meaningfully grow. New York YIMBY’s own framing suggests the pattern may still be evening out over time, describing “the construction boom” as “beginning to spread more evenly throughout each borough, as intended in part by the City of Yes initiative” — implying Q1 2026’s borough imbalance could narrow in subsequent quarters as the reform’s effects continue to unfold.
What’s actually being proposed
The single largest project filed in the quarter was 548 West 36th Street in Hudson Yards, Manhattan, proposing 1,458 units — followed by 495 Eleventh Avenue, also in Hudson Yards, at 1,023 units. The largest filing by floor area was 175 Park Avenue in Midtown Manhattan, at just over 3 million square feet across 95 floors, which YIMBY describes as “skyline-altering” and among the city’s newest supertall proposals. Not every large filing is private housing: the report also flags 80-45 126th Street in Kew Gardens, Queens — more than 1.1 million square feet for what YIMBY calls “the Queens Facility,” one of the five borough jails planned to replace the Rikers Island complex, a reminder that DOB permit-filing totals capture civic and institutional construction alongside private residential development.
A filing is not a finished building
None of these figures represent completed construction, or even guaranteed construction. A DOB permit filing is an early-stage regulatory step — it means a project has been formally proposed and submitted for city review, not that it has broken ground, secured full financing, or will necessarily be built as filed. Filed unit counts, floor areas, and project designs can all still change during DOB’s review process, and a meaningful share of filed projects historically never reach completion in the form (or on the timeline) originally proposed. The Q1 2026 numbers are best read as a leading indicator of developer intent and confidence under the new zoning rules, not as a count of new housing units that are guaranteed to open.
How big a shift this really is
One comparison in the report puts the scale of the shift in sharp relief: Q1 2026 alone saw permit filings for 1,672 new residential and hotel buildings — a figure that “nearly matches last year’s combined 12-month total of 1,972.” In other words, three months of filings under the new zoning regime came close to matching an entire prior year’s worth of filings under the old rules. If that pace continues even roughly for the rest of 2026, the city would be on track for a filing volume dramatically above anything recorded in 2025, though YIMBY’s report itself only compares Q1 2026 against 2025 quarterly averages rather than providing multi-year historical context further back, which limits how confidently this can be framed as an all-time or multi-decade record rather than simply a sharp one-year change.
Building size is shifting too, not just volume
The surge isn’t purely about more projects — it’s also about bigger ones. Manhattan’s average filed building grew substantially in both floor area and floor count compared with the 2025 baseline, consistent with City of Yes provisions that specifically eased height and density limits in areas previously zoned only for shorter buildings. Queens moved in the opposite direction on one specific metric: it was the only borough where the average size of a filed project didn’t meaningfully grow alongside the increase in filing count, meaning Queens saw more projects but not proportionally bigger ones — a pattern that could reflect different zoning conditions borough-to-borough, different land availability, or simply a lag in how quickly developers in each borough have reoriented projects around the new rules.
What we did
All figures in this article come from New York YIMBY’s “2026 First-Quarter Construction Report,” written by Vitali Ogorodnikov and published May 26, 2026, which itself is built from NYC Department of Buildings permit-filing data. We read the report in full, including its borough-by-borough tables. We’re flagging three specific limitations directly: first, the report does not distinguish between filed permits that later get approved, modified, withdrawn, or built as proposed — it measures filings, not outcomes, and we’ve noted that distinction explicitly rather than implying these are confirmed new housing units. Second, the report does not break down unit filings by affordability (market-rate versus income-restricted) or tenure (rental versus condo), so we have not made any claims about what portion of these units will be affordable housing. Third, the report’s historical comparison is limited to 2025 quarterly averages; it does not provide a multi-year (2020-2024) baseline, so our framing of this as a “surge” is relative to the prior year only, not to a longer historical record we could independently verify.