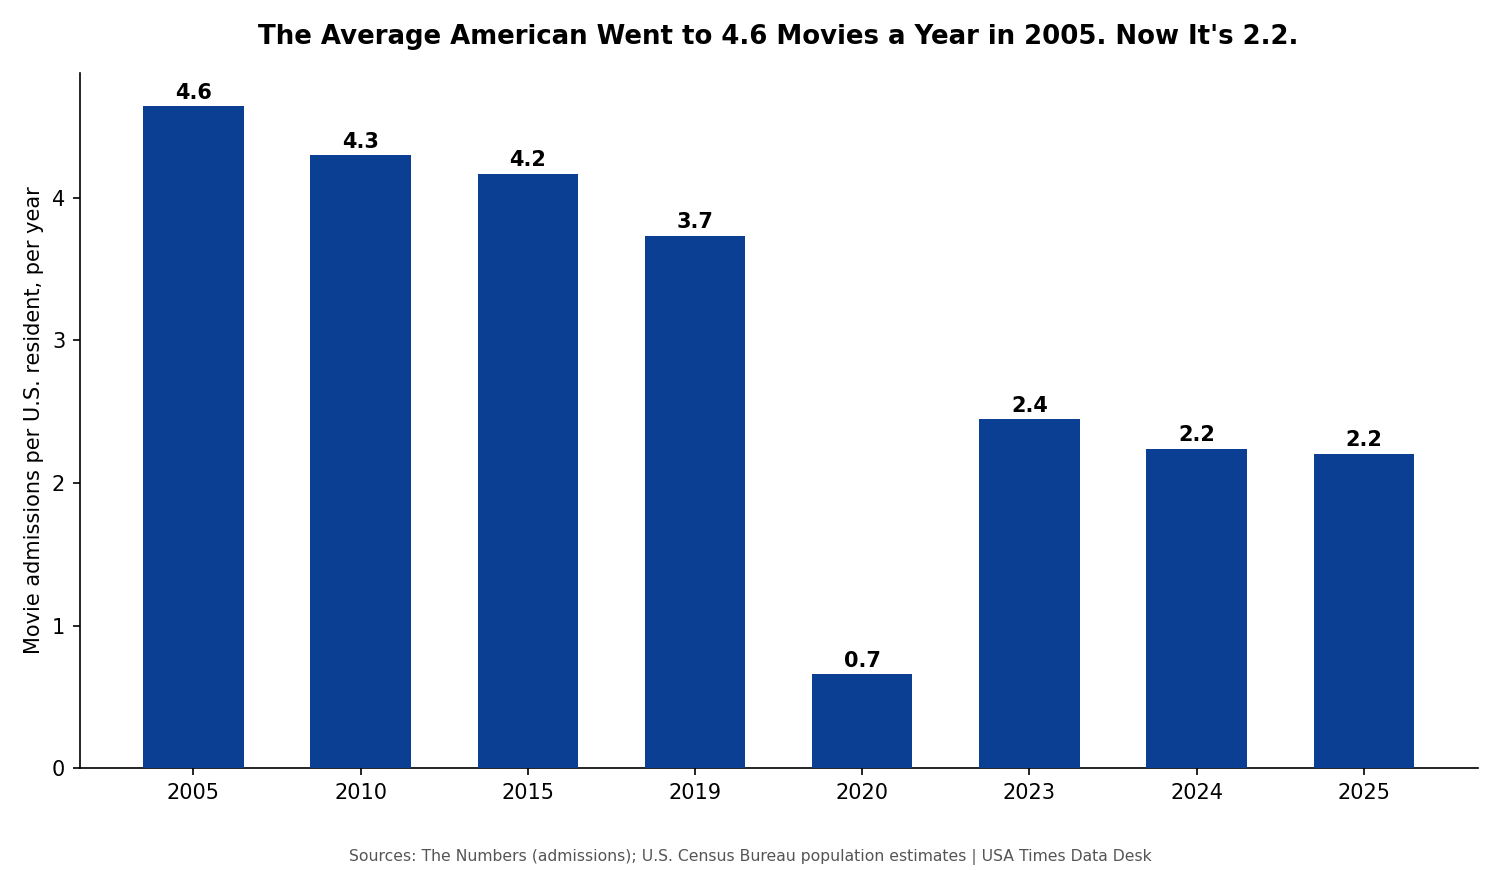
Raw ticket-sales totals already show a steep decline over the past twenty years, but they understate the real story, because the U.S. population grew by roughly 46 million people over that same span. Fewer total tickets sold against a larger population means the actual habit of moviegoing — how often the average American goes to a theater in a given year — has fallen even further than the headline admissions numbers suggest. In 2005, per-capita admissions worked out to roughly 4.6 movie outings per U.S. resident per year. Two decades later, it’s roughly 2.2 — less than half.
Why per-capita is the more honest number
Total admissions figures answer “how many tickets were sold,” which is useful for revenue math but says nothing about how deeply moviegoing is embedded in an average person’s life. Per-capita admissions answers a different, arguably more important question: if you picked a random American, how many times a year would you expect them to have gone to a movie theater? A country with a growing population and flat total admissions is a country where moviegoing is quietly losing ground per person even while the raw numbers look stable — exactly what happened through parts of the mid-2000s and 2010s, before the outright collapse in total admissions after 2019 made the decline show up in the raw numbers too.
The decline isn’t just a pandemic story
Per-capita admissions were already sliding well before COVID-19 reached a theater. Using U.S. Census Bureau population estimates alongside The Numbers’ admissions data, per-capita admissions had already drifted down from roughly 4.6 in 2005 to about 3.7 by 2019 — a nearly 20% decline over fourteen years with no pandemic involved at all. What the pandemic did was take a slow-motion decline and turn it briefly into free-fall (2020’s per-capita figure cratered to roughly 0.66 movies per person, reflecting months of closed theaters) before a partial recovery that has, so far, only brought the country back to roughly 2.2 movies per person per year — still nearly 40% below the already-diminished 2019 level, and less than half the 2005 rate.
Batmandir · The Circle Full access to theatres, museums & exhibitions. S2 · ongoing membership, without a Founder’s seat. Explore membership →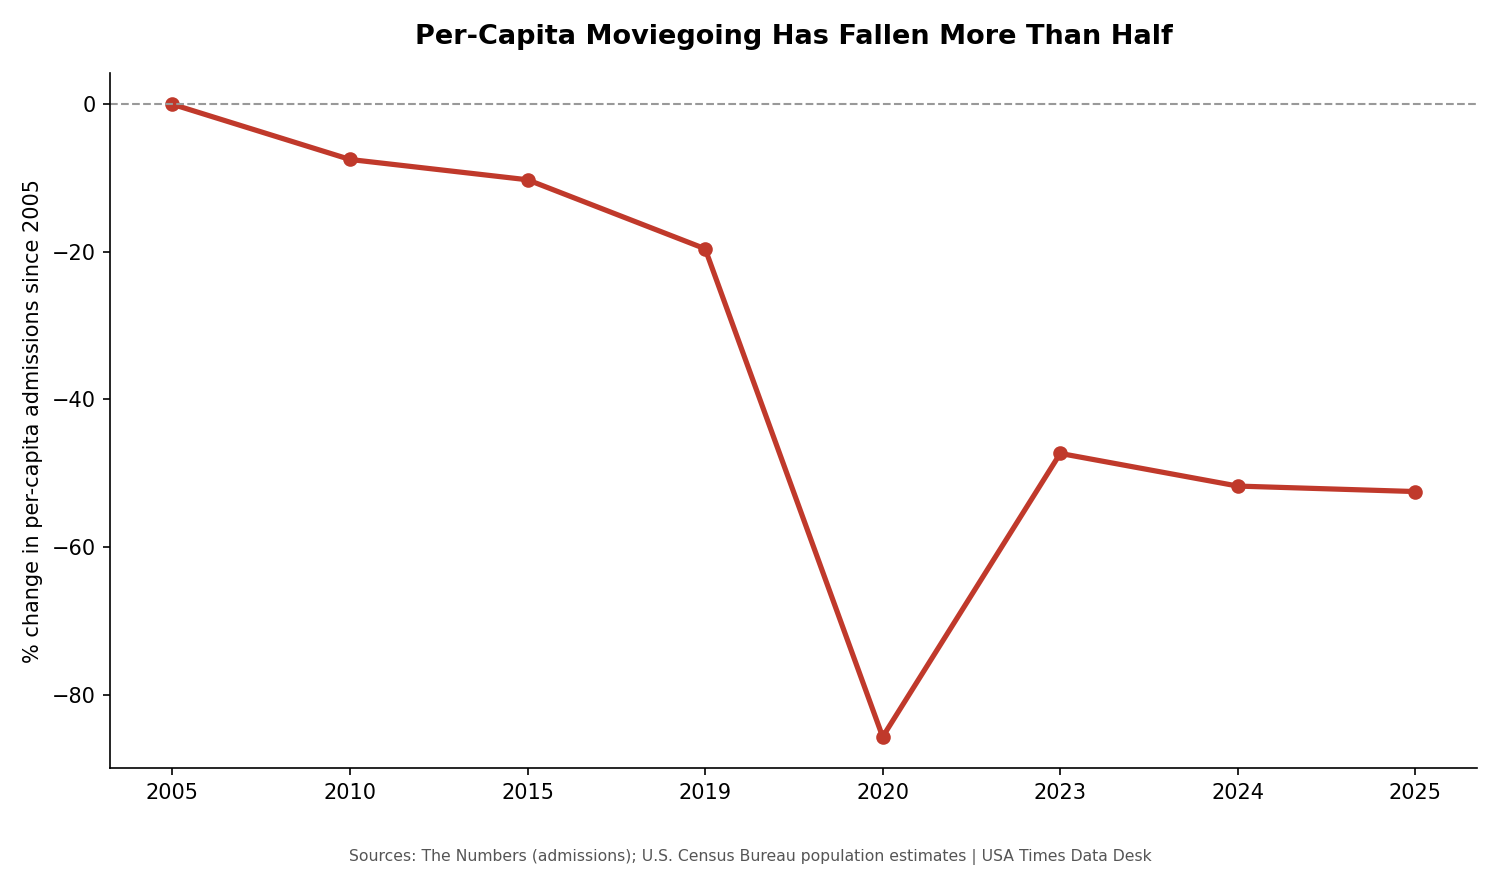
What “half the habit” actually looks like
It’s worth translating the abstraction into something concrete. If moviegoing frequency had simply held at its 2005 per-capita rate, a 2025 U.S. population of roughly 342 million people would be expected to generate on the order of 1.57 billion admissions in a year — more than double the actual 754 million tickets The Numbers reports for 2025. The gap between that hypothetical figure and the real one — well over 800 million “missing” admissions in a single year relative to the 2005 rate — is the size of the habit that’s disappeared. Some of that gap surely reflects legitimate substitutes that didn’t widely exist in 2005 in the same form: high-quality streaming libraries, larger and better home television and sound setups, and a broader menu of at-home entertainment options competing for the same evening.
Who’s most likely driving the decline
National box office data doesn’t break admissions down by age, income, or frequency-of-attendance cohort, so this analysis can’t tell you precisely who stopped going. But industry surveys and exhibitor commentary — outside the scope of what this dataset itself can confirm — have repeatedly pointed to a specific pattern worth naming even though we can’t verify it against admissions data directly: a shrinking population of “casual” moviegoers (people who used to go a few times a year without much premeditation) combined with a relatively more stable core of “frequent” moviegoers and enthusiasts who still show up regularly, often for premium-format or event-driven releases. If that pattern holds, the per-capita decline shown here would represent the casual middle of the audience eroding disproportionately, while total revenue holds up partly on the back of a smaller, more committed, higher-spending core.
Why this matters more than the revenue number
A business can survive falling volume for a long time by raising prices on the customers who remain — that’s effectively what the broader revenue-versus-admissions data in this series shows has been happening. But per-capita admissions measures something a revenue figure can’t: whether going to the movies is still a normal, expected part of American life, or whether it has become a niche activity practiced by a shrinking, self-selected group. A habit followed by fewer than half as many effective “movies per person” as twenty years ago is a genuinely different cultural position than the one moviegoing held in 2005, regardless of what the dollar totals say.
How the U.S. compares to its own recent past, decade by decade
Breaking the per-capita decline into distinct eras shows it wasn’t a single event but a series of smaller step-downs. From 2005 to 2010, per-capita admissions fell modestly, from roughly 4.6 to about 4.3 — population growth and admissions decline moving at a similar, unremarkable pace. From 2010 to 2019, the decline accelerated somewhat, landing around 3.7 by 2019 even as the population kept growing steadily. Then 2020 delivered the single largest one-year step-down in the entire dataset, before a recovery that has, through 2025, only partially clawed back roughly a third of the ground lost since 2019. Each era has its own explanation — the 2010s decline plausibly tied to the early rise of high-quality streaming and on-demand viewing; 2020 tied directly to forced theater closures; the post-2020 plateau tied to a mix of factors this series has explored from different angles — but the cumulative effect across all three eras is what produces today’s roughly-halved per-capita figure.
Why population growth alone can’t rescue the raw numbers
One natural question: could the U.S. simply “grow into” its old admissions total over time, as the population keeps expanding even if per-capita habits never recover? The math says no, at least not on any realistic timeline. The Census Bureau’s own population projections suggest U.S. population growth has been slowing, running below 1% annually in recent years — nowhere near fast enough to offset a per-capita moviegoing rate that has fallen by more than half. Getting back to 2019’s 1.23 billion admissions through population growth alone, holding today’s diminished per-capita rate of roughly 2.2 constant, would require the U.S. population to reach approximately 560 million people — a figure not projected by any credible demographic forecast for decades, if ever. Population growth is not a rescue plan for the admissions trend; it’s a rounding error next to the scale of the per-capita decline this article documents.
What we did
Admissions figures by year come from The Numbers’ Domestic Theatrical Market Summary (the-numbers.com). Population figures used to calculate per-capita admissions (2005: ~295.8 million; 2010: ~309.3 million; 2015: ~320.7 million; 2019: ~328.2 million; 2020: 331,449,281 from the 2020 Census; 2023: ~334.9 million; 2024: ~340.1 million; 2025: ~341.8 million) come from U.S. Census Bureau population estimates and the 2020 decennial Census as reported via general search of Census Bureau data; several of these (2005, 2010, 2015, 2019, 2023, 2024) are commonly cited approximate annual estimates rather than figures we pulled directly from a single Census Bureau table for this piece, and should be treated as good-faith approximations rather than exact intercensal counts. The “domestic” market covers the United States, Canada, Puerto Rico, and Guam per The Numbers’ own definition, while the population figures used are U.S.-only; this is a real, if likely small, source of imprecision in the per-capita calculation that we’re disclosing rather than papering over. The characterization of “casual” versus “frequent” moviegoer trends reflects general, widely discussed industry commentary, not survey data we independently reviewed for this article.