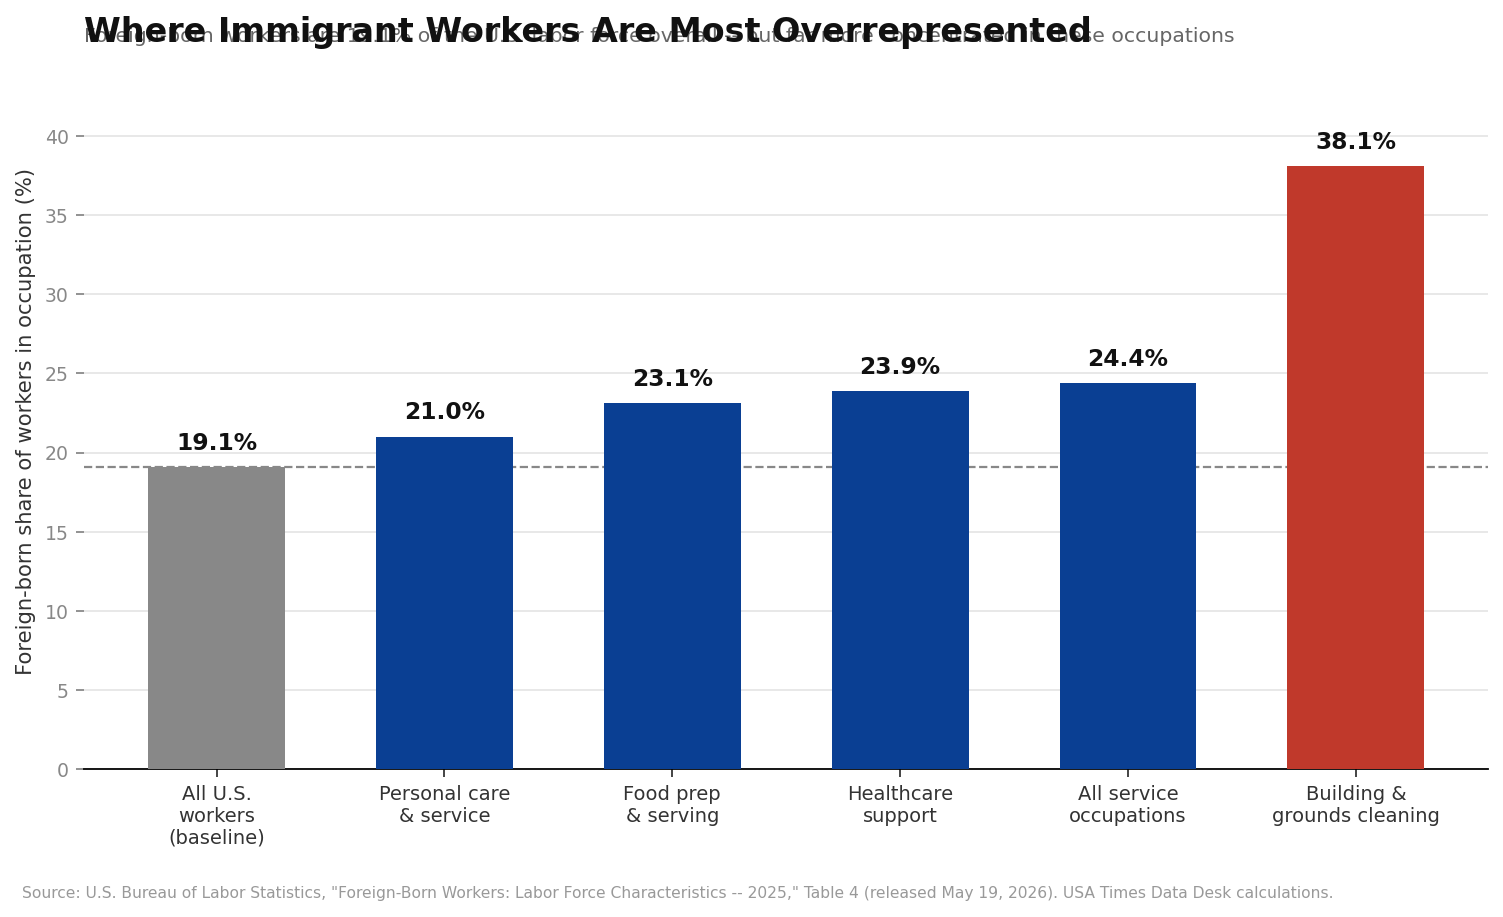
Foreign-born workers made up 19.1% of the U.S. civilian labor force in 2025, according to data the Bureau of Labor Statistics released this past May. That’s the baseline — roughly one in five workers nationwide, across every industry and occupation combined. But that average hides a wide split by occupation. In the country’s restaurants, hotels, and the buildings that house them, immigrant workers are concentrated well above that baseline — and nowhere more than in the job category that keeps those buildings clean.
Foreign-Born Share of Workers, by Occupation (2025)
Dashed context: 19.1% is the foreign-born share of the entire U.S. labor force. Hover any bar for the underlying counts.
Batmandir · Guest Passes Step inside for a day. Guest passes from $161/day — brought in by a member. See guest passes →The baseline, and where it breaks down
The BLS’s annual “Foreign-Born Workers” report doesn’t publish occupation-level nativity shares directly — it reports, separately, what percentage of all foreign-born workers fall into each occupation category, and what percentage of all native-born workers do the same. To get the metric that actually matters here — what share of a given occupation’s total workforce is foreign-born — we combined those two percentages with the topline employment totals BLS also publishes: 31.32 million foreign-born workers and 132.17 million native-born workers employed in 2025. Multiplying each group’s occupation share by its total employment, then dividing the foreign-born count by the combined total, gives the actual foreign-born share of each specific occupation.
Run that math on the occupations that make up the hospitality industry’s day-to-day labor, and the picture is uneven. In food preparation and serving — the cooks, servers, and counter staff at restaurants — foreign-born workers make up 23.1% of the roughly 8.26 million people employed in the category, about 4 percentage points above the national baseline. That’s a real gap, but a modest one. It’s the category next to it that shows the sharpest concentration: building and grounds cleaning and maintenance — janitors, housekeepers, groundskeepers, the workforce that keeps hotels, restaurants, and commercial buildings physically running — is 38.1% foreign-born, roughly double the national rate, out of 5.76 million total workers in the category.
Cleaning and maintenance stands apart
For comparison, healthcare support occupations (nursing assistants, home health aides, and similar roles) run at 23.9% foreign-born, personal care and service occupations at 21.0%, and the broad “all service occupations” category BLS uses as an umbrella comes in at 24.4%. Building and grounds cleaning and maintenance is the outlier among all of them — not just the highest of the group, but the only one that comes close to doubling the 19.1% baseline rather than sitting a few points above it. Construction and extraction occupations, which BLS tracks separately from hospitality but which intersect with it heavily in commercial and hotel construction, come in at 33.4% foreign-born — the second-highest concentration in the entire dataset, behind only cleaning and maintenance.
Who the foreign-born labor force actually is
The same BLS release breaks down the foreign-born labor force by race and ethnicity, and the composition matters for reading the occupation numbers correctly. In 2025, people of Hispanic or Latino ethnicity made up nearly half — 47.3% — of the foreign-born labor force, and people who are Asian made up another 25.9%. Together those two groups account for about three-quarters of foreign-born workers nationally. That’s a sharply different composition from the native-born labor force, where Hispanic or Latino workers are 13.8% and Asian workers are just 2.8%. Foreign-born workers also skew more male (56.6% of the foreign-born labor force, versus 52.1% native-born) and more concentrated in prime working age — 70.1% of foreign-born workers are between 25 and 54, compared with 62.7% of native-born workers. None of this changes the occupation-share math above, but it explains part of why the concentration shows up where it does: labor force participation itself is higher among foreign-born men in particular, at 76.9% versus 65.8% for native-born men, meaning a larger share of working-age immigrant men are in the labor market at all, before any occupation-level sorting happens.
Where this shows up geographically
BLS also breaks the foreign-born labor force share down by Census region, and the regional split lines up with where hospitality and food-service employment is most concentrated. The foreign-born made up 24.5% of the labor force in the West and 22.7% in the Northeast in 2025 — both above the 19.1% national figure — compared with 18.7% in the South and just 10.8% in the Midwest. New York sits in the Northeast region, which means the occupation-level concentrations described above are, if anything, likely to run higher in a market like New York City’s restaurant and hotel industry than the national averages suggest, though BLS’s regional breakdown doesn’t isolate occupation-by-region cross-tabs at the same level of detail as the national occupation table, so that’s a reasonable inference from the regional data rather than a number we can state directly.
What the same data says about pay
The same BLS release puts a number on what this concentration means economically. Median usual weekly earnings for foreign-born full-time workers were $1,059 in 2025, against $1,236 for native-born full-time workers — foreign-born workers earned 85.7% of what their native-born counterparts did. BLS is explicit that the gap isn’t a single-cause number: it reflects differences in educational attainment, occupation mix, industry, and geography layered together, not direct wage discrimination within identical jobs. But occupation mix is clearly part of the story — food preparation, cleaning and maintenance, and personal care are among the lower-median-wage categories BLS tracks, and immigrant workers are disproportionately concentrated in exactly those categories, as this analysis shows directly.
A methodological asterisk on the 2025 numbers
BLS flags one caveat on this specific release that’s worth carrying forward: the October 2025 Current Population Survey wasn’t collected at all, due to the federal government shutdown that month. As a result, the 2025 annual averages in this report are 11-month averages excluding October, and BLS itself notes they “are not strictly comparable with annual averages for other years.” That doesn’t change the occupation-share math above — those figures come from the same 11-month-average dataset internally, so the comparison between occupations within 2025 is apples-to-apples — but it does mean this year’s numbers shouldn’t be read as a clean year-over-year trend line against 2024 or earlier releases without accounting for the missing month.
What we did
We pulled Table 4 and the summary release directly from the Bureau of Labor Statistics’ “Foreign-Born Workers: Labor Force Characteristics — 2025” report (released May 19, 2026, USDL-26-0760), which is itself a primary release from a federal statistical agency rather than a secondary summary. Because BLS publishes occupation shares separately for the foreign-born and native-born populations rather than a single combined foreign-born-share-per-occupation figure, we calculated that figure ourselves: multiplying each population’s reported occupation percentage by that population’s total 2025 employment count (31.321 million foreign-born; 132.172 million native-born), then computing the foreign-born share of each occupation’s combined total. We cross-checked our combined-total employment figures for each occupation category against BLS’s own reported totals elsewhere in the release to confirm internal consistency before publishing the resulting percentages.