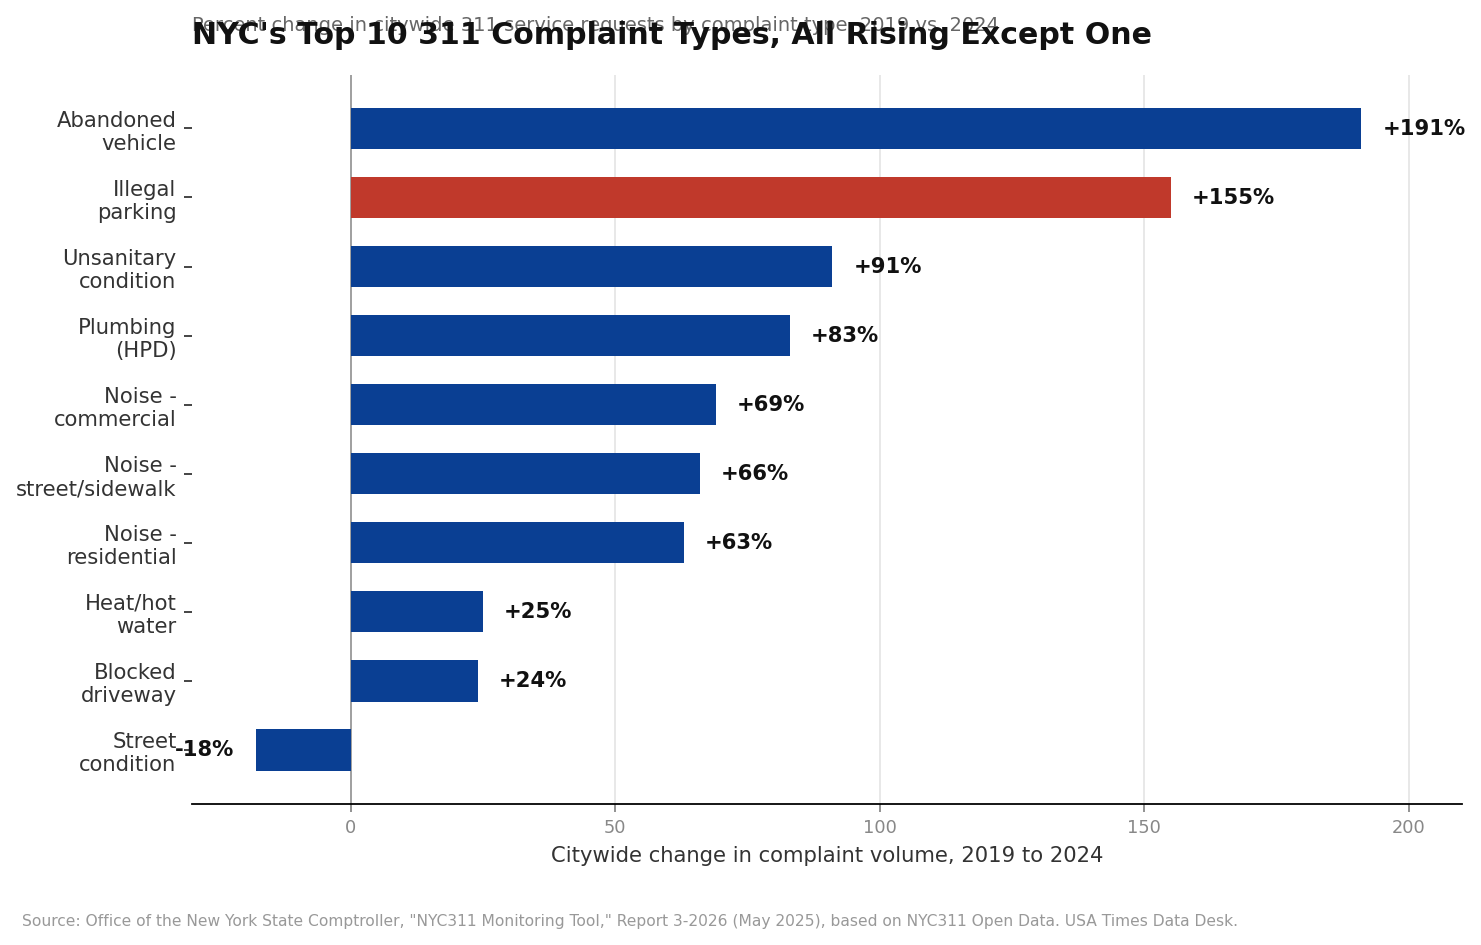
Residents of Wakefield, Williamsbridge, and Eastchester in the Bronx filed 3,134 residential noise complaints with NYC311 in 2019. In 2024, they filed 67,191 — a 2,043.9% increase in five years, according to a May 2025 analysis by the Office of the New York State Comptroller. Citywide, residential noise complaints rose 63% over the same period, itself a substantial jump but nowhere near what one neighborhood experienced. The Comptroller’s report, built from more than 17 million individual NYC311 service requests filed between 2019 and 2024, found that nine of the city’s ten most common complaint types got more frequent over five years — and identified specific neighborhoods where the increase wasn’t a modest citywide trend but a genuine local spike.
Neighborhood Spikes vs. the Citywide Trend
2019 to 2024, all figures from NYC311.
Batmandir · Guest Passes Step inside for a day. Guest passes from $161/day — brought in by a member. See guest passes →What’s actually driving the citywide numbers
NYC311 fielded 3,428,573 total service requests in 2024, up 7.2% from 2023 and up nearly 59% from 2019’s 2,157,336. The same five complaint types have topped the list every year since 2019: illegal parking, blocked driveways, residential noise, street and sidewalk noise, and heat or hot water complaints. Illegal parking alone more than doubled citywide, from 198,346 complaints in 2019 to 505,733 in 2024 — a 155% increase that the Comptroller’s office flagged as the single largest driver of NYC311’s overall volume growth, and now the single most common non-emergency complaint New Yorkers file with the city, ahead of noise, heat, and every other category combined.
The neighborhoods where a citywide trend becomes an outlier
The Comptroller’s per-capita, neighborhood-level breakdown is where the citywide averages break down into a much wider range of outcomes. Beyond Wakefield-Williamsbridge-Eastchester’s 20-fold jump in noise complaints, East New York and Cypress Hills saw abandoned-vehicle complaints rise 1,769.1% in the same five years, from 553 to 10,336 — compared with a 191% citywide increase for that complaint type. Downtown Brooklyn and Fort Greene saw illegal-parking complaints rise 405%, from 4,793 to 24,205, nearly triple the citywide growth rate for that category. These aren’t neighborhoods where complaint volume is simply high in absolute terms — they’re specific pockets where a particular problem intensified far faster than the citywide trend, which the report suggests may point to localized changes (new development, enforcement gaps, shifting land use) that a citywide average would completely obscure.
Where each type of complaint concentrates
Different complaint types cluster in different parts of the city, and the Comptroller’s per-capita analysis (which adjusts for neighborhood population using 2023 Census data) shows why raw complaint counts can be misleading. Illegal parking complaints per capita were highest in Downtown Brooklyn/Fort Greene (193 per 1,000 residents in 2024) and Park Slope/Carroll Gardens (174 per 1,000) — dense, heavily-trafficked neighborhoods. Heat and hot water complaints, by contrast, concentrated in the Bronx: Fordham/Bedford Park/Norwood (192 per 1,000), Morrisania/Tremont/Belmont/West Farms (112 per 1,000), and Washington Heights/Inwood (102 per 1,000) — areas the report notes correspond with neighborhoods that have the most housing units under HPD’s Alternative Enforcement Program for severely distressed buildings. The Bronx also topped the residential-noise-complaint list on a per-capita basis, with three of the report’s highlighted high-growth noise neighborhoods located there.
The one top-10 complaint type that actually declined
Amid nine rising categories, one of the city’s ten most common 311 complaint types moved in the opposite direction: DOT street-condition complaints (potholes, cracked pavement, and similar issues) fell from 88,460 in 2019 to 72,485 in 2024, an 18% decline — and the Comptroller’s neighborhood breakdown shows the drop wasn’t isolated to one area. Mid-Island fell 33.5%, South Ozone Park and Howard Beach fell 16.9%, and Long Island City, Sunnyside, and Woodside were roughly flat. The report doesn’t attribute this decline to a specific cause — consistent with its stated approach of flagging trends without investigating underlying drivers — but it stands out precisely because it runs against the pattern of every other top-10 category, all of which grew, several of them (unsanitary conditions, plumbing, abandoned vehicles) by 80% or more over the same five years.
A data source with a specific, disclosed limitation
The Comptroller’s report is explicit about a limitation in the underlying NYC311 dataset that matters for interpreting any of these numbers: complaint volume can be skewed by “very high-volume repeat requests from, or attributed to, a small number of individuals.” That means a neighborhood’s complaint count doesn’t necessarily reflect the number of distinct households experiencing a problem — a handful of highly persistent 311 callers filing repeated complaints about the same ongoing issue could meaningfully inflate a specific neighborhood’s numbers without that translating to a proportionally larger number of affected residents. The Comptroller’s office did not attempt to identify or filter out repeat filers in this analysis, and explicitly did not investigate the underlying causes of any of the trends it identified, stating instead that “further study by City officials may be warranted.”
Why this data exists and who’s meant to use it
The Comptroller’s office built this specific tool — drawing from NYC311’s own publicly updated Open Data dataset — explicitly to help identify which neighborhoods might need additional city agency resources. As the report frames it, the goal is to let elected officials, agency budget planners, and local advocates “review and make their own assessment of complaints within their own neighborhoods,” using the neighborhood-level, per-capita view rather than citywide totals that can mask exactly the kind of localized 20-fold spikes this analysis surfaced in the Bronx and Brooklyn. NYC311 itself has now logged more than 525 million customer contacts since it launched in 2003, consolidating 40 separate agency call lines and hotlines into the single, cross-referenceable dataset that made this kind of neighborhood-by-neighborhood comparison possible in the first place.
What we did
Every figure in this article comes directly from the Office of the New York State Comptroller’s “NYC311 Monitoring Tool” report (Report 3-2026, published May 2025), which we read in full including its data-processing appendix and neighborhood-level tables. The Comptroller’s own analysis is itself built from the public NYC311 Service Request dataset on the NYC Open Data portal — more than 17.1 million requests across 186 complaint types after OSC’s own data-cleaning process, which excluded complaint types with unintelligible category labels and complaint types with no new requests filed in the prior three years. We did not independently re-query the underlying NYC Open Data 311 dataset ourselves; we’re relying on OSC’s own published, methodologically-documented analysis rather than reprocessing 17 million raw records, and we’ve flagged the report’s own stated limitation about repeat-filer skew directly in this piece rather than omitting it.