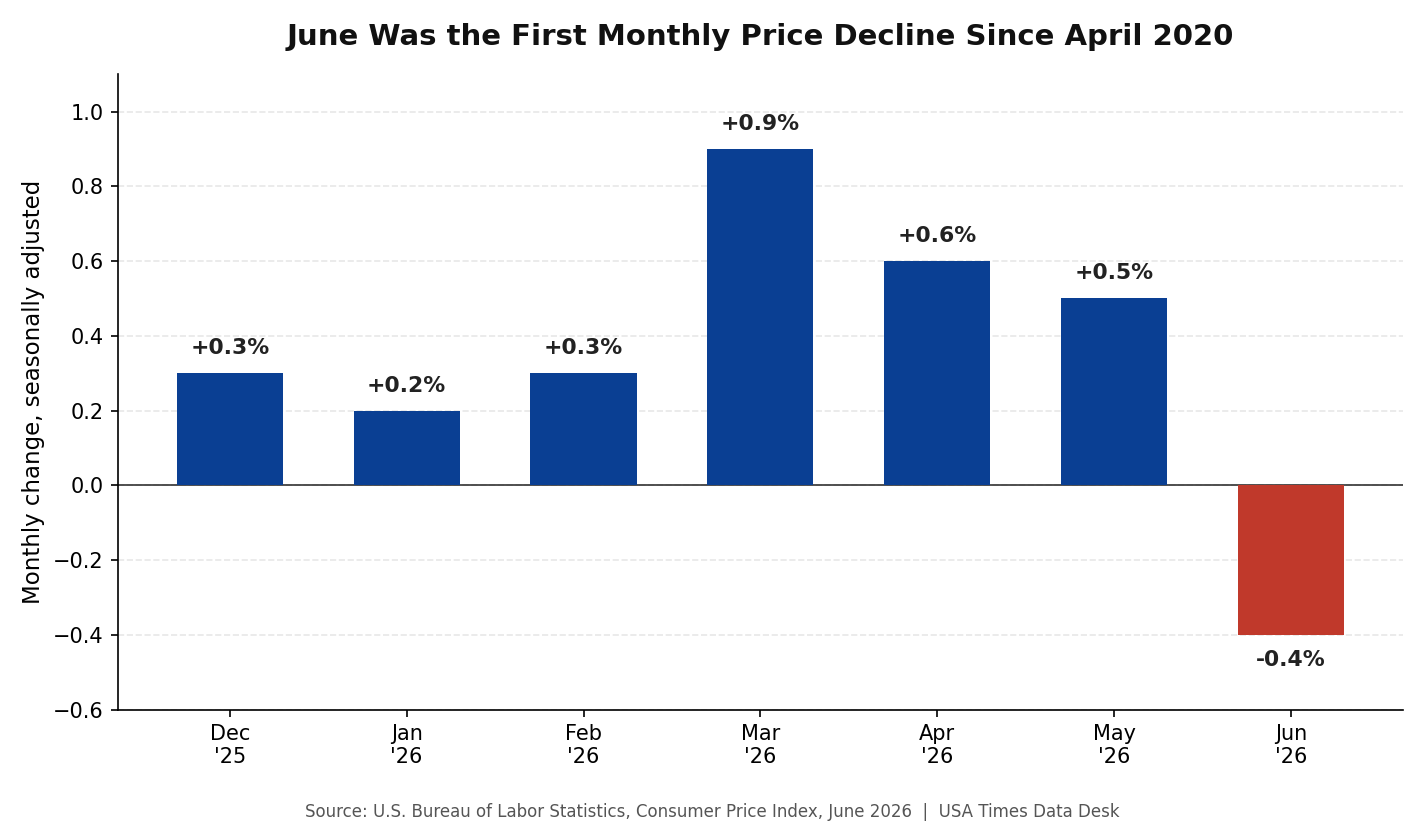
The Consumer Price Index fell 0.4% in June 2026, the largest one-month drop since the pandemic-driven 0.8% decline of April 2020, according to the Bureau of Labor Statistics. It’s a genuinely unusual reading — prices almost never fall month over month in the modern CPI series — and it followed a 0.5% increase in May. Over the full 12 months ending in June, headline inflation ran at 3.5%, down from 4.2% over the 12 months ending in May.
The number sounds like unambiguous good news, and directionally it is. But nearly the entire monthly decline came from one place: energy prices fell 5.7% in June, the sharpest one-month energy drop BLS recorded all year, driven by gasoline collapsing 9.7% as tensions tied to the Iran war eased. Strip out food and energy, and “core” CPI — the measure the Federal Reserve watches most closely because it excludes the most volatile categories — was exactly flat in June, at 0.0% for the month.
A single-commodity story, not a broad cooldown
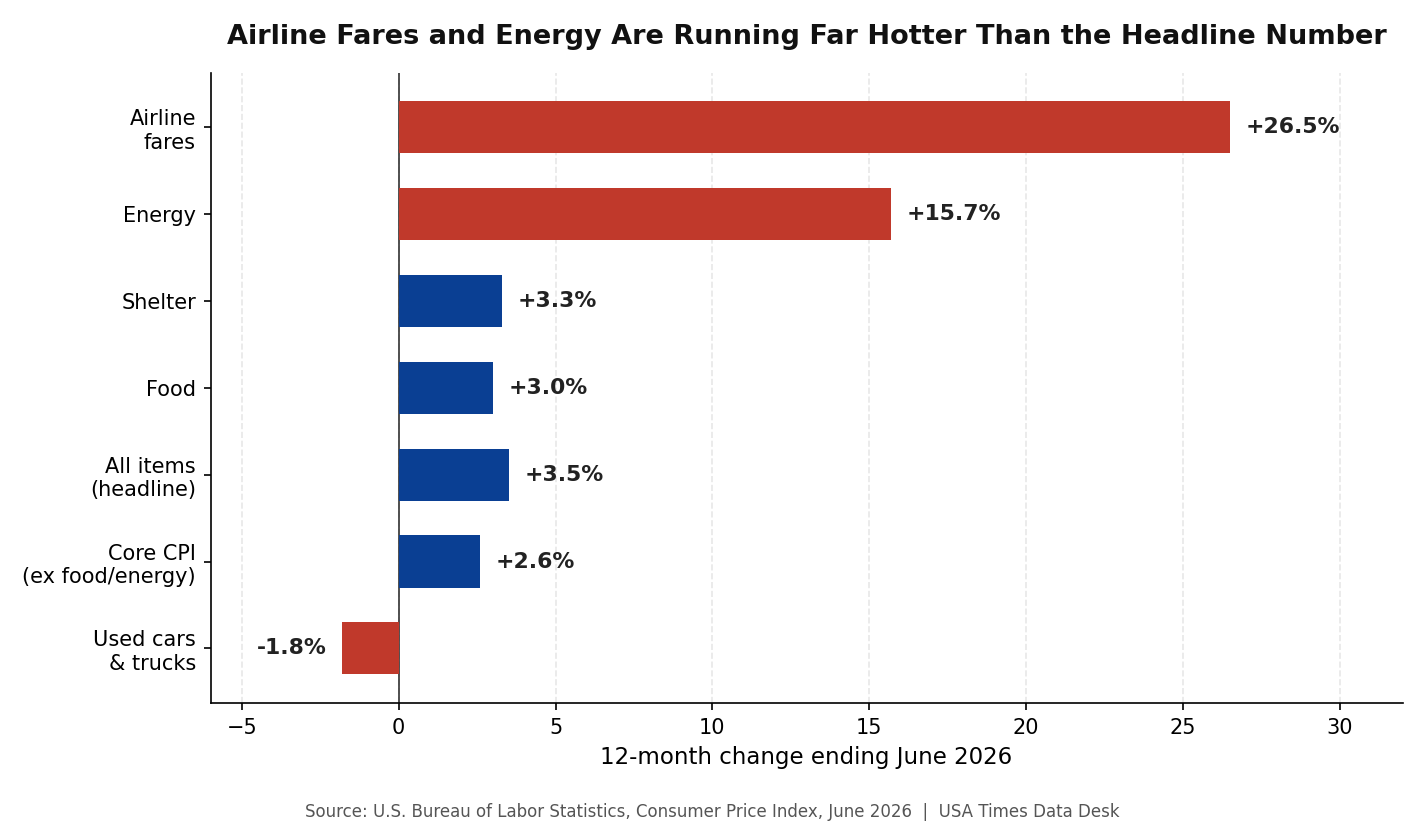
Gasoline prices are volatile and geopolitically driven in a way core goods and services prices generally aren’t — which is exactly why the Fed and most economists focus on core CPI rather than the headline number for judging underlying inflation trends. Gasoline had risen sharply for three straight months before June: up 21.2% in March, 5.4% in April, and 7.0% in May, largely on Iran-related supply fears. June’s 9.7% drop reversed only part of that run-up. Over the full 12 months ending in June, gasoline is still up 26.7%, and energy overall is up 15.7% year-over-year — both categories running many multiples hotter than the 3.5% headline rate they helped push down this month.
Batmandir · The Circle Full access to theatres, museums & exhibitions. S2 · ongoing membership, without a Founder’s seat. Explore membership →In other words: June’s “good” inflation print was mechanically almost entirely a story about oil markets cooling off after a geopolitical scare, not a broad-based moderation in the prices businesses charge for everything else. If gasoline prices merely stabilize rather than continuing to fall, the headline monthly number is likely to snap back toward the 0.2%-0.3% range core inflation has been running at most months this year.
Shelter inflation, the stickiest number in the report, kept cooling
One genuinely encouraging detail: shelter costs, historically the slowest-moving and most persistent component of CPI, rose just 0.1% in June — the smallest one-month shelter increase since January 2021. Shelter is up 3.3% over the past year, still elevated but continuing a gradual deceleration. Because shelter carries the largest weight of any category in the CPI basket, its slow, steady cooling matters more for the medium-term inflation trajectory than any single month of gas-price swings.
Airline fares are the outlier no one’s talking about
Buried in the report’s list of 12-month category changes is a number far larger than anything else BLS reported: airline fares are up 26.5% over the past year — nearly matching gasoline’s 26.7% annual increase, and far outpacing the 3.5% headline rate. BLS’s June release doesn’t break down the specific drivers behind that jump, but it’s the single largest year-over-year increase of any major category the agency reported, ahead of energy services, food away from home, and every other line item in the release. For any household or business budgeting around airfare, June’s “good” inflation report contained an unusually bad number hiding in plain sight.
Elsewhere in the report, prices fell for several specific goods and services in June: motor vehicle insurance (-2.0%), communication services (-1.5%), apparel (-0.6%), used cars and trucks (-0.2%), and medical care (-0.1%). Used cars and trucks are now down 1.8% over the full 12 months — one of the only major categories in negative territory year-over-year.
Eggs, coffee, and the grocery aisle’s mixed picture
Grocery prices moved in both directions in June, and the divergence is worth a closer look than the 0.2% food-at-home headline suggests. Eggs rose 4.3% for the month alone, part of a meats-poultry-fish-and-eggs category that climbed 0.6% overall. Dairy and related products rose 1.2%. On the other side of the ledger, coffee prices fell 2.0% and the broader nonalcoholic beverages category dropped 1.5% — the single largest monthly decline of any major grocery category BLS tracked in June. Fruits and vegetables also edged down 0.2% for the month, even though that category is up a stronger-than-average 5.3% over the full year.
Restaurant prices kept climbing steadily, as they have for most of the past two years: food away from home rose 0.2% in June and 3.4% over the past 12 months, with full-service restaurant meals (+3.7% year-over-year) outpacing limited-service and fast-food meals (+3.1%).
The number came in better than markets expected
Ahead of the report, Wall Street forecasters had generally expected a smaller monthly decline of around 0.2% and a 3.8% annual rate — meaning both the monthly drop and the annual deceleration to 3.5% came in more favorable than economists had projected. Markets tend to weigh core CPI more heavily than the headline figure precisely because of episodes like this one, where a single volatile category can swing the topline number well past or short of expectations without reflecting a genuine change in the broader inflation trend.
What we did
All figures in this piece — the monthly and 12-month CPI changes, the energy and gasoline breakdowns, the core CPI figure, the shelter, food, airline fare, and other category-level changes — come directly from the Bureau of Labor Statistics’ Consumer Price Index Summary for June 2026, published July 14, 2026, and read directly from bls.gov. We did not use any secondary aggregator for these figures. The market-expectation figures (the roughly 0.2% and 3.8% consensus forecasts) are not from BLS, which does not publish or comment on analyst forecasts; those figures reflect contemporaneous financial media reporting on Wall Street consensus estimates ahead of the release. The characterization that geopolitical tension tied to the Iran war contributed to the earlier gasoline run-up and its June reversal reflects contemporaneous reporting on oil markets during that period rather than a claim BLS itself makes in its statistical release, which reports price changes without attributing specific causes. The next CPI report, covering July 2026, is scheduled for release August 12, 2026.