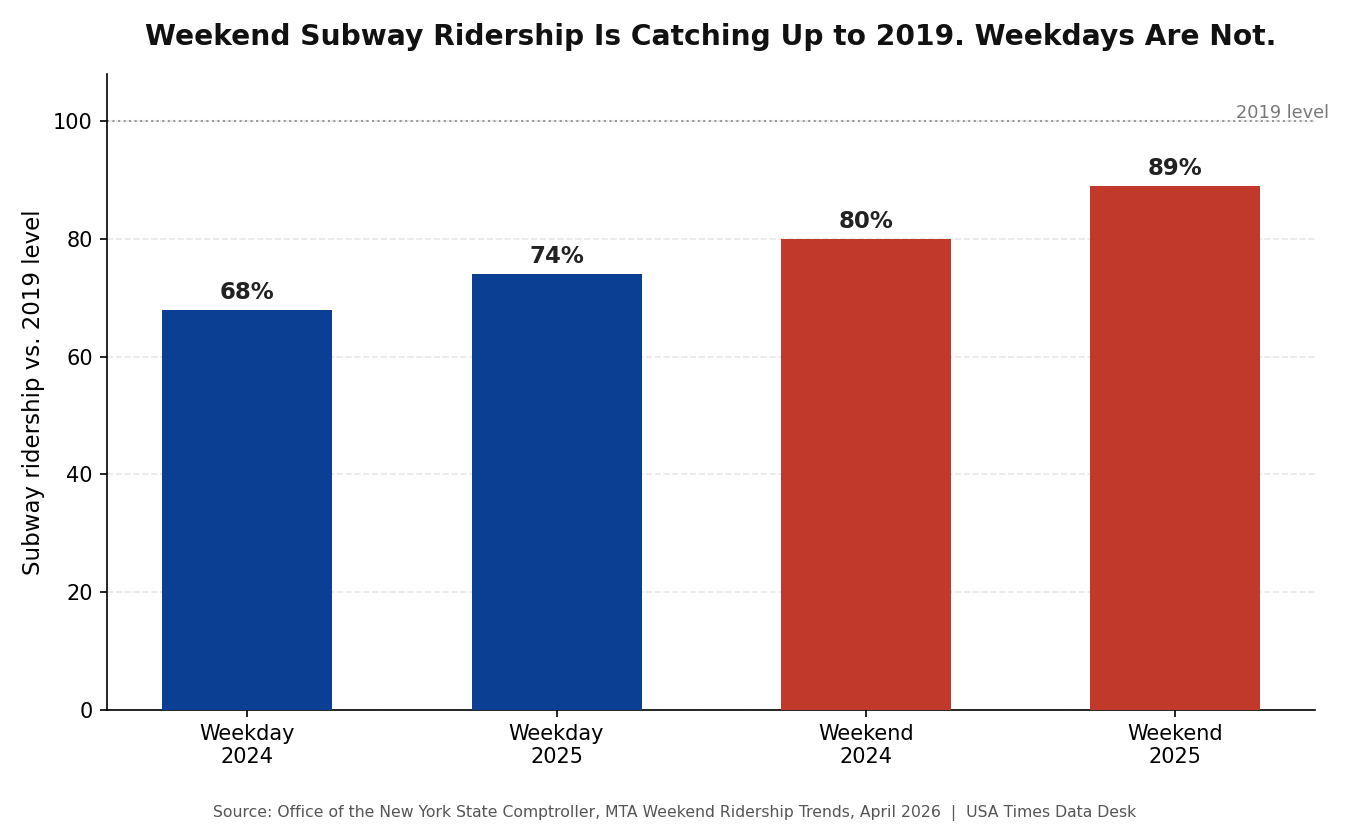
Weekend subway ridership in New York City reached 89% of its 2019 level in 2025, up from 80% the year before, according to an April 2026 report from New York State Comptroller Thomas DiNapoli’s office. Weekday ridership, by contrast, sat at just 74% of 2019 levels in 2025 — meaning New York’s subway system is now nearly fully recovered on weekends while remaining meaningfully depressed on the days most tied to commuting.
That gap isn’t new, but it’s been widening steadily. In 2020, weekday and weekend recovery rates differed by just 2 percentage points. By 2025, the gap had grown to nearly 15 points — a sign the pandemic didn’t just temporarily suppress subway use, it permanently reshaped when New Yorkers ride it.
Weekends now make up a bigger share of all subway trips
The shift shows up in the composition of ridership itself. Weekends accounted for 20% of total MTA ridership in 2025, up from 17% in 2019 — weekdays still make up the large majority at 80%, but that three-point shift represents a real change in how the system gets used. DiNapoli’s office attributes the trend to leisure travel and tourism, which have recovered faster than commuting, along with a broader national pattern of hybrid and remote work reducing the traditional five-day commute.
Batmandir · The Circle Full access to theatres, museums & exhibitions. S2 · ongoing membership, without a Founder’s seat. Explore membership →Some parts of the system have already exceeded their pre-pandemic weekend baseline entirely. The Long Island Rail Road’s average weekend ridership in 2025 was 27% higher than in 2019, helped by new service to Grand Central Madison. Metro-North’s weekend ridership reached 92% of 2019 levels. MTA bridge and tunnel crossings were the first mode to fully recover, hitting 2019 weekend levels as early as spring 2021, driven by a pandemic-era rise in car ownership. Paratransit service fully recovered by 2023.
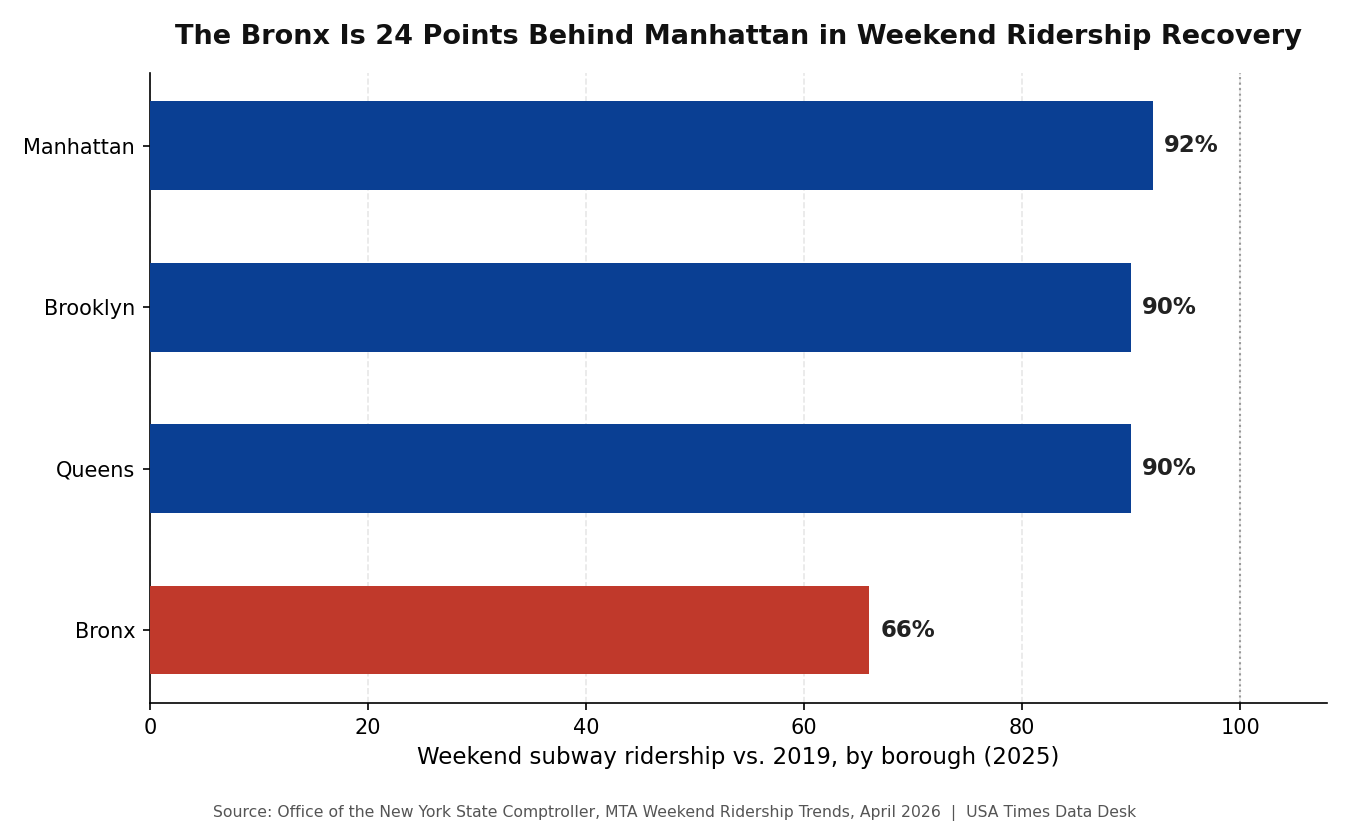
The Bronx is 24 points behind Manhattan
Recovery isn’t uniform across the city. Manhattan’s weekend subway ridership reached 92% of its 2019 level in 2025, with Brooklyn and Queens both at 90%. The Bronx trailed well behind at 66% — though that’s an 8-percentage-point improvement over 2024, the largest year-over-year gain of any borough. DiNapoli’s report links the disparity partly to employment patterns: Manhattan has the lowest unemployment rate of the five boroughs and is the city’s primary tourist destination, while the Bronx has the highest unemployment rate, and weekend subway demand appears to track retail, leisure, and tourism activity more than baseline population.
Buses are the system’s weak spot — and fare evasion is a factor
Paid weekend bus ridership sat at just 67% of 2019 levels in 2025 — the slowest-recovering mode in the entire system. Include estimated non-paying riders, and that figure rises to roughly 81%, meaning a meaningful share of the ridership gap is really a fare-collection gap, not a demand gap. Fare evasion on MTA buses, which ran around 20% before the pandemic, spiked as high as 50% in 2024. The MTA’s enforcement efforts, run jointly with the NYPD, brought that rate down to an average of 46% in 2025 — an improvement, but still more than double the pre-pandemic baseline.
The MTA hasn’t just waited for demand to return on its own. Weekend subway service increased more than 5% in 2025 compared with 2019, and on-time performance on weekends rose to 86.6% in 2025 — better than the 83.9% recorded in 2019 itself, and well above the 80.5% low point of 2022. That combination, more frequent service and better reliability, is the specific lever DiNapoli’s report credits for accelerating weekend recovery, and the one it recommends the MTA lean into further as it continues managing an uneven return to the system.
Why the weekday-weekend split matters for the MTA’s finances
The pattern has real budget implications. Weekday commuter ridership has historically funded the bulk of MTA fare revenue through high-volume rush-hour trips, while weekend ridership, even fully recovered, generates revenue at a different, more leisure-driven pace. A system where weekend ridership outpaces weekday recovery may see steadier revenue from tourism and retail-linked trips, but it doesn’t replace the reliable, high-density fare revenue that five-day office commuting used to guarantee — a dynamic playing out across large transit systems nationally, not just in New York.
What DiNapoli is recommending next
The report doesn’t just document the gap — it makes specific recommendations for closing it. DiNapoli’s office urges the MTA to keep increasing weekend service reliability and frequency to match rising demand, to work with state and city partners to address fare evasion’s continued drag on bus revenue, and to specifically target the subway and bus lines with the slowest recoveries, calling out the Bronx by name as the borough most in need of targeted attention. The report also points to the Fair Fares program — which reduces transit costs for low-income New Yorkers — as a tool that could help pull paid ridership back up on the lines and boroughs still lagging furthest behind.
DiNapoli, in his own statement accompanying the report, called weekend ridership recovery “a bright spot for the country’s largest transportation system” while also noting the work still ahead: continuing to improve service reliability, addressing fare evasion’s revenue impact, and focusing specifically on the areas — geographic and modal — where the recovery still falls furthest short of 2019.
What we did
All figures in this piece — the weekday and weekend subway recovery rates, the borough-level breakdowns, the LIRR, Metro-North, bridge-and-tunnel, and paratransit recovery figures, the bus ridership and fare-evasion data, and the service and on-time-performance statistics — come directly from the Office of the New York State Comptroller’s report “MTA Weekend Ridership Trends,” released April 16, 2026, and the accompanying press release, both read directly from osc.ny.gov. All percentages describing ridership “recovery” compare a given year’s average ridership to the equivalent 2019 baseline, as defined and calculated by the Comptroller’s office using MTA data; we did not independently recalculate these ratios from raw MTA ridership counts. Fare evasion figures cited in the report are MTA estimates rather than exact counts, since evasion is by definition unticketed and unrecorded; DiNapoli’s office reports bus ridership recovery both including and excluding estimated evaders specifically to keep that distinction visible rather than blending it into a single number.