Read in: English · Español · Русский · 中文 · Português
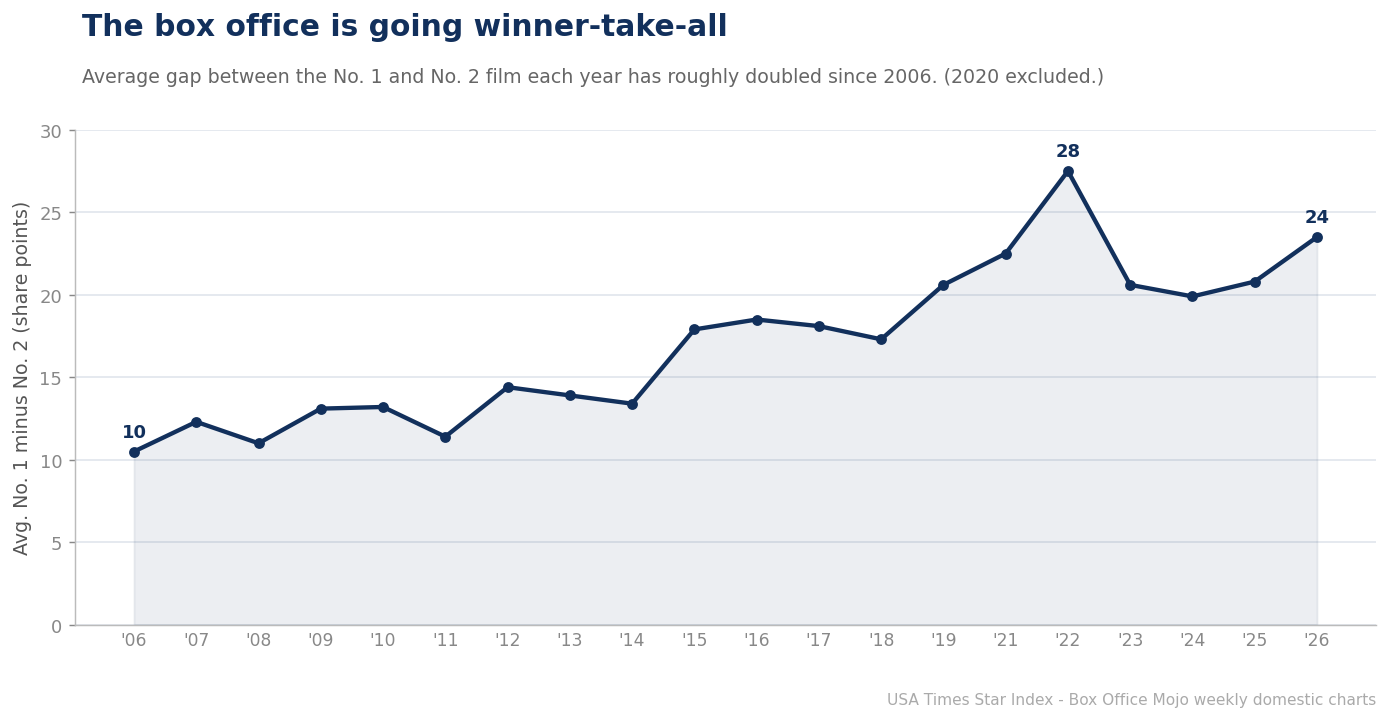
The gap between the No. 1 film and the No. 2 film in any given week is a clean measure of how lopsided the box office is. In the USA Times Star Index, that gap has roughly doubled since 2006 — from an average of about 10 share points in the mid-2000s to the low-to-mid 20s in the 2020s, peaking at 27.5 points in 2022. The modern box office isn’t just big at the top; it is increasingly a place where one film wins and everything else is an afterthought.
From a crowded market to a superstar market
In 2006, the average week saw the top two films finish within about ten points of each other — a real contest most weekends. By 2015 the gap had jumped to 18 points, and it has stayed in the high teens or low 20s ever since. The trend tracks the industry’s consolidation around franchises and event films: as studios concentrated budgets and screens on a shrinking number of tentpoles, those films began lapping the field. When a Marvel, Avatar, or Star Wars title opens, it can take 80% of the market while everything else fights over scraps — and there are simply more of those blowout weeks than there used to be.
Batmandir · The Circle Full access to theatres, museums & exhibitions. S2 · ongoing membership, without a Founder’s seat. Explore membership →The mid-budget casualty
This is the same story we’ve told from other angles — the vanishing mid-budget film, the rise of total-domination weeks — seen through the cleanest possible lens. A widening No. 1–No. 2 gap means the second-place slot is worth less than it used to be; the counter-programmed drama or comedy that once finished a close second now trails far behind. The box office has become a winner-take-all market, and the data puts a number on it: the winner’s margin has doubled in a generation.
Three eras of concentration
The year-by-year gap falls into three distinct regimes. From 2006 to 2011, the average No. 1–No. 2 gap sat around 11–13 points — a competitive market where a strong second film was routine. From 2012 to 2019, it stepped up into the mid-to-high teens as the franchise era took hold. And since 2021 it has lived in the low-to-mid 20s, peaking at 27.5 points in 2022. Each step corresponds to a wave of consolidation: the rise of the shared-universe tentpole, the collapse of the mid-budget release, and the concentration of marketing spend on fewer, bigger films.
| Era | Avg No.1–No.2 gap |
|---|---|
| 2006-2011 | ~12 points |
| 2012-2019 | ~16 points |
| 2021-2026 | ~22 points |
The vanishing value of second place
A widening gap is, functionally, a devaluation of the runner-up slot. When the No. 1 film beats No. 2 by 25 points instead of 10, the second-place release is capturing far less of the week’s attention and money — and the counter-programmed drama, comedy, or original that once could count on a healthy second-place run now trails badly. This is the same force behind the disappearance of the mid-budget movie: in a winner-take-all market, there is little room for the film that would have been a solid No. 2.
Is the trend permanent?
There are hints of a ceiling. The gap eased from its 2022 peak into 2023–2024 before ticking up again in 2025–2026, suggesting the market may be oscillating at a high plateau rather than climbing without limit. Whether it stays there depends on the one variable studios control: how many genuine event films they can release in a year. More giants means more blowout weeks and a wider average gap; a return to a deeper bench of mid-sized hits would narrow it. For now, the twenty-year direction is unambiguous — the winner’s margin has doubled, and second place isn’t what it used to be.
A global pattern, not just an American one
The winner-take-all drift is not unique to the United States. The same forces — franchise consolidation, the migration of mid-budget storytelling to streaming, and the concentration of marketing on a few tentpoles — have reshaped box offices worldwide, from the UK to Korea. What makes the U.S. data valuable is its length and consistency: twenty unbroken years of weekly shares let us watch the concentration happen in slow motion, and put a single, comparable number on it each year. The doubling of the No. 1–No. 2 gap is the clearest single statistic for a change everyone in the industry has felt.
The consumer’s side of the ledger
For moviegoers, a winner-take-all market is a double-edged thing. It concentrates the industry’s resources into a handful of genuinely spectacular event films — the kind worth seeing on the biggest screen — while thinning out the mid-tier options that once filled an ordinary weekend. The result is a calendar of a few unmissable giants separated by long stretches with little that demands a trip to the theater. That rhythm, more than any single film’s success, is what has reshaped the moviegoing habit over the past decade.
What would reverse it
The gap is not a law of nature. It would narrow if studios rebuilt a deeper bench of mid-sized theatrical releases — the $30–70 million films that once reliably finished a strong second — or if the theatrical window widened enough to give those films room to run. The slight easing from the 2022 peak hints that the market may be near a ceiling rather than climbing indefinitely. But the twenty-year arc is unambiguous, and reversing it would take a deliberate change in how the industry allocates its money. Until then, the safest bet in the data is that the winner will keep taking more.
Why 2022 was the peak
The single most lopsided year in the record, 2022, is worth pausing on. It was the year Top Gun: Maverick, Avatar: The Way of Water, Black Panther: Wakanda Forever, Doctor Strange in the Multiverse of Madness and Jurassic World Dominion each opened to overwhelming shares while the mid-tier remained thin in the post-pandemic recovery. The result was a calendar of enormous peaks separated by soft valleys — the exact shape that maximizes the average No. 1–No. 2 gap. 2022 wasn’t an aberration so much as the logical extreme of the winner-take-all trend, briefly unbuffered by any mid-budget bench at all.
What a narrower gap would require
For the gap to shrink durably, one of two things has to change. Either studios rebuild a deeper slate of mid-sized theatrical releases — films big enough to finish a strong, close second — or the theatrical window widens enough that those films have room to run before hitting streaming. Both are within the industry’s control, and there are early signs of a mid-budget revival at some studios. But the economics still point the other way: the surest return remains the giant, and as long as that is true, studios will keep concentrating their spending, and the winner will keep lapping the field.
The number to watch
Going forward, the single cleanest gauge of whether the box office is broadening or narrowing is this one statistic: the average annual gap between the No. 1 and No. 2 film. It rose from about ten points to the mid-twenties over two decades. If it drifts back toward the teens, it will mean the mid-budget film is genuinely returning and the market is re-broadening. If it holds in the twenties or climbs again, the winner-take-all era is here to stay. It is the box office’s inequality index — and, like most inequality measures, it has been moving in one direction for a long time.
What we did: For each year we averaged the difference between the No. 1 and No. 2 film’s weekly share across all of that year’s weeks. Weekly share is each film’s gross as a percentage of that week’s total U.S. domestic box office, from Box Office Mojo’s weekly charts, 2006–2026. We exclude 2020, whose pandemic-shrunken weeks distort shares below the Star Index qualification floor.
Related from the USA Times Data Desk
- One Movie, Most of the Money
- The Decade Shift: How the Box Office Became Winner-Take-All
- The Star Index methodology
Sources
- Box Office Mojo — weekly and weekend box office grosses
- The Numbers — historical domestic box office records
- USA Times — Star Index methodology (how our tiers and box-office share are computed)