Read in: English · Español · Русский · 中文 · Português
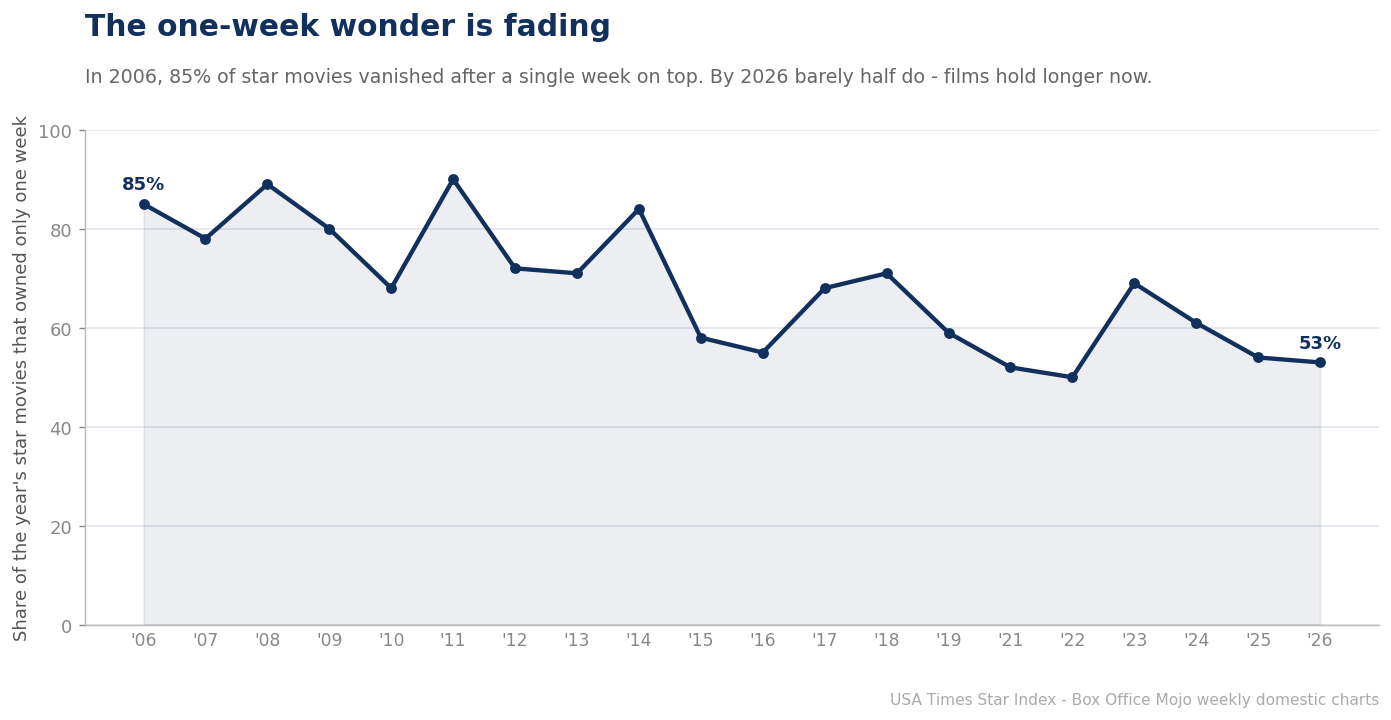
For most of the box office’s modern history, owning the top spot meant owning it for exactly one week. A film opened big, took the crown, and was gone the following Friday. That pattern — the one-week wonder — is quietly disappearing. In 2006, 85% of the year’s star movies owned the box office for a single week and then vanished. By 2026, barely half do. The films that reach the top are staying there longer than they used to.
A slow, steady decline
The trend is not a blip. Through the late 2000s the one-and-done rate hovered in the high 70s and 80s — 85% in 2006, 89% in 2008, 78% in 2007. It began drifting down through the 2010s and has settled in the 50s and low 60s in the current decade: 61% in 2024, 54% in 2025, 53% so far in 2026. In round terms, a star movie in 2006 had roughly a five-in-six chance of being a one-week wonder; today it is closer to a coin flip. Something structural has changed about how long the biggest films hold their ground.
Batmandir · The Circle Full access to theatres, museums & exhibitions. S2 · ongoing membership, without a Founder’s seat. Explore membership →Why films hold longer now
The explanation ties directly to the concentration we’ve documented across the Star Index. The modern top of the market is dominated by enormous franchise films that open so high they can absorb the inevitable second-weekend drop and still lead the following week. When a film opens at 60% of the market, a steep decline still leaves it comfortably on top; when it opens at 27%, the next release knocks it off immediately. As the mix of star movies has shifted toward these high-opening giants — and away from the modest Mini-geuses that once briefly led quiet weeks — the average reign has lengthened and the one-and-done rate has fallen.
There is a second, subtler driver: the thinning of the release calendar’s middle. In 2006 there were enough mid-sized wide releases that a new film could grab the top for a week almost every weekend, producing a churn of one-week wonders. As those mid-budget releases migrated to streaming, fewer fresh challengers arrive to unseat the incumbent, so the film on top simply stays there another week by default. Fewer challengers means fewer handoffs means fewer one-week reigns.
The paradox of a ‘stickier’ box office
It would be easy to read a falling one-and-done rate as a sign of health — films with real staying power, audiences returning week after week. The reality is more double-edged. Longer reigns are concentrated almost entirely among the biggest films, which hold longer not because more people are discovering them over time but because nothing large enough to challenge them is opening. The box office is stickier at the very top and emptier in the middle. A lower one-week-wonder rate, in other words, is less a story about durable hits and more another symptom of a market consolidating around a shrinking number of giants.
For studios, the implication is that a strong opening now buys more than a headline — it buys time on top that used to be nearly impossible to hold. For everyone tracking the industry, the one-and-done rate is a useful, underwatched barometer: when it rises, the market is broad and competitive; when it falls, as it has for twenty years, the giants are tightening their grip.
| Era | One-week-wonder rate |
|---|---|
| 2006-2009 | ~85% |
| 2014-2018 | ~70% |
| 2023-2026 | ~55% |
What the video era looked like
To appreciate how far the one-week-wonder rate has fallen, it helps to remember the market it came from. In the mid-2000s, theatrical windows stretched four to six months before home video, and studios released a deep bench of mid-budget films — comedies, thrillers, romantic dramas — almost every weekend. That constant supply of fresh wide releases meant a new film could seize the top nearly every Friday, and the incumbent, however good, was usually pushed aside within seven days. A high one-and-done rate was the natural product of a crowded, fast-cycling marketplace where no single film could monopolize screens for long.
That world dissolved in stages. The compression of the theatrical window, the collapse of the mid-budget release, and the rise of a small number of franchise mega-films each pushed in the same direction: fewer new challengers, bigger incumbents, longer reigns. The falling one-and-done rate is essentially a time-lapse of that transformation, captured in a single number that drops steadily from the mid-80s to the low-50s across the two decades.
The exhibitor’s view
For theater owners, longer reigns are a mixed inheritance. A film that holds the top for two or three weeks simplifies screen scheduling and keeps a proven draw in the largest auditoriums, where concession margins are richest. But the same dynamic that lengthens reigns — fewer strong new releases — also thins the calendar between giants, leaving exhibitors with stretches of soft weeks and nothing fresh to program. A lower one-and-done rate is, from the theater’s seat, both a comfort and a warning: the hits last longer, but there are fewer of them, and the gaps in between are harder to fill.
An international contrast
The pattern is not identical everywhere. Markets with longer theatrical windows and deeper local-language production — parts of Europe and Asia — still see more turnover at the top, because a steady supply of domestic releases keeps challenging the incumbents. The American one-and-done collapse is, in part, a symptom of how completely the U.S. theatrical market has narrowed to a franchise-driven top tier. Where a diverse slate survives, one-week wonders survive with it; where the slate has hollowed out, reigns lengthen by default.
The metric worth watching
The one-and-done rate deserves a place alongside opening-weekend grosses and cumulative totals as a health indicator for the theatrical business. A rising rate would signal a genuinely broadening market — more films strong enough to grab a week, more turnover, more competition. Its two-decade decline says the opposite: the top of the box office is being held by fewer films for longer, and the churn that once defined the weekly race has slowed to something closer to a procession.
What 2027 could tell us
The 2026 figure — 53% one-and-done through the year so far — sits right at the bottom of the twenty-year range, and 2027 will be an unusually clean test of whether the decline continues or stabilizes. The year’s slate is unusually front-loaded with guaranteed giants, from a new Star Wars feature to the next wave of franchise tentpoles, each of the kind that tends to hold multiple weeks. If the one-and-done rate falls into the 40s, it will confirm that the market has structurally shifted to fewer, stickier hits. If it bounces back toward 60%, it will suggest 2024–2026 was a floor rather than a trend line. Either way, it is the metric to watch as the year’s numbers come in — a single figure that captures whether the top of the box office is broadening or continuing to narrow.
What the two decades already make clear is that the reflexive image of the box office — a fast churn of one-week champions, each dethroned by the next — is increasingly out of date. That was the 2006 market. The 2026 market is slower, heavier, and more concentrated at the top, and the humble one-and-done rate has been quietly documenting the change the whole time.
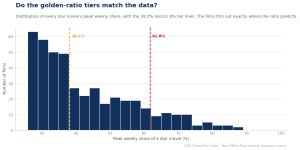
What we did: For every qualifying star movie we counted its total weeks at or above the 26.18% star floor, then took the share, per year, that lasted exactly one week. Weekly share is each film’s gross as a percentage of that week’s total U.S. domestic box office, from Box Office Mojo’s weekly charts, 2006–2026. We exclude 2020 as a pandemic anomaly.
Related from the USA Times Data Desk
- One-Week Wonders: The Box Office’s Shooting Stars
- The Bigger the Win, the Longer the Reign
- The Star Index methodology
Sources
- Box Office Mojo — weekly and weekend box office grosses
- The Numbers — historical domestic box office records
- USA Times — Star Index methodology (how our tiers and box-office share are computed)