Read in: English · Español · Русский · 中文 · Português
The MTA likes to talk about on-time performance as a single number, and for good reason – it is one of the few figures that captures, in one stroke, whether the subway is doing the basic thing it exists to do. But the citywide average hides enormous variation. In the latest data, the month of July 2026, one line got nine of every ten trains to their last stop on schedule while another barely cleared two of three. We pulled the MTA’s own terminal on-time performance records and ranked every line.
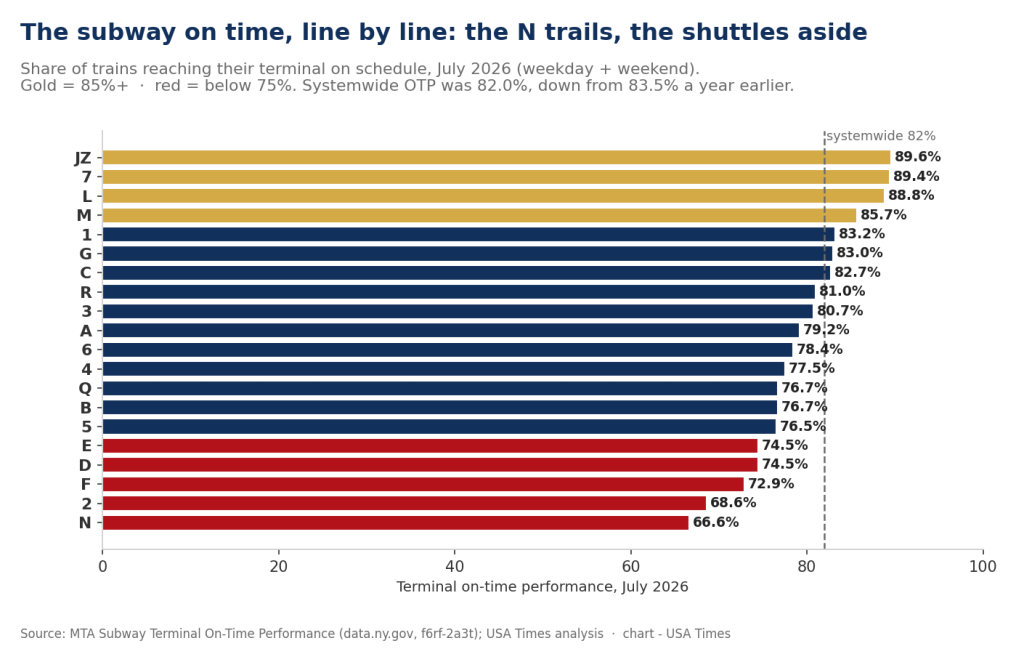
Systemwide, 82.0% of subway trains reached their terminal on time in July 2026. That is a solid figure by the standards of the past decade – but it is down from 83.5% in July 2025, a year-over-year slip of a point and a half. July is always a tough month: summer is peak construction season, and general orders that reroute or slow trains around track work drag the average down. Still, the direction is worth noting after several years of steady improvement, and the line-level detail shows exactly where the slip came from.
Batmandir · Founders A numbered seat at the table. S3 · The Founders Club — 161 seats per location. By invitation. Explore membership →The best: shuttles, then the JZ, 7 and L
The most punctual services are the three shuttles, which is almost cheating: the 42nd Street Shuttle ran at 99.7% and the Franklin Avenue Shuttle at 98.8%, because a two-stop line with a dedicated track has almost nothing to go wrong. Set those aside and the real winners are the JZ (89.6%), the 7 (89.4%) and the L (88.8%). It is not a coincidence that two of those three – the 7 and the L – run on modern communications-based train control (CBTC) signaling, which lets the MTA run trains closer together and recover from disruptions faster. The L has been the poster child for what automated signaling does to reliability, and the numbers still bear it out.
The worst: the N, the 2, and the lettered trunk lines
At the bottom sits the N at 66.6% – the least punctual full line in the system – trailed by the 2 at 68.6%. Just above them, a cluster of long trunk routes that thread the length of Manhattan and beyond: the F (72.9%), the D and E (both 74.5%), the 5 (76.5%) and the B and Q (76.7%). These are the lines that pay the reliability tax of their own geography – the longer and more interlined a route, the more places a single delay can propagate. The N and the 2, in particular, run enormous distances across multiple boroughs with heavy merging, and it shows at the terminal.
The real story is in the swings
The static ranking is interesting; the year-over-year change is where the news is. The systemwide slip was not evenly shared – it was concentrated almost entirely in the numbered IRT lines of the East Side. The 2 fell 10.7 points, the 5 dropped 9.0, the 6 fell 8.6 and the 4 fell 7.2. Those four lines – essentially the Lexington Avenue corridor and its Bronx and Brooklyn branches – accounted for most of the citywide decline on their own. Anyone who rides the 4/5/6 and felt this year got worse was not imagining it.
Against that, a handful of lettered lines moved sharply the other way. The B improved 11.4 points, from a dismal 65.3% to 76.7%; the M gained 5.4, the R gained 4.4 and the C gained 4.3. The divergence is striking: over a single year, the lettered BMT/IND lines broadly got better while the numbered IRT East Side got worse. That is the kind of split that usually traces back to where the year’s major track work was concentrated, and it is the thread we’ll follow as the next monthly releases come in.
| Biggest year-over-year swings | Jul 2025 | Jul 2026 | Change |
|---|---|---|---|
| B (improved most) | 65.3% | 76.7% | +11.4 |
| M | 80.4% | 85.7% | +5.4 |
| R | 76.6% | 81.0% | +4.4 |
| 2 (declined most) | 79.3% | 68.6% | −10.7 |
| 5 | 85.5% | 76.5% | −9.0 |
| 6 | 87.0% | 78.4% | −8.6 |
| 4 | 84.7% | 77.5% | −7.2 |
On-time performance is only one lens on the system. It pairs naturally with the ridership recovery we’ve tracked back toward 2019 levels, and with the congestion-pricing revenue now funding new signals and cars – the very investments, like CBTC on more lines, that the reliability data above suggests pay off. The system that congestion pricing is bankrolling is, line by line, the one measured here.
Weekday and weekend, nearly the same
One thing the July data puts to rest is the idea that weekends are where reliability goes to die. Systemwide, weekday trains ran at 81.9% on-time and weekend trains at 82.3% – essentially identical, with the weekend edging slightly ahead. That is counterintuitive, because weekends are when the MTA does most of its track work and the service changes pile up. The likely explanation is that weekend schedules are built with that work already baked in: fewer trains, longer scheduled running times, more slack. A train can be rerouted and still count as “on time” against a schedule that already assumed the reroute. It is a reminder that on-time performance is measured against the plan, not against the platonic ideal of a Tuesday-morning express.
What terminal OTP does and doesn’t capture
Terminal on-time performance measures one specific thing: the share of trains that reach their final stop within five minutes of schedule without skipping planned stops. It is a good measure of whether service is running as promised, but it is not the same as whether your ride felt good. A train can be “on time” at the terminal and still have left you standing on a crowded platform because the one before it was cancelled, or crawled between stations. That is why the MTA also publishes journey-focused metrics – additional platform time and additional train time – that try to capture the wait and the crawl from the rider’s seat. Read alongside those, terminal OTP is the schedule-keeping backbone of the picture, not the whole picture.
It also helps explain why the best performers are what they are. The 7 and the L, two of the three most punctual full lines, both run on modern communications-based train control (CBTC), which automates train spacing and lets the system recover from a hiccup without cascading delays down the line. The great promise of the capital program now being funded in part by congestion-pricing revenue is more of exactly this: CBTC on the A and C, new signals on the numbered lines, and the open-gangway cars that load and unload faster. If that pipeline delivers, the lines dragging the average down today – the F, the D, the East Side IRT – are precisely the ones where the next round of signal modernization should show up first in this very dataset.
Finally, a word on the shuttles we set aside. The 42nd Street and Franklin Avenue shuttles post on-time numbers near 100% because they are structurally incapable of much lateness: two or three stops, a dedicated track, no merging with other services. Including them in a ranking of “best lines” would be like putting a tricycle in a bike race. The honest comparison is among the full-length lines that actually thread the city, and there the spread – from the JZ’s 89.6% to the N’s 66.6% – is the real measure of how unevenly the system keeps its promises.
The N deserves a closer look as the system’s laggard. It is one of the longest single-service runs in the network, threading from Astoria in Queens, across the whole spine of Manhattan, and down through Brooklyn to Coney Island, sharing tracks and merging with the Q, R and W along the way. Every merge is a place where one late train makes another late, and a line with this many of them accumulates delay the way a long sentence accumulates clauses. The 2, the other cellar-dweller and the biggest year-over-year faller, has the same problem in the IRT: an enormous Bronx-to-Brooklyn run with heavy interlining. Length and merging, more than any single failure, are what separate the system’s punctual short lines from its chronically late long ones.
What we did
We queried the MTA Subway Terminal On-Time Performance dataset (NY State Open Data identifier f6rf-2a3t), which reports, for each line and month, the number of trains arriving at their destination terminal on time and the number scheduled, split by weekday and weekend service. For the latest available month (July 2026) and the same month a year earlier (July 2025), we summed on-time and scheduled trips across both day types for each line and computed on-time performance as on-time divided by scheduled. The systemwide figures are the trip-weighted totals across all lines. “On time” follows the MTA’s terminal definition (arriving within five minutes of schedule at the final stop, and not skipping planned stops). July is a heavy construction month, which typically depresses on-time performance relative to the annual average; we compare like month to like month to control for that.
Sources
- MTA Subway Terminal On-Time Performance: Beginning 2015 (NY State Open Data, f6rf-2a3t)
- MTA: Subway and bus performance dashboards
- USA Times: MTA Subway Ridership Recovery
- USA Times: Congestion Pricing, Six Months In