Editor’s note: this is a working draft. Uber and Lyft have not yet been contacted for comment — that outreach happens before this runs live.
Every ride Uber and Lyft dispatch in New York generates a public record. Under rules the city’s Taxi and Limousine Commission put in place in 2019, both companies must report, trip by trip, what the rider was charged and what the driver was paid. USA Times pulled that data directly from the TLC’s own public files — more than 20 million trips in April 2026 alone, and comparable months going back to February 2019 — to answer a question that’s circulated for years among drivers and in advocacy reports: how much of every fare do the platforms actually keep, and is it really as high as some drivers say?
The short answer, measured the same way an independent 2022 UCLA Labor Center study measured it: the companies’ combined cut of every fare dollar has grown from about 8 percent in 2019 to roughly 23 to 24 percent today. That’s a real and significant increase. It is also considerably smaller, and more evenly distributed, than the “50 to 80 percent on individual rides” figure that has circulated in driver-advocacy literature.

The trend: up sharply, then flat
Averaged across April of each year — a snapshot standardized against seasonal swings — Uber and Lyft’s combined take rate has climbed, then plateaued:
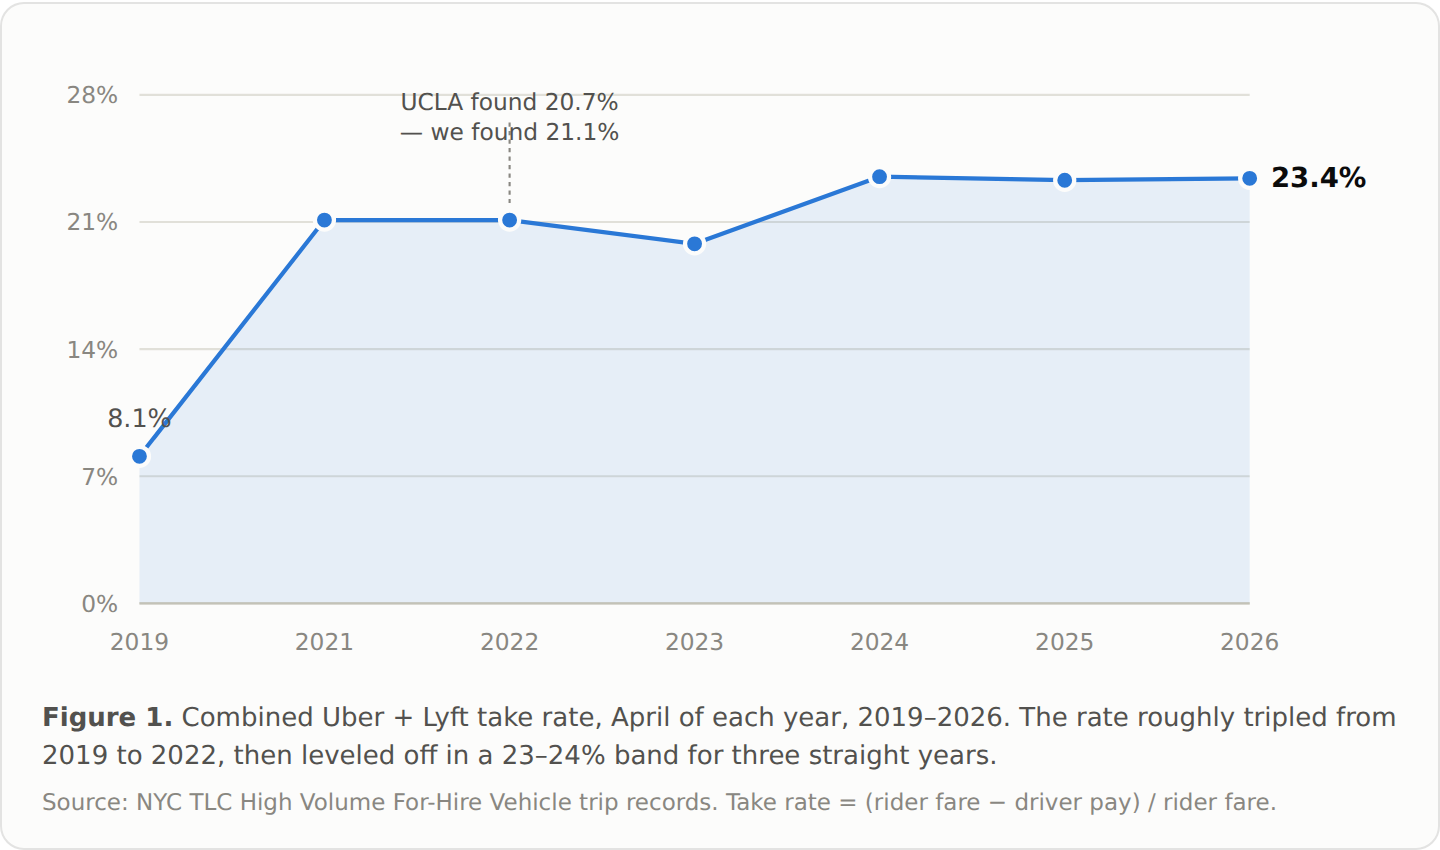
The 2022 figure is worth pausing on: UCLA Labor Center researchers, using a separate sample of about 50 million NYC trips, independently found the take rate had reached 20.7 percent by April 2022. Our figure for the same month, computed from scratch off the city’s public files, came in at 21.1 percent — close enough to treat both studies as measuring the same real thing. What hasn’t been reported before, as far as we could find, is what happened next.
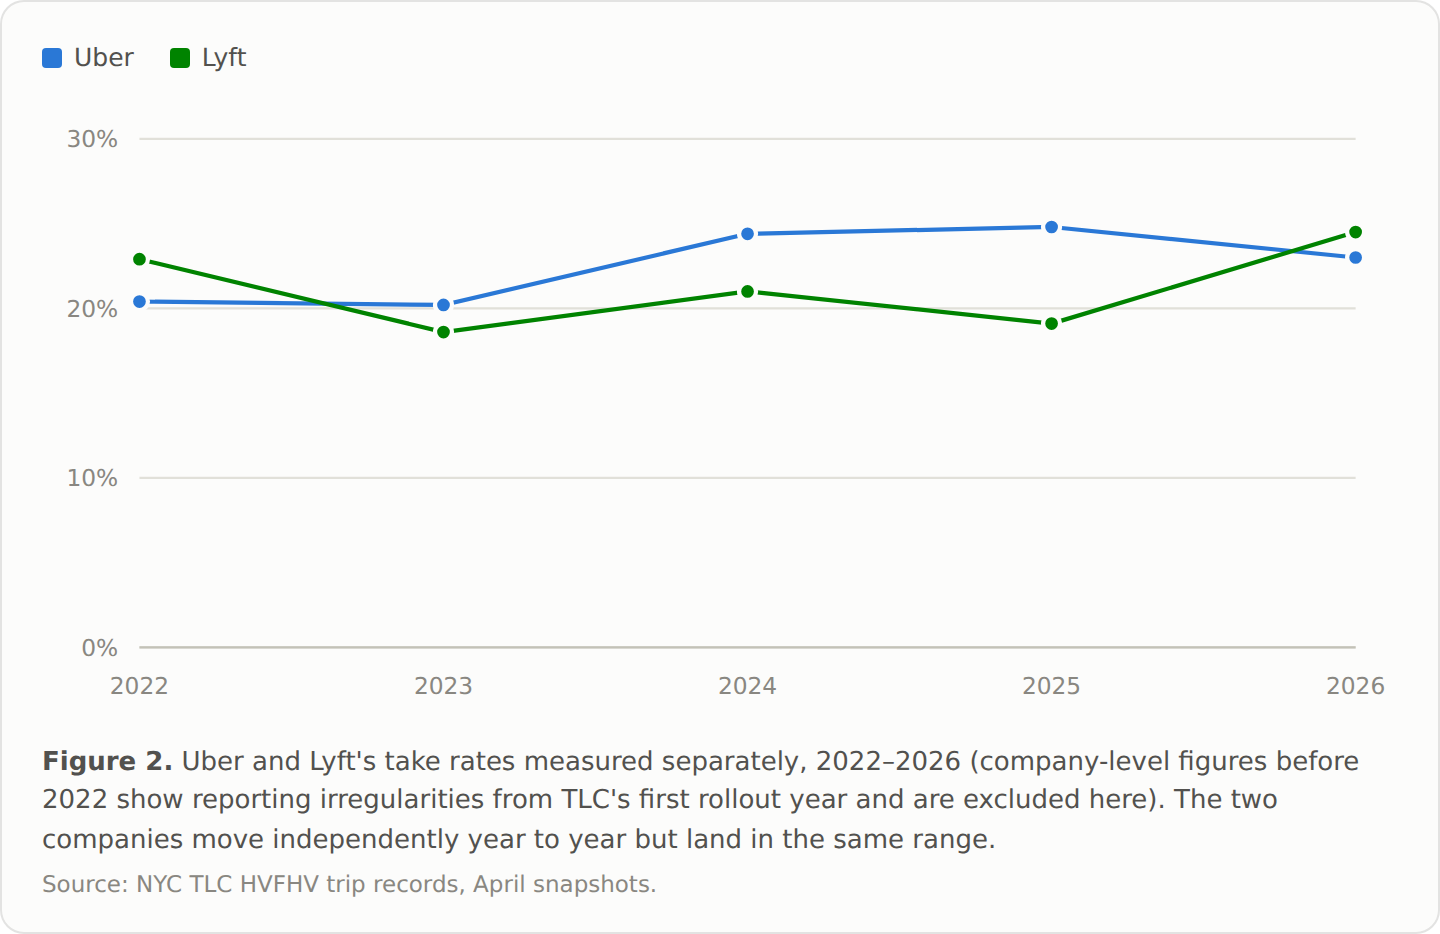
What “individual rides” actually look like
The trend line describes an average. It doesn’t describe any single ride, and that’s where the more dramatic claims about the industry come from — that a platform can keep 50, 65, even 80 percent of a specific fare. Those figures generally trace back to driver surveys and advocacy reports, not to the trip-level city data. We tested the claim directly: the take rate on every individual Uber and Lyft trip in New York in April 2026, more than 20 million rides, plotted as a full distribution rather than an average.
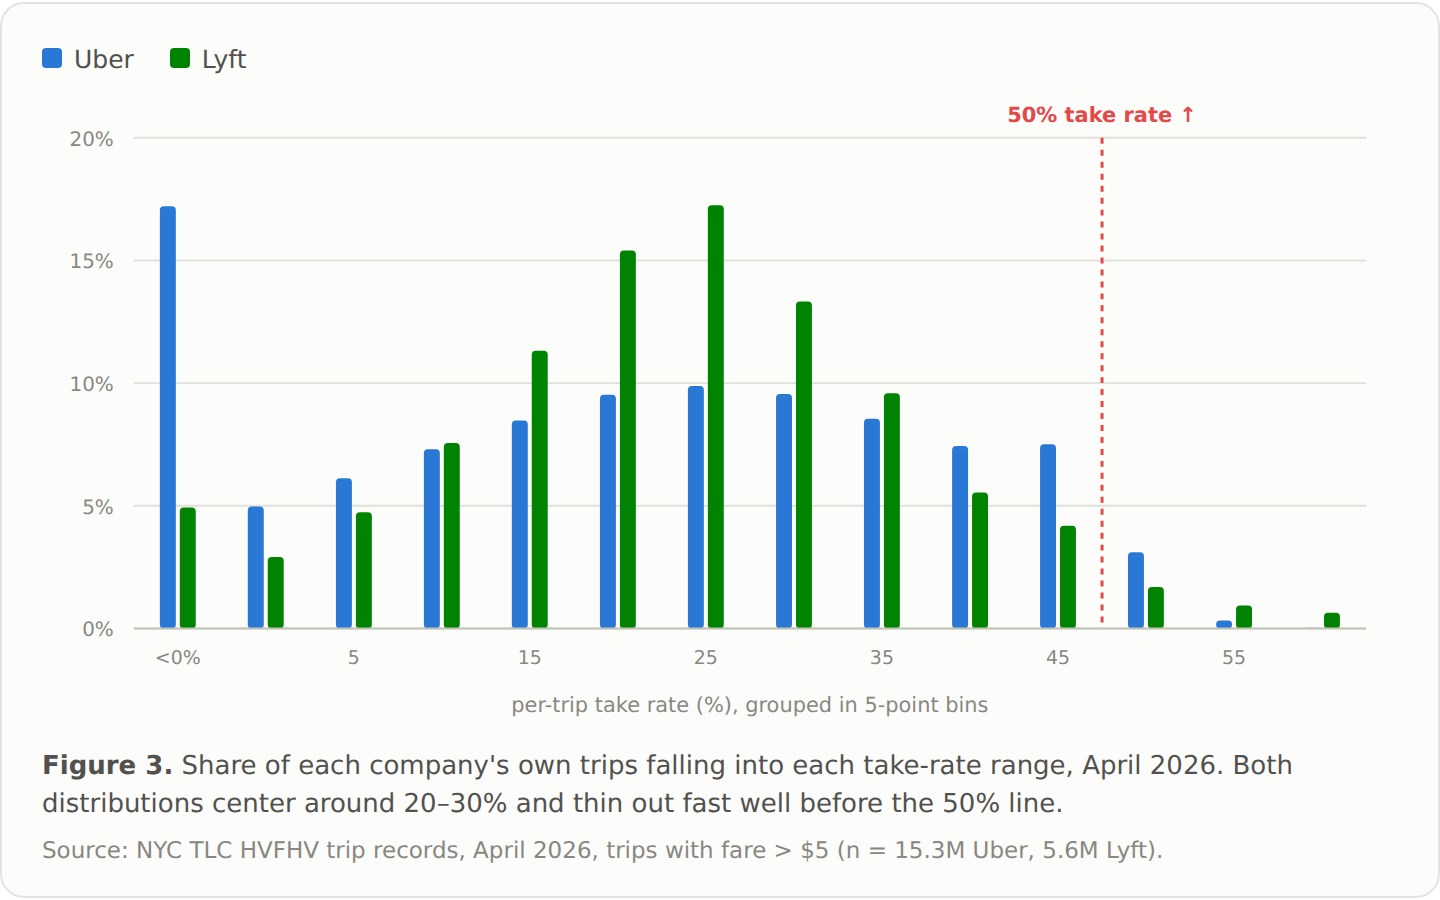
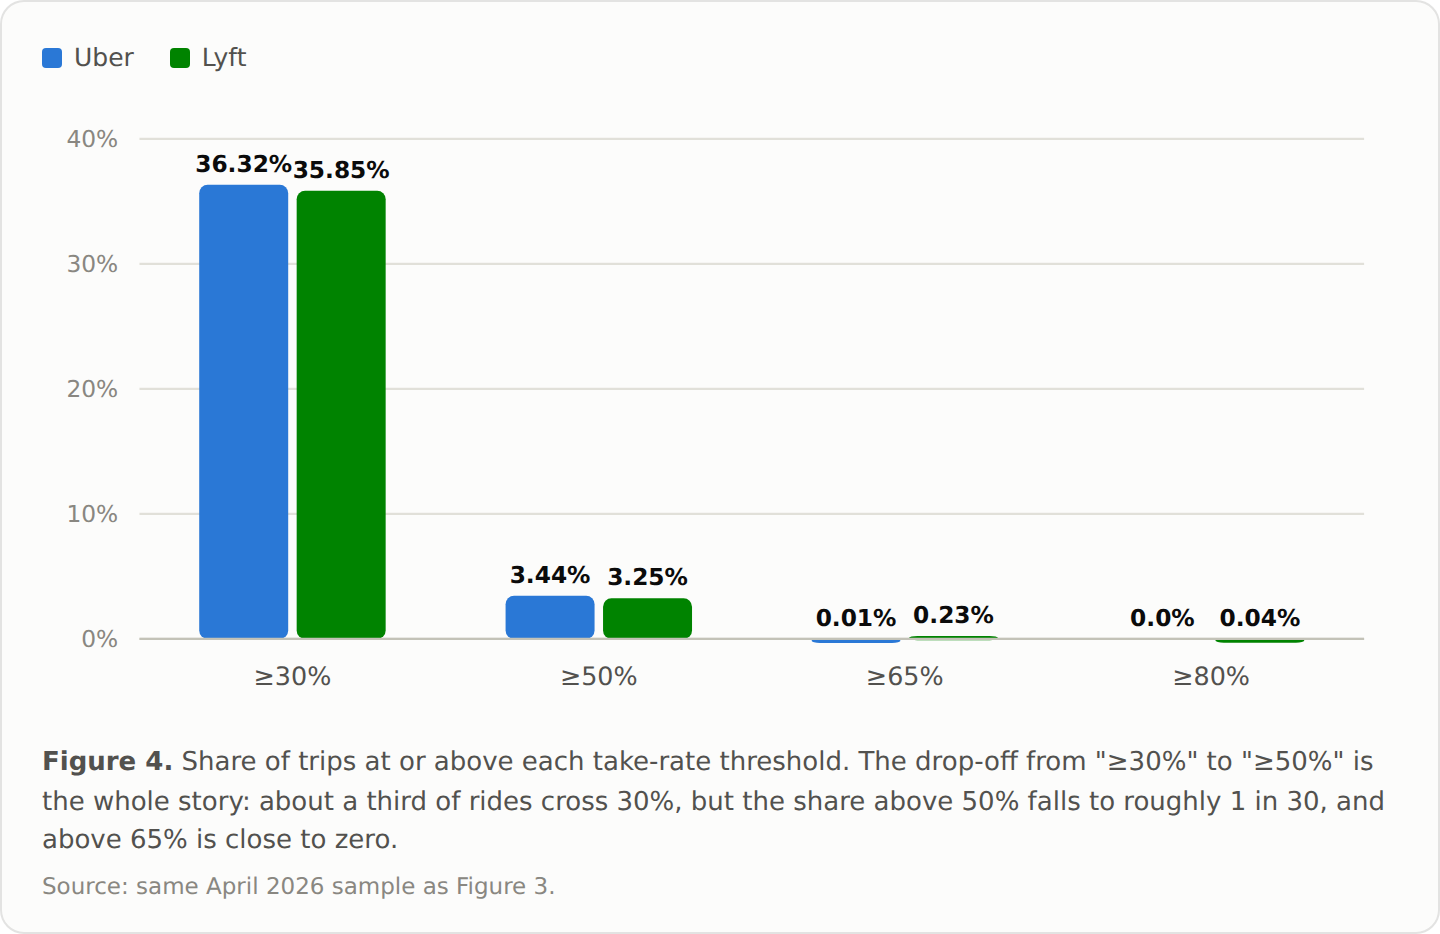
A take rate above 50 percent happens on roughly 1 in 30 rides. Above 65 percent is close to nonexistent.
Show-your-work note: we pulled this from the raw file, not just the aggregate. Ten real Uber trips from 12:00am, April 1, 2026 — the literal first ten of the month meeting the ≥50% filter, no cherry-picking:
| Pickup | Route (zone) | Miles | Minutes | Rider paid | Driver got | Platform kept | Take rate |
|---|---|---|---|---|---|---|---|
| 00:00:02 | 161 → 234 | 1.28 | 7.4 | $17.43 | $8.62 | $8.81 | 50.5% |
| 00:00:04 | 161 → 249 | 2.80 | 11.7 | $28.96 | $13.78 | $15.18 | 52.4% |
| 00:00:04 | 170 → 186 | 1.71 | 9.7 | $21.80 | $10.20 | $11.60 | 53.2% |
| 00:00:06 | 186 → 44 | 31.08 | 40.2 | $157.13 | $77.86 | $79.27 | 50.4% |
| 00:00:07 | 230 → 48 | 0.49 | 2.6 | $13.52 | $6.48 | $7.04 | 52.1% |
| 00:00:07 | 261 → 189 | 3.80 | 15.7 | $39.75 | $19.18 | $20.57 | 51.7% |
| 00:00:29 | 230 → 142 | 1.06 | 4.9 | $14.61 | $6.59 | $8.02 | 54.9% |
| 00:00:39 | 100 → 237 | 1.91 | 9.6 | $24.32 | $11.98 | $12.34 | 50.7% |
| 00:00:41 | 79 → 224 | 0.99 | 4.3 | $9.40 | $4.20 | $5.20 | 55.3% |
| 00:00:42 | 161 → 234 | 1.80 | 8.5 | $27.18 | $12.91 | $14.27 | 52.5% |
In other words: a take rate above 50 percent does happen. A take rate in the 65–80 percent range that’s often cited as typical is, in this data, close to nonexistent. It’s possible some survey- and earnings-based estimates behind that figure are measuring something this trip record doesn’t capture — separate app booking/service fees, or driver take-home after vehicle costs. But as a description of the median individual ride, it doesn’t match what the city’s own records show.
One further wrinkle cuts the other way against a simple “the platforms always take a huge cut” narrative: on 17.4 percent of Uber trips in April 2026, the driver was paid more than the fare the rider was charged. That’s very likely New York’s minimum-pay formula overriding a discounted or promotional fare — meaning on a meaningful share of rides, Uber’s own numbers show it absorbing a loss on the base fare, not extracting one.
A market of two, and the airport skews it further
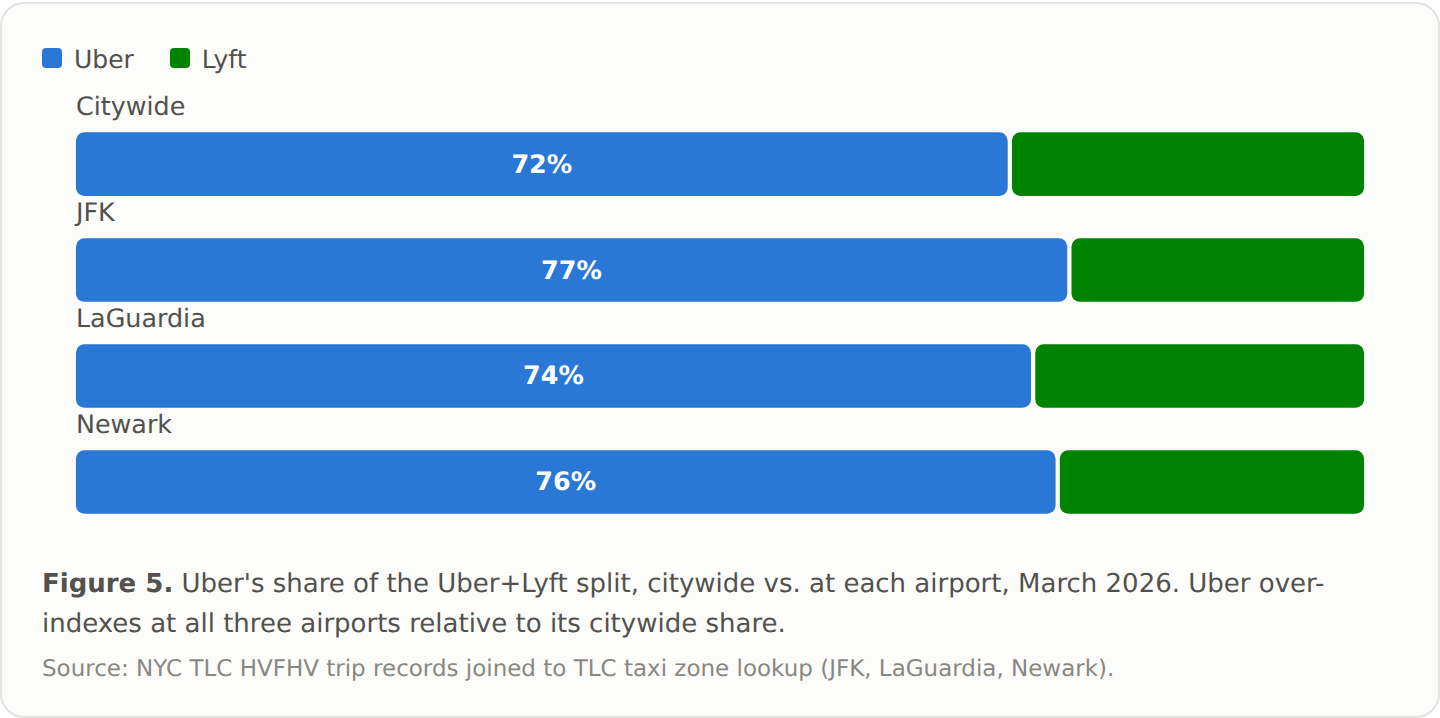
Context for why this matters at all: New York’s ride-hail market isn’t just concentrated, it’s a near-duopoly. Uber and Lyft’s citywide split (72.3% / 27.7%) works out to a Herfindahl-Hirschman Index — the standard antitrust concentration measure — of about 5,970, more than double the federal “highly concentrated” threshold of 2,500. And that concentration isn’t even: Uber’s share runs higher at all three airports than it does citywide.
What this doesn’t show
This data measures margin, not motive, and it measures New York, not the country — other cities don’t have the same disclosure requirement, which is part of why so much of the national conversation about take rates relies on surveys rather than records like these. It also doesn’t address a separate, related question this newsroom is investigating independently: whether either company charges different riders different prices for the identical trip at the identical moment, a practice sometimes called algorithmic or surveillance pricing. That requires a different kind of test — matched, simultaneous price comparisons across accounts — and nothing in this analysis should be read as evidence either way on that question.
What we’re doing next
USA Times has not yet contacted Uber and Lyft for comment on these findings; that outreach is the next step before anything here is finalized. Both companies will be given the opportunity to respond before publication.
USA Times will continue reporting on New York’s ride-hailing market, including a live test of pricing consistency across accounts.
Sources: NYC TLC Trip Record Data · TLC HVFHS Data Dictionary · UCLA Labor Center · NELP