The United States added just 1.8 million people between July 2024 and July 2025 — 0.5% growth, and roughly half the 1.0% growth rate of the year before, according to the Census Bureau’s Vintage 2025 population estimates, released January 27, 2026. It’s the slowest population growth the country has recorded since 2021, when pandemic disruptions briefly dropped growth to 0.2% — but this slowdown has a completely different cause. Births and deaths barely moved. What collapsed was immigration.
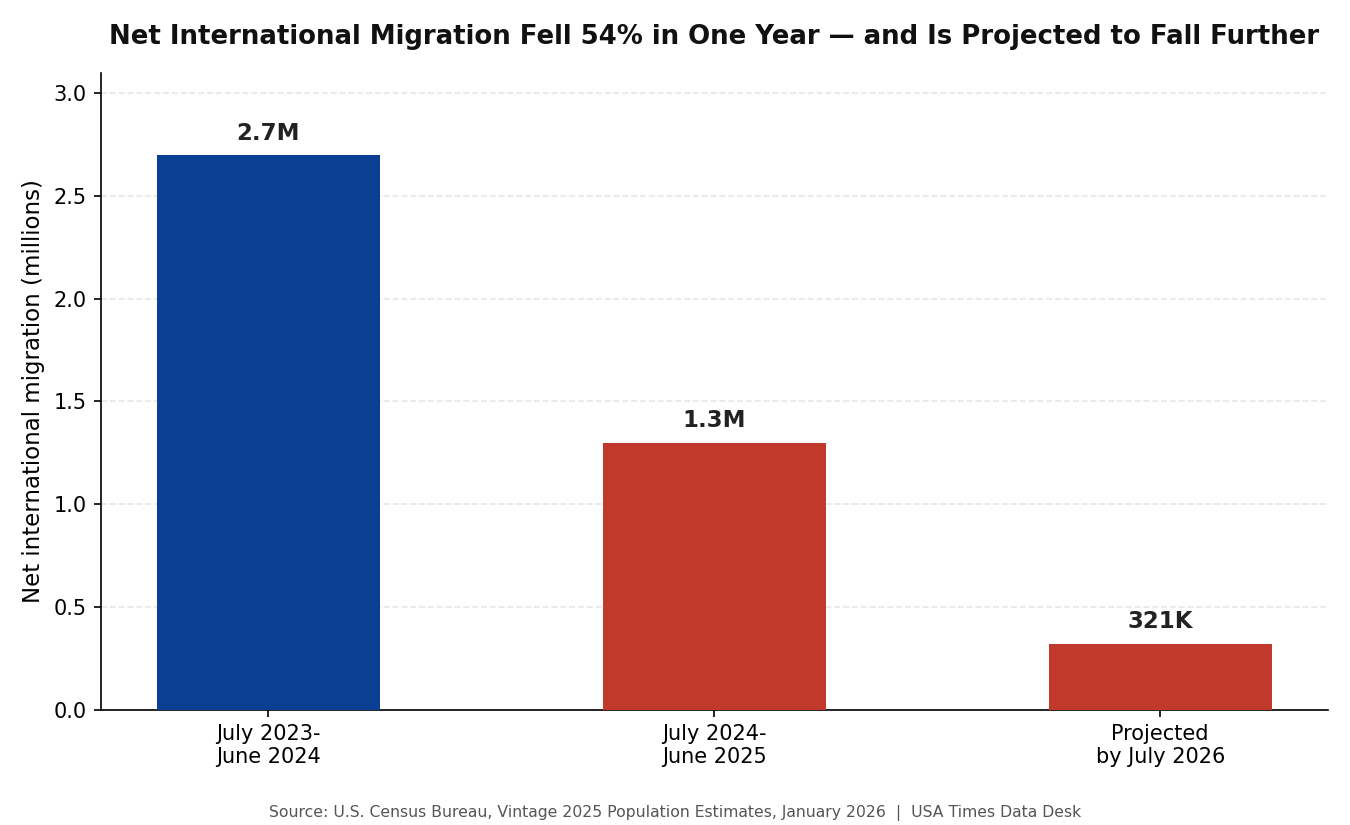
Net international migration — the number of people moving into the U.S. minus those leaving, including both immigration and emigration — fell from 2.7 million in the year ending June 2024 to 1.3 million in the year ending June 2025, a drop of 53.8%. Census Bureau assistant division chief Christine Hartley put it plainly: “With births and deaths remaining relatively stable compared to the prior year, the sharp decline in net international migration is the main reason for the slower growth rate we see today.” The Bureau’s own projection is that the decline isn’t finished — it estimates net international migration will fall to roughly 321,000 by July 2026, another drop of nearly 1 million from the current level.
Five states actually lost population
Population decline hit five states between July 2024 and July 2025: California, Hawaii, New Mexico, Vermont, and West Virginia. California’s loss is particularly notable given the state’s size — it went from 39,364,774 people in mid-2024 to 39,355,309 in mid-2025, a small numeric decline but a symbolically significant one for the nation’s most populous state, which has now recorded population loss in multiple recent years despite still narrowly outranking Texas as the largest state by total population.
Batmandir · The Circle Full access to theatres, museums & exhibitions. S2 · ongoing membership, without a Founder’s seat. Explore membership →Every state except Montana and West Virginia saw its growth rate slow or its decline accelerate compared to the prior year — meaning the national migration slowdown wasn’t concentrated in a handful of places, it touched nearly the entire country simultaneously.
South Carolina, not Texas or Florida, grew the fastest
By percentage growth, South Carolina led the nation at 1.5%, adding 79,958 people — driven overwhelmingly by net domestic migration of 66,622 (Americans moving in from other states, not international immigration). Idaho (1.4%) and North Carolina (1.3%) followed, both also driven primarily by domestic migration. Texas grew 1.2% and added the most people of any state in raw numbers — 391,243 — through a combination of natural change and international migration, even as its international migration gains slowed sharply. Utah, at 1.0% growth, grew mainly from natural change (more births than deaths) rather than migration, since the international migration that had been its single largest growth driver the year before slowed substantially.
Florida’s migration engine has nearly stalled
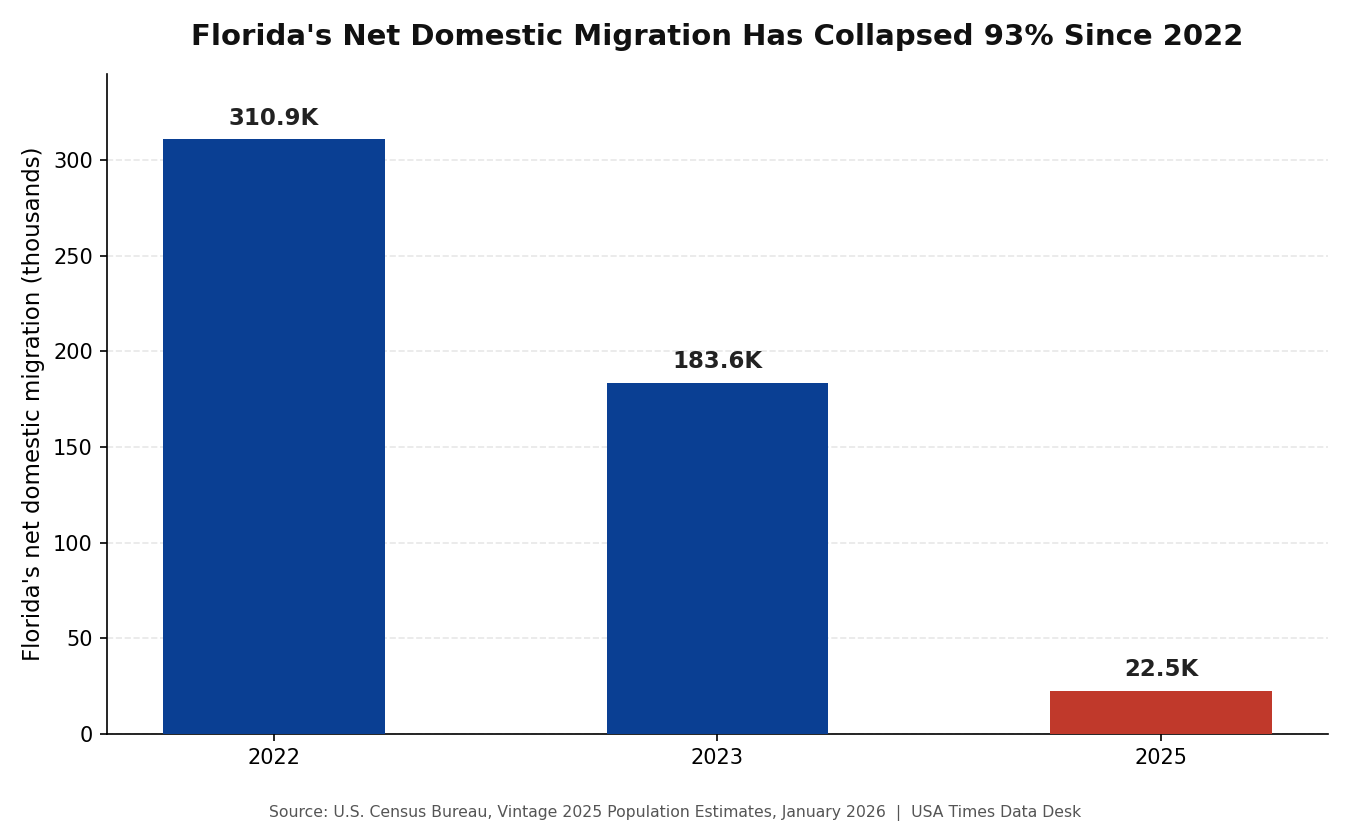
The single most striking state-level number in the release involves Florida, long the country’s top destination for people relocating from other states. Florida’s net domestic migration was 310,892 in 2022 and 183,646 in 2023. By 2025, it had fallen to just 22,517 — a 93% collapse from its 2022 peak. Florida, which has often ranked at or near the very top of all states for domestic migration, ranked just 8th in 2025. Neighboring Alabama, with net domestic migration of 23,358, actually edged out Florida that year — a genuinely unusual result given the two states’ historical population trajectories.
The Midwest is growing again, for the first time this decade
One genuine reversal buried in the regional data: the Midwest recorded positive net domestic migration for the first time this decade, gaining a modest 16,000 people on net — a real turnaround from the region’s losses of -175,000 or worse in 2021 and 2022. Census demographer Marc Perry singled out Ohio (net domestic migration of 11,926 in 2025, compared to -32,482 in 2021) and Michigan (1,796 in 2025, versus -28,290 in 2021) as the clearest examples of the shift. The Midwest was also the only region where every single state gained population between 2024 and 2025.
Regionally, the South’s growth rate dropped below 1.0% for the first time since 2021, falling from 1.4% growth in the prior year to 0.9%. The Northeast recorded the sharpest regional deceleration of all, falling from 0.8% growth to just 0.2%.
Immigration still isn’t negative anywhere
It’s worth being precise about what this data does and doesn’t show. Net international migration slowed sharply everywhere, but it remained positive in every state and the District of Columbia — no state actually lost population to net outward international migration. Florida (178,674), Texas (167,475), California (109,278), and New York (95,634) still recorded the largest absolute levels of net international migration in the country, even with the nationwide slowdown factored in. The story here is a slowing rate of international arrivals relative to departures, not a reversal into net emigration.
Births minus deaths: the quieter long-term story
Migration gets the headline in this release, but “natural change” — births minus deaths — has its own decades-long downward trend running underneath it. Natural change for the nation was roughly 519,000 in the year ending June 2025, essentially flat compared to the prior year. That number sounds stable in isolation, but it’s a fraction of what it used to be: natural change ran about 1.1 million as recently as 2017, and between 1.6 million and 1.9 million annually during the 2000-to-2010 decade. Thirty-three states plus DC had positive natural change in the latest data, up slightly from 32 the year before, but still well down from the 2000s-era norm of nearly every state adding more births than deaths each year.
Put together, the two trends compound rather than offset each other: a long-running decline in natural population increase, now paired with a sudden, sharp drop in the immigration that had been increasingly carrying total U.S. population growth in recent years. That combination is what produced the slowest growth rate since the pandemic — not a single cause, but two long- and short-term trends arriving at the same time.
What we did
All figures in this piece — the national growth rate and totals, the net international and domestic migration figures, the state-level population, growth-rate, and migration statistics, the regional breakdowns, and the quoted Census Bureau staff statements — come directly from the U.S. Census Bureau’s press release “U.S. Population Growth Slows Due to Historic Decline in Net International Migration” (release number CB26-20), published January 27, 2026, and its accompanying Vintage 2025 Population Estimates data tables, both read directly from census.gov. The projected 321,000 net international migration figure for the period ending July 2026 is the Census Bureau’s own stated projection based on current trends, not a figure USA Times calculated independently, and the Bureau notes it could change if migration patterns shift.