- ≥ 26.18% of the U.S. (domestic) box office that week, or
- ≥ 6.18% of the global box office that week.
- Geuse — 61.8%+ of the week
- Betelgeuse — 38.2%–61.8%
- Mini-geuse — 26.18%–38.2%
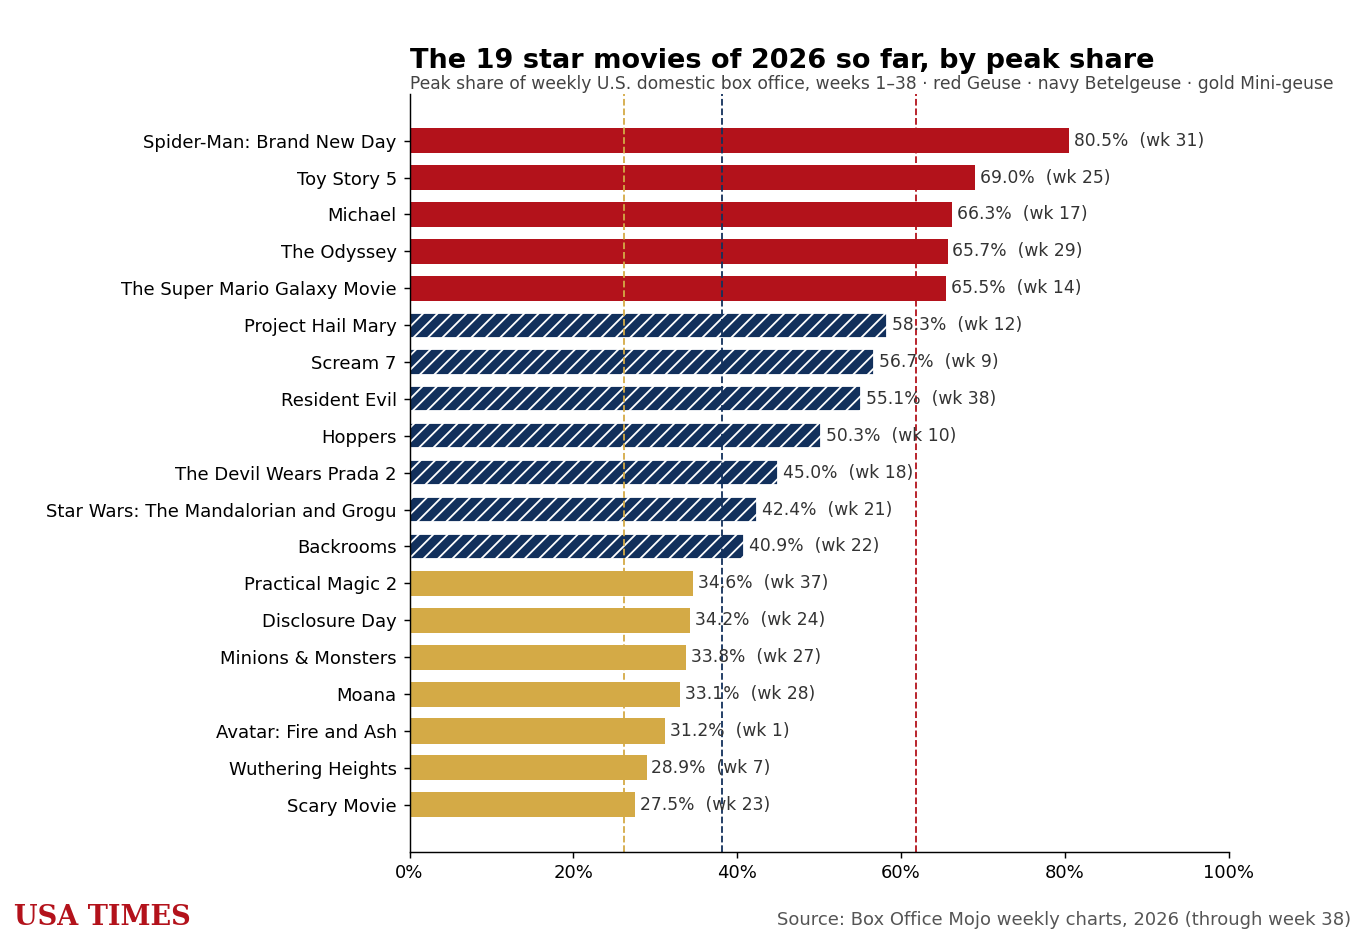
This is the living 2026 ledger, built on the same USA Times Star Index as our 2024 and 2025 editions: the No. 1 film’s share of the week’s entire U.S. box office, week by week. It updates automatically as each new week closes. Through week 38 (Sep 24), 19 films have owned at least one week of 2026 — including five outright Geuses, led by Spider-Man: Brand New Day, which took a staggering $510 million in a single week for an 80.5% share of the entire domestic box office — the biggest owned week of the year so far. The newest arrival: Resident Evil, Zach Cregger’s reboot, opened at No. 1 with a 55.1% share in week 38.
The three star statuses — set by the golden ratio
| Tier | Weekly share | 2026 so far |
|---|---|---|
| Geuse | 61.8%+ | 5 |
| Betelgeuse | 38.2–61.8% | 7 |
| Mini-geuse | 26.18–38.2% | 7 |
The star movies of 2026, so far
Worldwide grosses via Box Office Mojo; budgets are reported estimates. Ratios for titles still in release will keep climbing; a dash means no reliable budget estimate has been published.
| # | Film | Peak share | Tier | WW ÷ budget |
|---|---|---|---|---|
| 1 | Spider-Man: Brand New Day | 80.5% | Geuse | 11.1× ▲ in release |
| 2 | Toy Story 5 | 69.0% | Geuse | 4.2× ▲ in release |
| 3 | Michael | 66.3% | Geuse | — |
| 4 | The Odyssey | 65.7% | Geuse | 7.0× ▲ in release |
| 5 | The Super Mario Galaxy Movie | 65.5% | Geuse | — |
| 6 | Project Hail Mary | 58.3% | Betelgeuse | — |
| 7 | Scream 7 | 56.7% | Betelgeuse | — |
| 8 | Resident Evil | 55.1% | Betelgeuse | 2.6× ▲ in release |
| 9 | Hoppers | 50.3% | Betelgeuse | — |
| 10 | The Devil Wears Prada 2 | 45.0% | Betelgeuse | — |
| 11 | Star Wars: The Mandalorian and Grogu | 42.4% | Betelgeuse | — |
| 12 | Backrooms | 40.9% | Betelgeuse | 40.2× ▲ |
| 13 | Practical Magic 2 | 34.6% | Mini-geuse | 1.2× ▲ in release |
| 14 | Disclosure Day | 34.2% | Mini-geuse | — |
| 15 | Minions & Monsters | 33.8% | Mini-geuse | 6.2× ▲ |
| 16 | Moana | 33.1% | Mini-geuse | 1.3× ▲ in release |
| 17 | Avatar: Fire and Ash | 31.2% | Mini-geuse | 5.9× ▲ |
| 18 | Wuthering Heights | 28.9% | Mini-geuse | — |
| 19 | Scary Movie | 27.5% | Mini-geuse | 7.7× ▲ |
The longest-running stars of 2026, so far
Peak share tells you how high a film climbed; staying power tells you how long it reigned. Weeks in star status, split by status:
Batmandir · Founders A numbered seat at the table. S3 · The Founders Club — 161 seats per location. By invitation. Explore membership →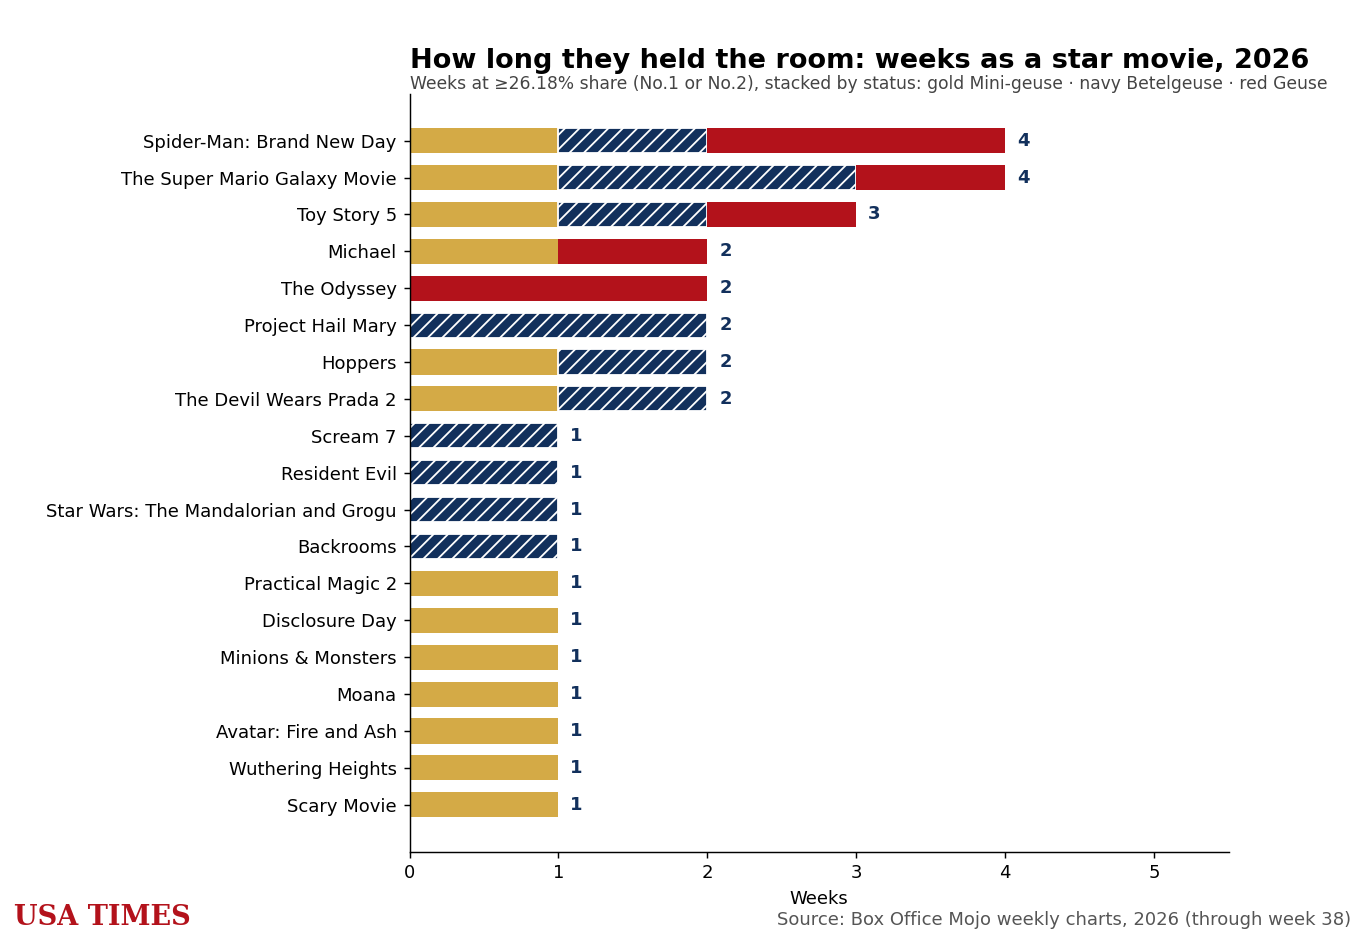
- Spider-Man: Brand New Day — 4 weeks in star status (2 as Geuses), peak 80.5%.
- The Super Mario Galaxy Movie — 4 weeks in star status (1 as a Geuse), peak 65.5%.
- Toy Story 5 — 3 weeks in star status (1 as a Geuse), peak 69.0%.
- Michael — 2 weeks in star status (1 as a Geuse), peak 66.3%.
- The Odyssey — 2 weeks in star status (2 as Geuses), peak 65.7%.
- Project Hail Mary — 2 weeks in star status, peak 58.3%.
- Hoppers — 2 weeks in star status, peak 50.3%.
- The Devil Wears Prada 2 — 2 weeks in star status, peak 45.0%.
So far, 11 of the 19 owned exactly one week — the one-week wonders.
Week by week: the 2026 index
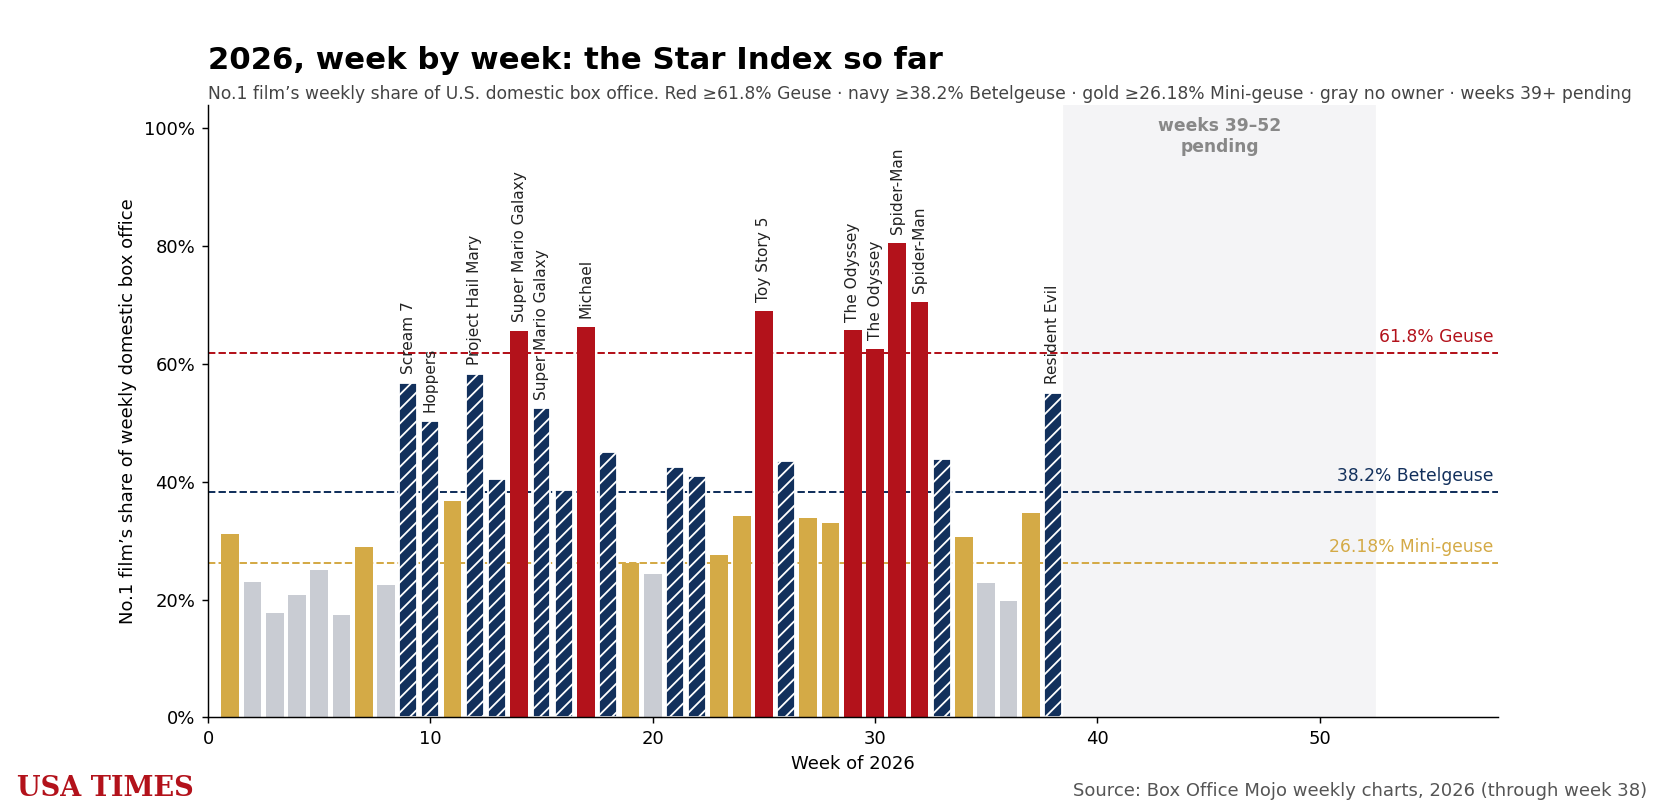
| Wk | Week starting | Who owned the week | Share | U.S. total |
|---|---|---|---|---|
| 1 | 2026-01-02 | Avatar: Fire and Ash | 31.2% | $176M |
| 2 | 2026-01-09 | No owner | 23.1% | $125M |
| 3 | 2026-01-16 | No owner | 17.8% | $120M |
| 4 | 2026-01-23 | No owner | 20.7% | $71M |
| 5 | 2026-01-30 | No owner | 24.9% | $104M |
| 6 | 2026-02-06 | No owner | 17.3% | $76M |
| 7 | 2026-02-13 | Wuthering Heights | 28.9% | $158M |
| 8 | 2026-02-20 | No owner | 22.4% | $92M |
| 9 | 2026-02-27 | Scream 7 | 56.7% | $134M |
| 10 | 2026-03-06 | Hoppers | 50.3% | $116M |
| 11 | 2026-03-13 | Hoppers | 36.8% | $120M |
| 12 | 2026-03-20 | Project Hail Mary | 58.3% | $188M |
| 13 | 2026-03-27 | Project Hail Mary + The Super Mario Galaxy Movie 31.1% | 40.4% | $190M |
| 14 | 2026-04-03 | The Super Mario Galaxy Movie | 65.5% | $275M |
| 15 | 2026-04-10 | The Super Mario Galaxy Movie | 52.4% | $155M |
| 16 | 2026-04-17 | The Super Mario Galaxy Movie | 38.6% | $117M |
| 17 | 2026-04-24 | Michael | 66.3% | $196M |
| 18 | 2026-05-01 | The Devil Wears Prada 2 + Michael 32.8% | 45.0% | $226M |
| 19 | 2026-05-08 | The Devil Wears Prada 2 | 26.3% | $213M |
| 20 | 2026-05-15 | No owner | 24.3% | $145M |
| 21 | 2026-05-22 | Star Wars: The Mandalorian and Grogu | 42.4% | $256M |
| 22 | 2026-05-29 | Backrooms | 40.9% | $267M |
| 23 | 2026-06-05 | Scary Movie | 27.5% | $255M |
| 24 | 2026-06-12 | Disclosure Day | 34.2% | $179M |
| 25 | 2026-06-19 | Toy Story 5 | 69.0% | $329M |
| 26 | 2026-06-26 | Toy Story 5 | 43.6% | $248M |
| 27 | 2026-07-03 | Minions & Monsters + Toy Story 5 26.9% | 33.8% | $185M |
| 28 | 2026-07-10 | Moana | 33.1% | $191M |
| 29 | 2026-07-17 | The Odyssey | 65.7% | $303M |
| 30 | 2026-07-24 | The Odyssey | 62.5% | $232M |
| 31 | 2026-07-31 | Spider-Man: Brand New Day | 80.5% | $634M |
| 32 | 2026-08-07 | Spider-Man: Brand New Day | 70.6% | $292M |
| 33 | 2026-08-14 | Spider-Man: Brand New Day | 43.9% | $228M |
| 34 | 2026-08-21 | Spider-Man: Brand New Day | 30.6% | $175M |
| 35 | 2026-08-28 | No owner | 22.7% | $134M |
| 36 | 2026-09-04 | No owner | 19.8% | $136M |
| 37 | 2026-09-11 | Practical Magic 2 | 34.6% | $109M |
| 38 | 2026-09-18 | Resident Evil | 55.1% | $146M |
All 38 closed weeks are filled; week 39 (Sep 25–Oct 1) is still open and fills in once it closes. Weekly total = sum of all films grossing ≥ $1M that week per Box Office Mojo. Red-shaded = Geuse; blue = Betelgeuse; gray = no owner; “+” = a second film also cleared 26.18%.
Never four in a week
2026 has now produced three two-owner weeks — Project Hail Mary and The Super Mario Galaxy Movie overlapped in late March; The Devil Wears Prada 2 and Michael split a huge May week; and Minions & Monsters and Toy Story 5 shared the July 4 week, with Toy Story clearing the bar at 26.9% on its third week out. (Wuthering Heights and GOAT opened head-to-head in February, but GOAT topped out at 26.09% — just under the bar.) But as ever: never three at once, never four. Four films clearing 26.18% would require more than 100% of a single week.
Where the star weeks cluster
Owned weeks are not spread evenly across the calendar. Star-weeks by month in 2026: Jan 1, Feb 1, Mar 5, Apr 4, May 4, Jun 4, Jul 5, Aug 3, Sep 2, Oct 0, Nov 0, Dec 0. With the back-filled late-spring and summer weeks now in, the summer tent-pole run shows up clearly — the pattern our 20-year index is built to test.
How we build this
Each week we divide the No. 1 film’s weekly domestic gross by that week’s total domestic box office (the sum of all films grossing ≥ $1M, per Box Office Mojo’s weekly chart), and check No. 2 for two-owner weeks. A film is a star movie if its share reaches 26.18% in any week; its tier is set by its peak. This page refreshes weekly and back-fills any pending weeks as the data posts.
Sources: Box Office Mojo weekly domestic charts (2026) and Box Office Mojo worldwide grosses; production budgets are reported estimates. Method: USA Times Star Index. See also the USA Times definition of a star movie.
2006–2023 open in the 20-year index.
Related from the USA Times Data Desk
- The Star Movies of 2024: Every Film That Took Over a Week at the Box Office
- Since 1940: Every Year's Biggest Indian Film — and the Budget Boom That Changed the Math
- The Star Movies of Indian Cinema, 2025: Dhamaka, Toofan, Tsunami
- Wikipedia Credits a 1982 Bollywood Film With Nearly Double Sholay's Gross. Its Citations Are About Completely Different Movies.
- Box-office coverage index · the Star Index methodology
Sources
- Box Office Mojo — Weekend Domestic Box Office
- Box Office Mojo — Yearly Domestic Box Office
- The Numbers — Weekly Box Office Chart
- USA Times — Star Index methodology & data sources