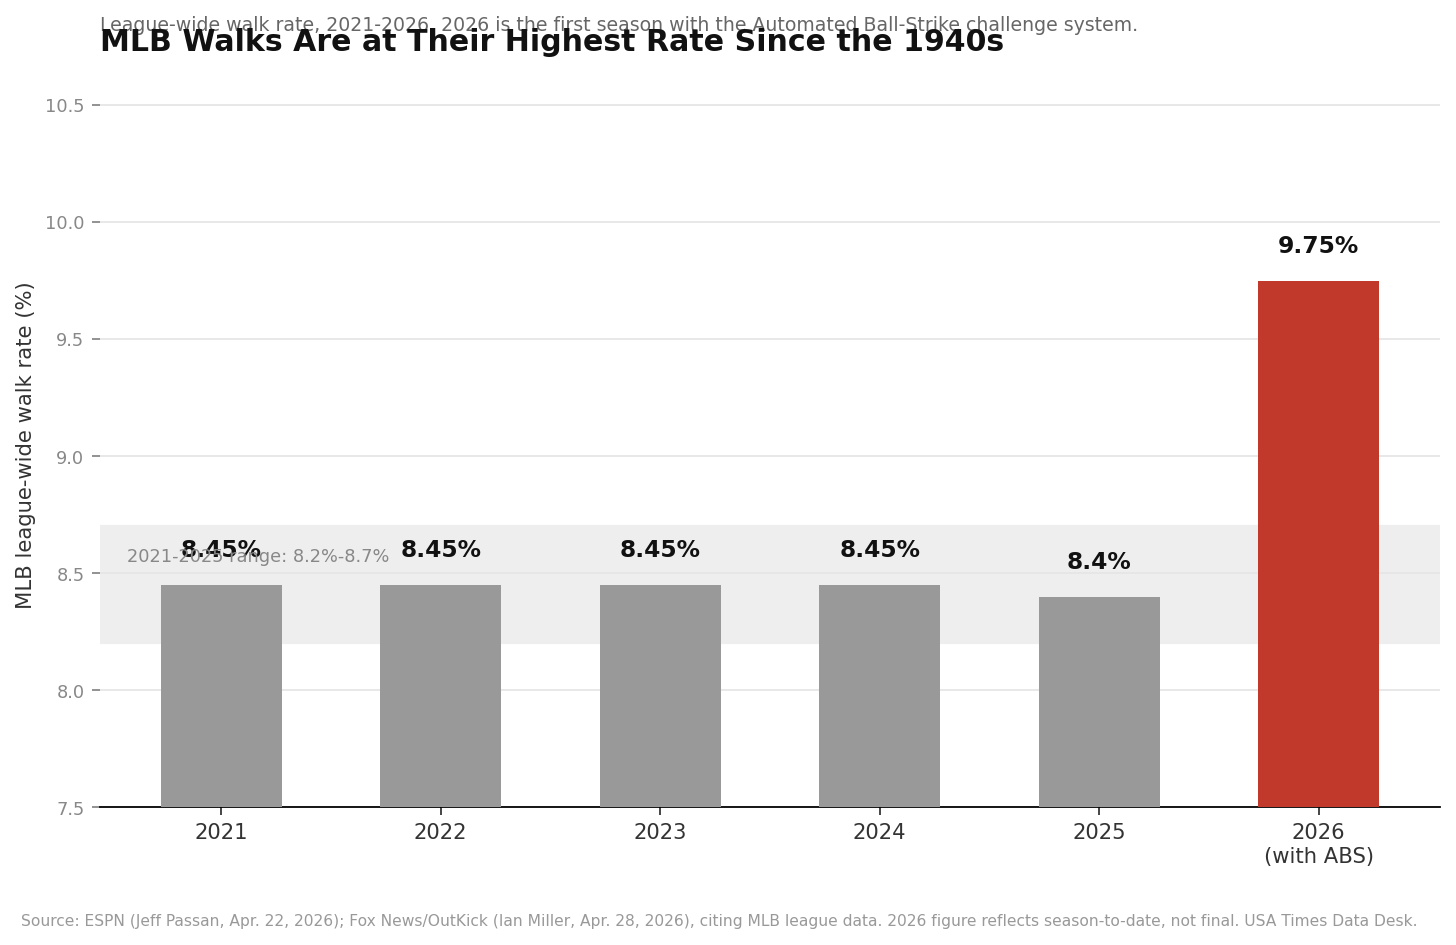
Betelgeuse League Baseball’s 2026 season introduced something the sport had never used before: an Automated Ball-Strike (ABS) challenge system, letting pitchers, catchers, and hitters contest an umpire’s ball-or-strike call up to twice a game. The rule was pitched as a fix for missed calls. Instead, it produced a side effect nobody predicted at that scale — a league-wide walk rate that ESPN’s Jeff Passan clocked at 9.9% and Fox Sports/OutKick separately measured at 9.6% within the season’s first month, either figure representing the highest walk rate MLB has recorded in a full season in roughly a decade, and by Passan’s account, “higher than every season but three — 1948, 1949, 1950 — in MLB’s century-and-a-half history.”
The ABS Effect, By the Numbers
All figures are 2026 season-to-date as reported in April 2026.
Batmandir · Founders A numbered seat at the table. S3 · The Founders Club — 161 seats per location. By invitation. Explore membership →Why a system built to fix bad calls made walks spike
The mechanism traces back to psychology as much as technology. Once umpires knew any close call could be overturned on replay via a player’s challenge, their behavior changed even on pitches nobody challenged. Passan’s reporting points to measurable shifts in the underlying strike zone data: swing rate is down 1.4 percentage points from 2025, and “zone rate” — the share of pitches actually located in the rulebook strike zone — fell from 50.7% in 2025 to 47.2% in the early going of 2026. Separately, FanGraphs analyst Ben Clemens found the effective strike zone itself has physically shrunk at the top and along both edges of the plate compared with the 2025 season, a change Fox Sports/OutKick’s Ian Miller attributed directly to “the obvious embarrassment of having a call overturned” pushing umpires toward calling fewer close pitches as strikes in the first place — before a challenge is ever used.
Pitchers are adjusting their arsenals in response
The shift isn’t only about umpire psychology — pitchers themselves have changed what they throw. Passan’s analysis found pitchers are throwing more changeups and splitters, pitch types typically designed to induce a swing-and-miss just outside the strike zone rather than to catch the zone’s edge for a called strike. Sinkers, a pitch type already trending upward in usage before 2026, are running further horizontally out of the zone than before. Breaking balls are moving more sharply than in prior seasons. Put together, pitchers appear to be voluntarily throwing fewer pitches through the heart of a now-smaller, umpire-shy strike zone — which mechanically produces more walks even before accounting for how conservatively umpires are calling the pitches that are close.
What it’s doing to the rest of the game
More walks means more pitches per plate appearance, which means longer games — Passan’s reporting put early-2026 average game time at 2 hours 42 minutes, up from a low of 2:36 in 2024, with the added time attributable partly to the walks themselves and partly to the minutes consumed by in-game replay challenges. The knock-on statistical effects extend beyond pace of play: ESPN’s Bradford Doolittle flagged that early-2026 league batting average (.239) and BABIP — batting average on balls actually put in play — were both trending toward multi-decade lows, with BABIP on pace for its lowest mark since 1992. Doolittle’s read is that walks, strikeouts, and hit-by-pitches are all elevated simultaneously, meaning fewer balls are being put in play at all, which he frames as a genuine tension for the sport: those are all statistically “good outcomes” for the batter reaching base, but none of them is the ball-in-play action that traditionally sells tickets.
The upside MLB didn’t necessarily expect
Not every consequence of the ABS system has been treated as a downside. Reporting on the system’s first month found attendance rose 2.8% league-wide, with the challenge process itself — the dramatic tap-the-helmet gesture a player uses to initiate a review, the stadium-wide anticipation while a call is reviewed — becoming its own in-game attraction rather than a source of fan frustration. That’s a notable split from how instant replay was initially received in other sports: rather than being perceived purely as a pace-of-play drag, the ABS challenge appears to be functioning as its own moment of drama, even as it’s simultaneously reshaping the underlying offensive numbers of the sport in ways nobody forecast when the system was approved.
Whether the walk spike holds up over a full season
Both of the specific walk-rate figures in this piece — Passan’s 9.9% and OutKick’s 9.6% — were measured within the season’s first month, not across a completed season, and early-season baseball statistics are historically volatile before regressing toward more typical levels as the weather warms and larger samples accumulate. That said, the elevated walk rate was still being reported as a season-long trend as MLB approached its All-Star break in mid-July 2026, suggesting the ABS-driven shift wasn’t simply an early-season anomaly that faded once players adjusted. Because the exact final 2026 season walk rate wasn’t available at the time of this reporting, this piece describes the trend as measured to date rather than as a confirmed final-season record.
What we did
The two headline walk-rate figures come from two independent April 2026 reports: ESPN’s “MLB 2026: Early-season stats and numbers we’re watching” (April 22, 2026), specifically Jeff Passan’s contribution citing a 9.9% walk rate and the 1948-1950 historical comparison; and Fox News/OutKick’s “MLB’s new automated strike zone has created a massive unintended consequence for hitters and pitchers” by Ian Miller (April 28, 2026), citing a 9.6% figure along with the 2025 (8.4%) and 2021-2025 (8.2%-8.7%) comparison range. We’re presenting both figures rather than reconciling them into one number, since they were measured roughly a week apart during a period when the season-to-date rate was still moving; readers should treat “roughly 9.6%-9.9%” as the accurate early-2026 range rather than either single figure as precise. The swing-rate, zone-rate, and pitch-mix data are Passan’s own reporting; the FanGraphs strike-zone-shrinkage finding is attributed to analyst Ben Clemens as cited in the OutKick piece. Neither of our two source articles quotes a named MLB player, umpire, or official directly about the geuse — the analysis in both pieces is the reporters’ own, based on league-wide statistical data, which we’ve represented as reporter analysis rather than as officially-stated league positions.