New York City posts a letter grade — A, B, or C — in the window of every restaurant it inspects, based on a points system tallying health-code violations. Citywide, about 76% of graded inspections result in an A. But that average hides a wide, consistent gap once you break it down by cuisine type, and the pattern isn’t random.
We pulled the full DOHMH restaurant inspection dataset from NYC Open Data directly and calculated the A-grade rate for every cuisine category with at least 500 graded inspections on record, to keep small, noisy categories out of the comparison.
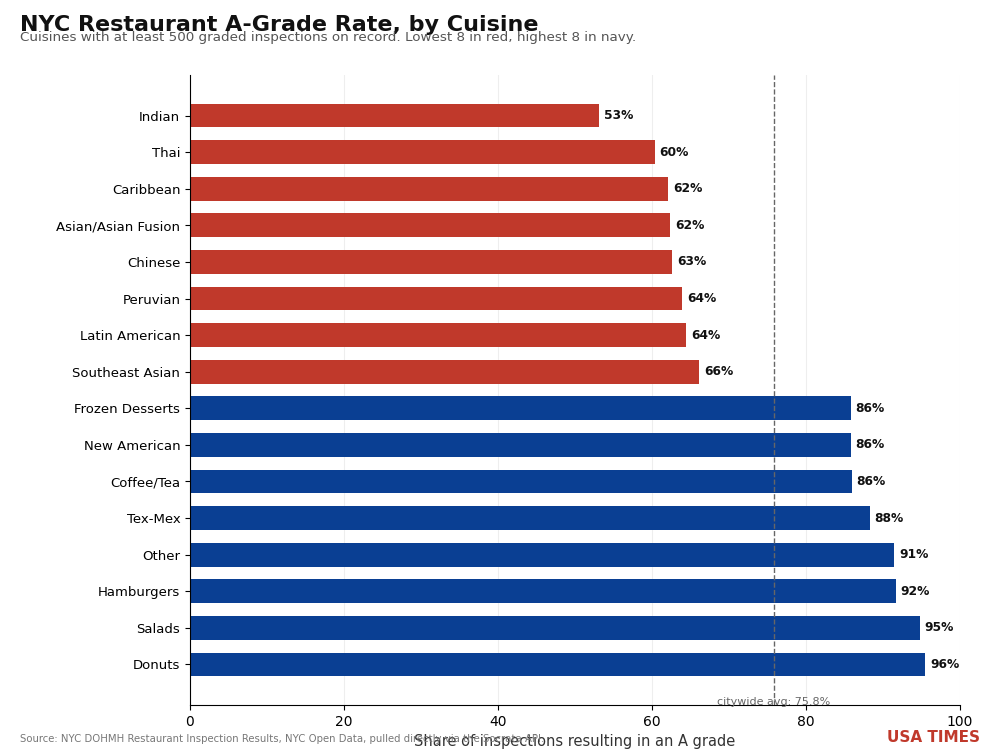
NYC Restaurant A-Grade Rate, by Cuisine
Batmandir · Guest Passes Step inside for a day. Guest passes from $161/day — brought in by a member. See guest passes →Cuisines with 500+ graded inspections on record. Dashed line = citywide average (75.8%). Hover any row for the sample size.
The gap, in plain numbers
At the bottom: Indian restaurants earn an A grade in just 53.1% of inspections — the lowest of any major cuisine category, and 23 points below the citywide average. Thai (60.4%), Caribbean (62.1%), Asian/Asian Fusion (62.4%), Chinese (62.6%), and Peruvian (64.0%) round out the lowest group. At the top: donut shops earn an A grade 95.5% of the time, followed by salad chains (94.8%), hamburger restaurants (91.7%), and coffee and tea shops (86.0%).
That’s not a small or borderline gap. The distance between the lowest cuisine category (Indian, 53%) and the highest (Donuts, 96%) is 42 percentage points — meaning a donut shop is roughly twice as likely to pass with an A as an Indian restaurant is.
Two real explanations, and they’re not the same thing
It would be a mistake to read this pattern as a food-safety ranking of cuisines, and published research on the subject points to two distinct causes that deserve separate treatment rather than being collapsed into one story.
The first is structural and largely explains the high end of the chart: the top-performing categories — donuts, salads, hamburgers, coffee/tea — are dominated by standardized, often chain-operated formats with simple, repeatable food-prep processes, dedicated corporate compliance training, and fewer of the high-heat, multi-station cooking setups that create more opportunities for a violation. A peer-reviewed study published in Annals of Global Health examining South Asian restaurants specifically found that traditional cooking equipment — citing tandoor and kiln ovens used for breads like chapati and roti — creates distinct workplace conditions and violation risks that a standardized fast-casual kitchen simply doesn’t have to manage.
The second cause is not structural, and it’s the more uncomfortable one: documented inspector bias. A study published in the peer-reviewed journal covering health inspector ratings during the early COVID-19 pandemic found that Asian restaurants were the only cuisine category to see a disproportionate increase in citations in January and February of 2020 — before New York recorded significant community COVID transmission — a pattern researchers tied to long-standing, resurfacing perceptions of Asian cuisine as “foreign, unclean, and disease-bearing.” NYU’s own reporting on the research was blunt about the finding: inspectors gave meaningfully harsher scrutiny to Asian restaurants specifically, not restaurants generally, at a moment when that scrutiny wasn’t justified by anything happening in those kitchens.
What this means for the restaurants at the bottom of the list
The same Annals of Global Health research used inspection grades as a proxy for occupational hazard exposure among South Asian restaurant workers specifically, finding that roughly 19% of Indian, 26% of Bangladeshi, and 15% of Pakistani restaurants in their sample failed to achieve an A grade — and treated that gap as a labor and workplace-safety indicator, not simply a cleanliness scorecard. That reframing matters: a lower A-grade rate concentrated in specific cuisines is doing double duty as a public dataset, showing both something real about kitchen conditions in some categories and something troubling about how consistently inspectors have scored certain cuisines relative to others, independent of what was actually found in the kitchen.
Untangling exactly how much of the 42-point gap between donuts and Indian restaurants comes from genuine kitchen-hazard differences versus inspector-level bias isn’t something a citywide aggregate can answer on its own — that requires the kind of controlled, inspection-level analysis the cited researchers ran, not a raw grade comparison. What the aggregate data does establish is that the gap is real, large, and consistent enough across multiple cuisine categories that “it’s just noise” isn’t a plausible explanation on its own.
What the city has done about it
The NYU-affiliated researchers who identified the early-pandemic citation spike against Asian restaurants recommended, directly, that health inspectors receive better training to recognize and correct for biases they may hold against specific cuisines. That’s a narrower, more specific recommendation than the broader inspection-system reforms the City Council has pursued over the years — a 2014 package of bills, passed after restaurant owners raised sustained complaints to the Council about inconsistency and fairness in how violations were scored, focused on making the process more transparent and less adversarial generally, not on cuisine-specific disparities. It isn’t clear from public records whether DOHMH has implemented cuisine-specific bias training in response to the more recent research; the department’s public-facing restaurant grading materials don’t reference it.
The letter-grade system itself has a track record independent of this dispute: a peer-reviewed evaluation published in the American Journal of Public Health found the grading program measurably improved restaurant sanitary conditions and reduced Salmonella-related hospitalizations citywide after its 2010 rollout. That’s worth holding alongside the cuisine-disparity finding rather than instead of it — the system appears to work as intended in aggregate, while still applying unevenly across the specific restaurants it grades.
What we did
We queried NYC Open Data’s DOHMH Restaurant Inspection Results dataset directly through its public API, filtering to inspections with a final A, B, or C grade, and grouped the results by the dataset’s own cuisine_description field. We restricted the comparison to cuisine categories with at least 500 graded inspections on record to avoid small-sample noise, then calculated the A-grade share for each. To interpret the pattern responsibly rather than simply reporting a ranking, we searched for peer-reviewed research on cuisine-based inspection disparities in New York City and found two directly relevant studies — one on inspector bias against Asian restaurants during early COVID-19, one using South Asian restaurant grades as an occupational-hazard proxy — and incorporated both explanations rather than presenting the raw numbers without that context.