There is a number that quietly governs the American box office, and almost no one has noticed it, because it hides inside a piece of arithmetic so simple it feels like a trick. The number is four — specifically, the fact that you can never have four. Four star movies cannot share a single week, no matter how crowded the calendar, no matter how many blockbusters open at once. It is not a rule of thumb or an industry norm. It is a mathematical impossibility, and from it falls an entire hidden architecture that shapes how movies compete, how theaters live and die, and where the whole business is heading. This is a long look at that architecture — the ceilings the golden ratio builds, and what twenty years of real data reveal about which of them the industry is pressing against.
The arithmetic of impossibility
Start with the definition. In the USA Times Star Index, a film is a “star movie” when it takes at least 26.18% of a single week’s entire U.S. box office. That threshold is drawn from the golden ratio — it is the smaller piece when 1 is divided in golden proportion, folded through the same math that sets the higher tiers — but for what follows, the mysticism is beside the point. What matters is that 26.18% is a slice of a pie that only has 100% to give.
Now try to fit four star movies into one week. Each needs at least 26.18% of the box office. Four of them would need 4 × 26.18% = 104.72% — more than the entire market produces. There is not enough money in a week to go around. So the box office can crown, at most, three star movies in a single week, and only if all three cling to the very bottom of the range, none daring to pull ahead. Push any of them higher and a fourth becomes not merely unlikely but arithmetically forbidden.
Batmandir · Guest Passes Step inside for a day. Guest passes from $161/day — brought in by a member. See guest passes →The same division sets a strict ceiling for every tier of domination. The index sorts films into three bands by their peak weekly share: a Mini-geuse (26.18–38.2%), a Betelgeuse (38.2–61.8%), and a Geuse (61.8% and up). Each band can only be so crowded before it, too, overflows the 100% budget:
| Tier | Weekly share | Max per week | Why not more |
|---|---|---|---|
| Geuse | 61.8%+ | 1 | 2 × 61.8% = 123.6% — over budget |
| Betelgeuse | 38.2%+ | 2 | 3 × 38.2% = 114.6% — over budget |
| Mini-geuse | 26.18%+ | 3 | 4 × 26.18% = 104.7% — over budget |
Two Geuses in one week would demand 123.6% of the box office. Three Betelgeuses would demand 114.6%. Four Mini-geuses, 104.7%. In every case the week simply runs out of room. This is the first and most rigid law of the system: one Geuse, two Betelgeuses, or three Mini-geuses — and never a fourth of anything.
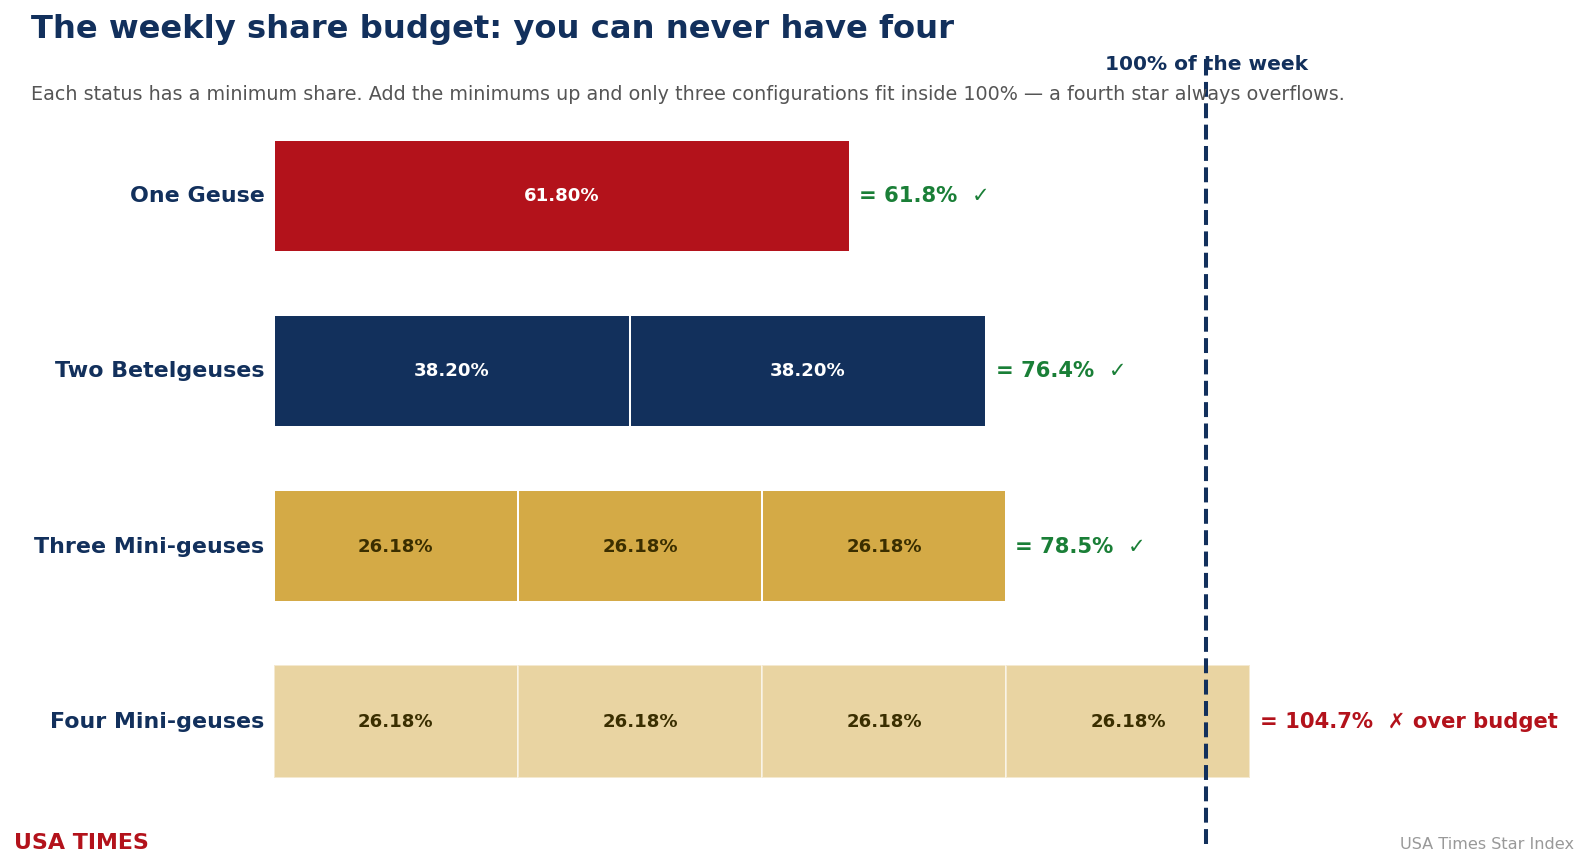
The diagram above is the entire “share budget” of a week rendered to scale. A single Geuse fills most of it and leaves almost nothing behind. Betelgeuse-Betelgeuse fit with room to spare. Three Mini-geuses pack in tightly. And in every row, the hatched red block is the impossible next film — the one the arithmetic refuses to admit. Everything else in this article is a consequence of that picture.
Every legal shape of a week
If you play the arithmetic all the way out — every combination of tiers whose minimum shares still fit inside 100% — you get exactly ten legal compositions of a week. Ten, and no more, ways the top of the American box office can be arranged on any given Friday-to-Thursday. They range from a single film swallowing everything to a three-way scramble in which nobody dominates.
| Composition | Films | Combined floor | Real frequency, 2006–2026 |
|---|---|---|---|
| Geuse (solo) | 1 | 61.8%+ | 64 (6.2%) |
| Betelgeuse (solo) | 1 | 38.2–61.8% | 199 (19.4%) |
| Mini-geuse (solo) | 1 | 26.18–38.2% | 275 (26.8%) |
| Geuse-Minigeuse | 2 | from 88% | 1 (0.1%) |
| Betelgeuse-Betelgeuse | 2 | from 76% | 1 (0.1%) |
| Betelgeuse + Mini-geuse | 2 | from 64% | 17 (1.7%) |
| Minigeuse-Minigeuse | 2 | from 52% | 31 (3.0%) |
| Betelgeuse + Mini-geuse + Mini-geuse | 3 | from 91% | —* |
| Mini-geuse + Mini-geuse + Mini-geuse | 3 | from 79% | —* |
| Dark (no star movie) | 0 | under 26.18% | 437 (42.6%) |
The frequency column is where theory meets reality, and it is worth dwelling on. Of the ten mathematically possible shapes, the real box office produces them in wildly unequal amounts. (The two three-film compositions, marked with an asterisk, are so rare that they do not cleanly register even in twenty years of top-two weekly data — a genuine three-event week is close to a theoretical object.) The lopsidedness of that column is the story. The box office does not use its full palette. It reaches, over and over, for the same few shapes.
What actually happens
We classified all 1,025 weeks in the index by composition, and the result overturns the popular image of the movies as a crowded, competitive arena. The single most common week — 437 of them, more than 40% of all weeks — contains no star movie at all. Not even the #1 film reaches 26.18%; the audience is spread so evenly across a slate of mid-size releases that nobody dominates. The second most common shape is a lone, modest #1. And the confrontation everyone pictures when they think of the box office — two titans trading blows — barely exists.
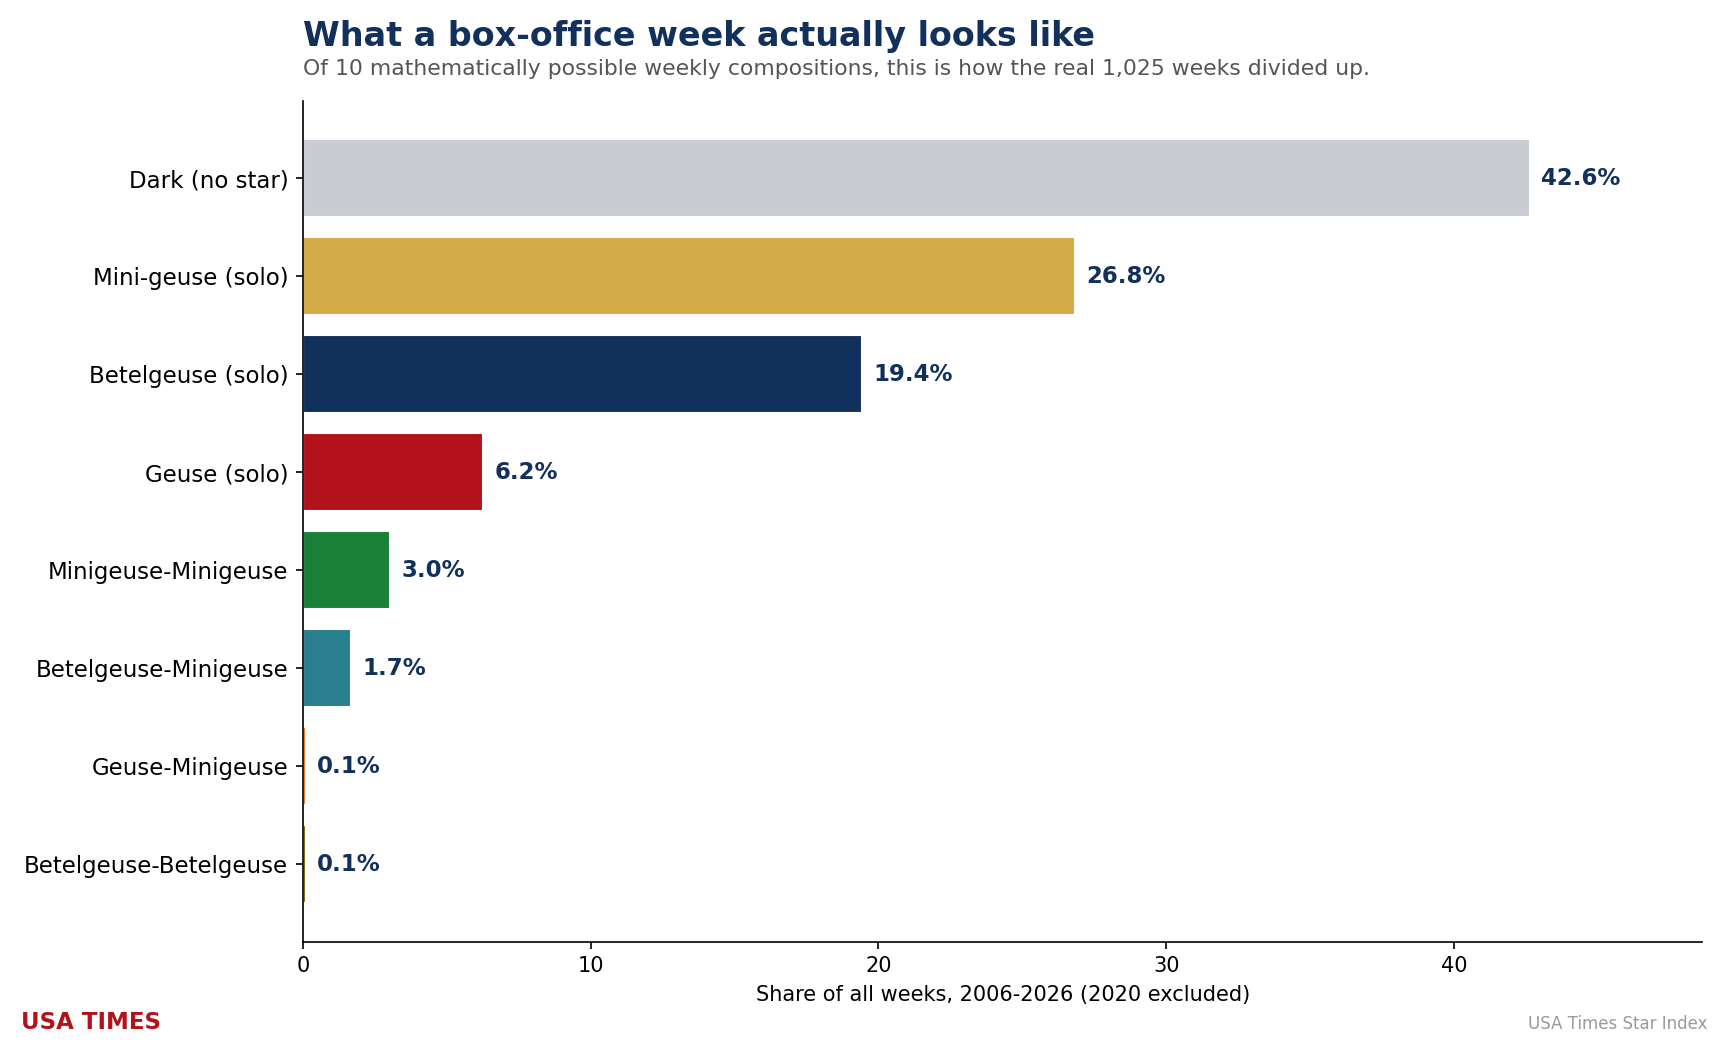
Add up every genuinely competitive week — two or three films clearing the star line at once — and you get roughly 5% of all weeks. The “Barbenheimer” fantasy of two giants splitting the culture down the middle is not the norm; it is one of the rarest events the box office produces. A true monopoly week, by contrast — a single Geuse with no rival even reaching star level — happens about 6% of the time. The market is almost always either shared by many or owned by one. The fair fight between a few is the exception.
What each composition means
Numbers like these are only useful if they translate into meaning, so here is the interpretive key. Think of the four broad shapes as a spectrum running from a healthy, pluralistic market to an outright monopoly.
| The shape of the week | What it tells you |
|---|---|
| Fragmented (no event) | A shared, pluralistic box office. Many films, none dominant, the audience distributing itself freely. The healthiest sign of a diverse marketplace — and, historically, the most common week of all. |
| One clear #1 (Mini-geuse or Betelgeuse (solo)) | A decisive but not total leader. One film is plainly on top, yet the rest of the market still breathes beneath it. The everyday texture of a functioning box office. |
| Competitive (2–3 co-events) | A genuine contest: two, rarely three, films both clear the event bar. The rarest shape, and arguably the most exciting — real competition at the top. |
| Monopoly (a Geuse (solo)) | One film takes 62% or more and no other title even reaches event level. Total domination with zero company. The whole market, for seven days, is effectively one movie. |
Read as a spectrum, the shapes measure the concentration of power in the movie business week by week. And once you can measure something, you can watch it change.
Every year, by the shape of its weeks
The chart below breaks all twenty-one years into these four categories, stacked so each column is a full year. It is, in effect, an X-ray of the box office’s changing skeleton. Watch two things at once: the grey band of fragmented weeks at the bottom, and the thin red cap of monopoly weeks at the top.
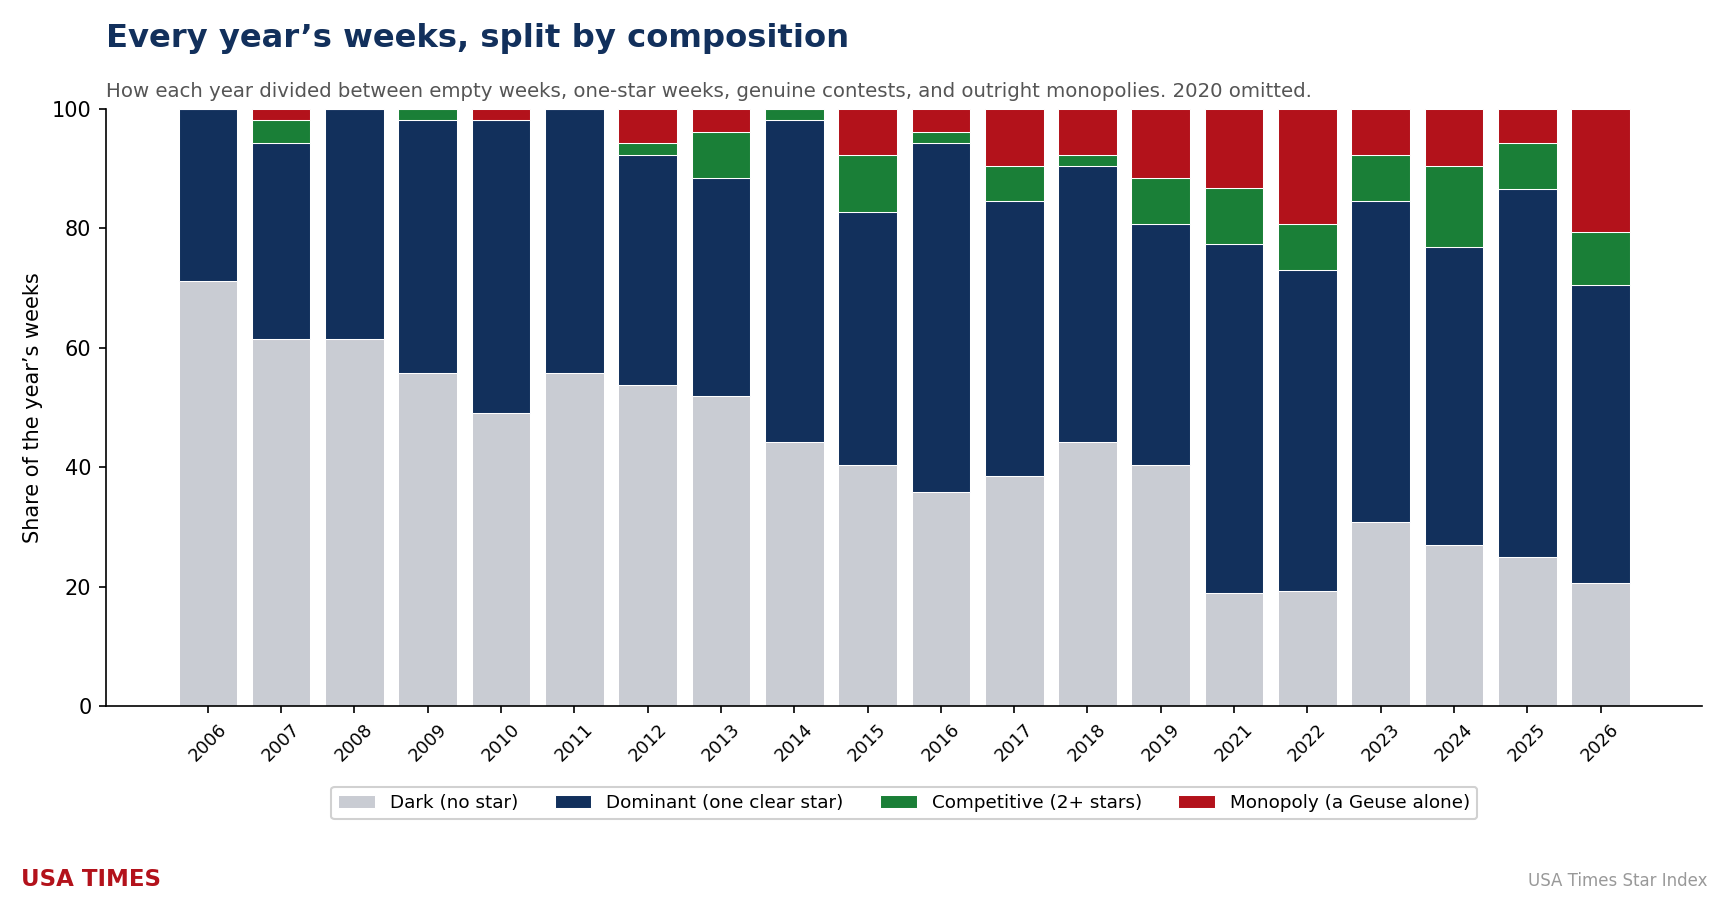
In the late 2000s, the columns are bottom-heavy with grey: most weeks belonged to no one in particular, a wide and shared market. As the years advance, the grey recedes and the red creeps upward. The change is not violent in any single year — this is the quiet kind of shift that only twenty years of data can expose — but the direction is unmistakable. The box office has been slowly trading its shared weeks for owned ones.
Every week, laid bare
The yearly columns compress a lot of detail. To see the change as it truly unfolds — week by week, across two decades at once — here is the entire index as a single calendar. Every cell is one week; its color is that week’s composition. Twenty years run top to bottom (2020 is omitted as a pandemic anomaly), January to December left to right.
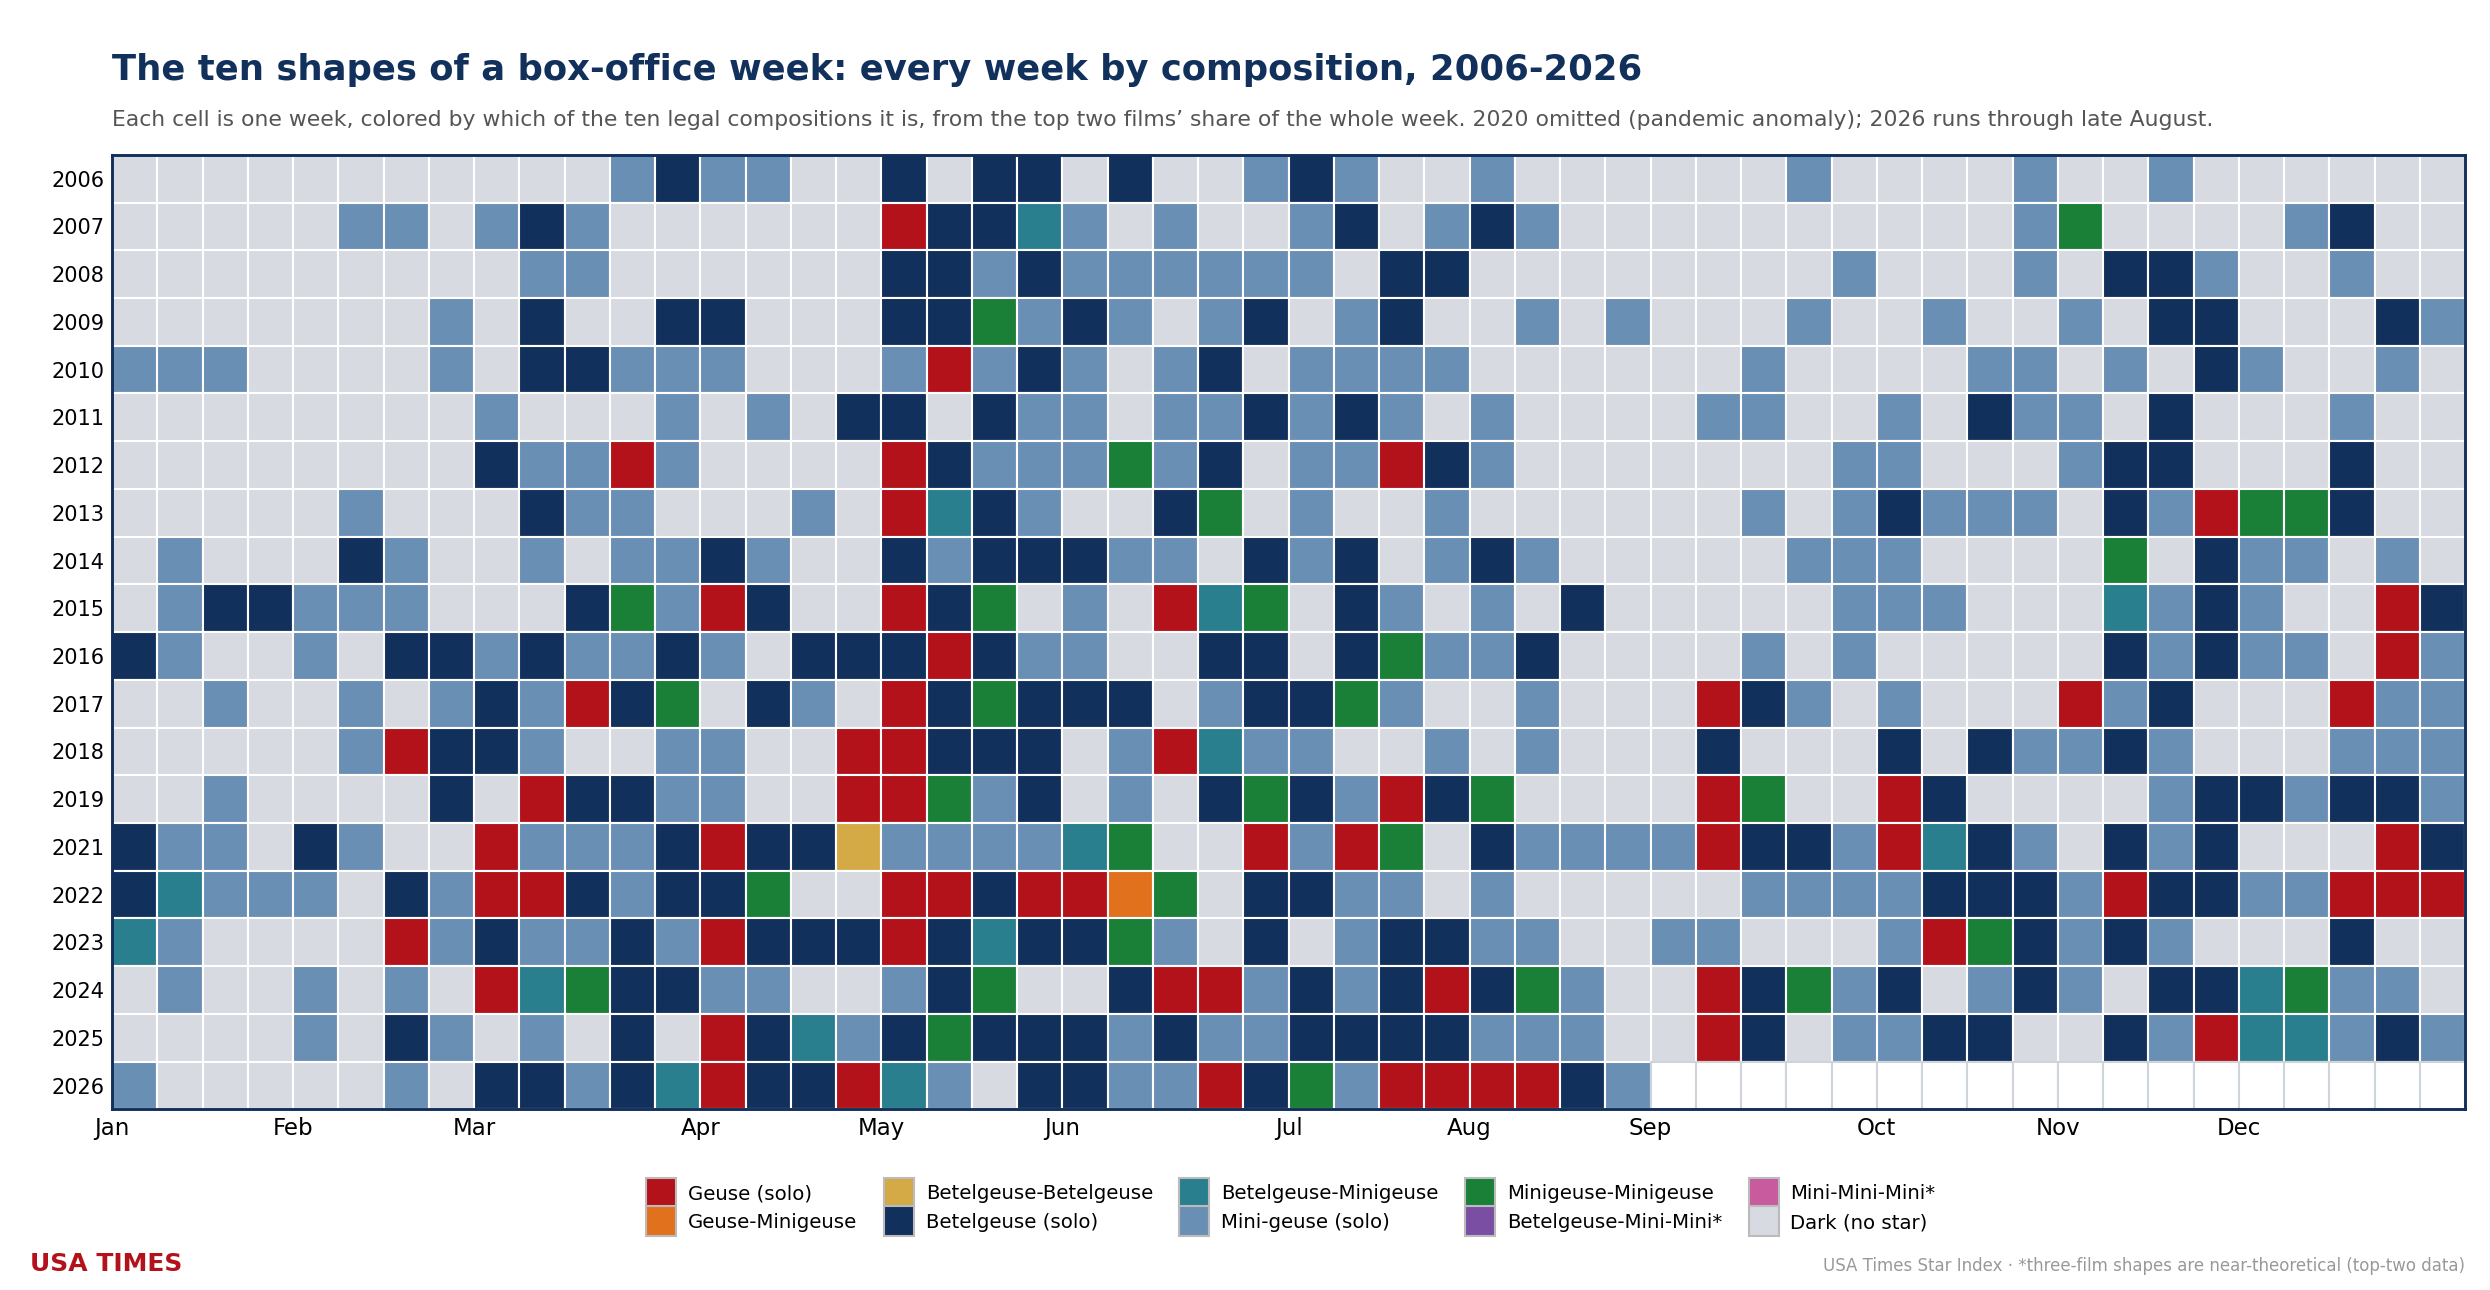
Two patterns leap out of the grid. First, the vertical stripes: the red Geuse weeks — a single film owning the whole week — cluster in two columns — early May and the December holidays — the runways studios clear for their giants, while the grey Dark weeks, with no star movie at all, pool in the January–February and August–September dead zones. Concentration has a season. Second, and more important, the horizontal drift: the top of the chart (the late 2000s) is a wash of grey and navy, almost no red at all; the bottom (the 2020s) is speckled with red from spring through winter. The monopoly week was once confined to a handful of summer and holiday frames. It has since spread across the calendar. You are watching, in a single image, the shared box office give way to the owned one.
The rarest weeks in twenty years
Every distribution has its outliers, and in the box office the outliers are unforgettable. At one extreme sit the great monopoly weeks — the moments a single film came as close as anything ever has to being the American box office.
| The biggest monopoly weeks | Year | #1 share | #2 share |
|---|---|---|---|
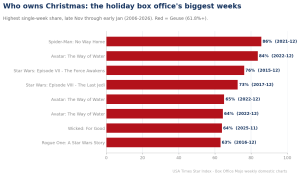
| Avengers: Endgame | 2019 | 88.3% | 2.0% |
| Black Panther: Wakanda Forever | 2022 | 86.1% | 3.9% |
| Spider-Man: No Way Home | 2021 | 85.6% | 3.5% |
| Avatar: The Way of Water | 2022 | 83.7% | 3.8% |
| Doctor Strange in the Multiverse of Madness | 2022 | 83.3% | 4.2% |
Avengers: Endgame’s opening week is the summit: 88% of everything spent at U.S. theaters, with the #2 film reduced to a rounding error. For seven days, going to the movies in America meant, overwhelmingly, going to one movie. At the opposite extreme are the photo finishes — the vanishingly rare weeks when two films arrived so evenly matched that the “#1 movie in America” was essentially a coin flip.
| The closest two-title races | Year | Shares | Margin |
|---|---|---|---|
| Alien: Covenant vs Guardians of the Galaxy Vol. 2 | 2017 | 27.0% vs 26.8% | 0.1 pts |
| Toy Story 4 vs Spider-Man: Far from Home | 2019 | 28.2% vs 28.0% | 0.2 pts |
| Inside Out vs Jurassic World | 2015 | 27.0% vs 26.4% | 0.6 pts |
| Dune: Part Two vs Kung Fu Panda 4 | 2024 | 32.6% vs 31.9% | 0.7 pts |
| Spider-Man: Across the Spider-Verse vs Transformers: Rise of the Beasts | 2023 | 34.7% vs 33.9% | 0.8 pts |
The tightest of them was decided by a tenth of a percentage point. These are the weeks the system was built to celebrate — genuine competition at the highest level — and the data confirms how precious they are. In twenty-one years, you can count the true photo finishes on your fingers.
The twenty-year shift, in one comparison
Split the record cleanly in half and the trend sharpens into a single, stark comparison.
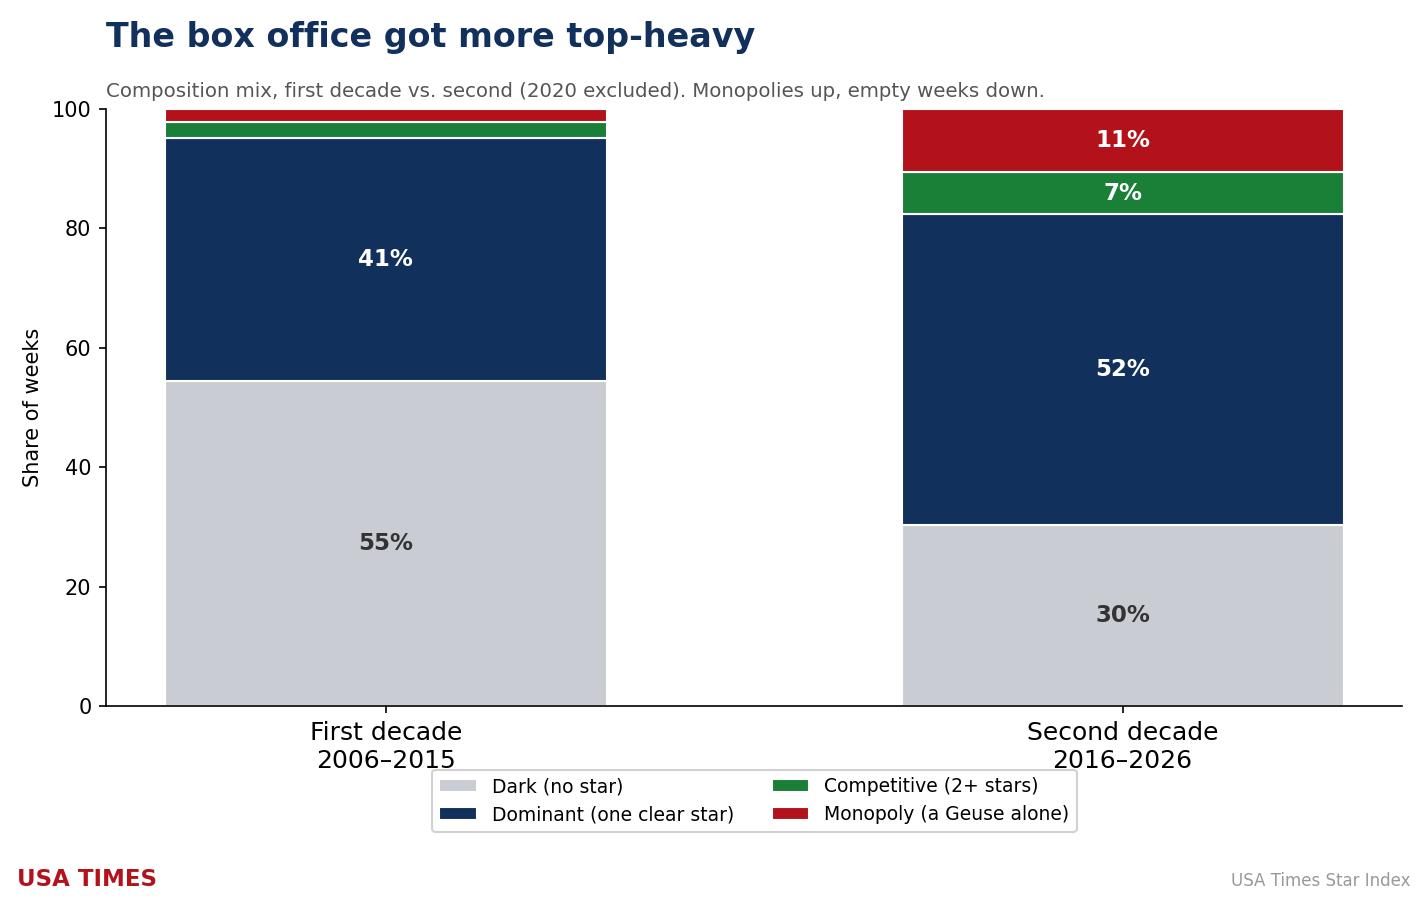
Monopoly weeks — one Geuse, no rival — rose from just 2.1% of weeks in 2006–2015 to 10.5% in 2016–2026, more than a fivefold increase. Over the same span, fragmented weeks — the shared, wide-open market — were cut sharply, from 54.5% to 30.4%. The box office did not become more competitive as it grew more expensive and more franchise-driven. It became more monopolized. The shared middle that once defined the majority of weeks has been steadily converted into total-domination weeks for a shrinking set of giants, and holdover weeks for those same giants as they linger at the top.
Where the line points
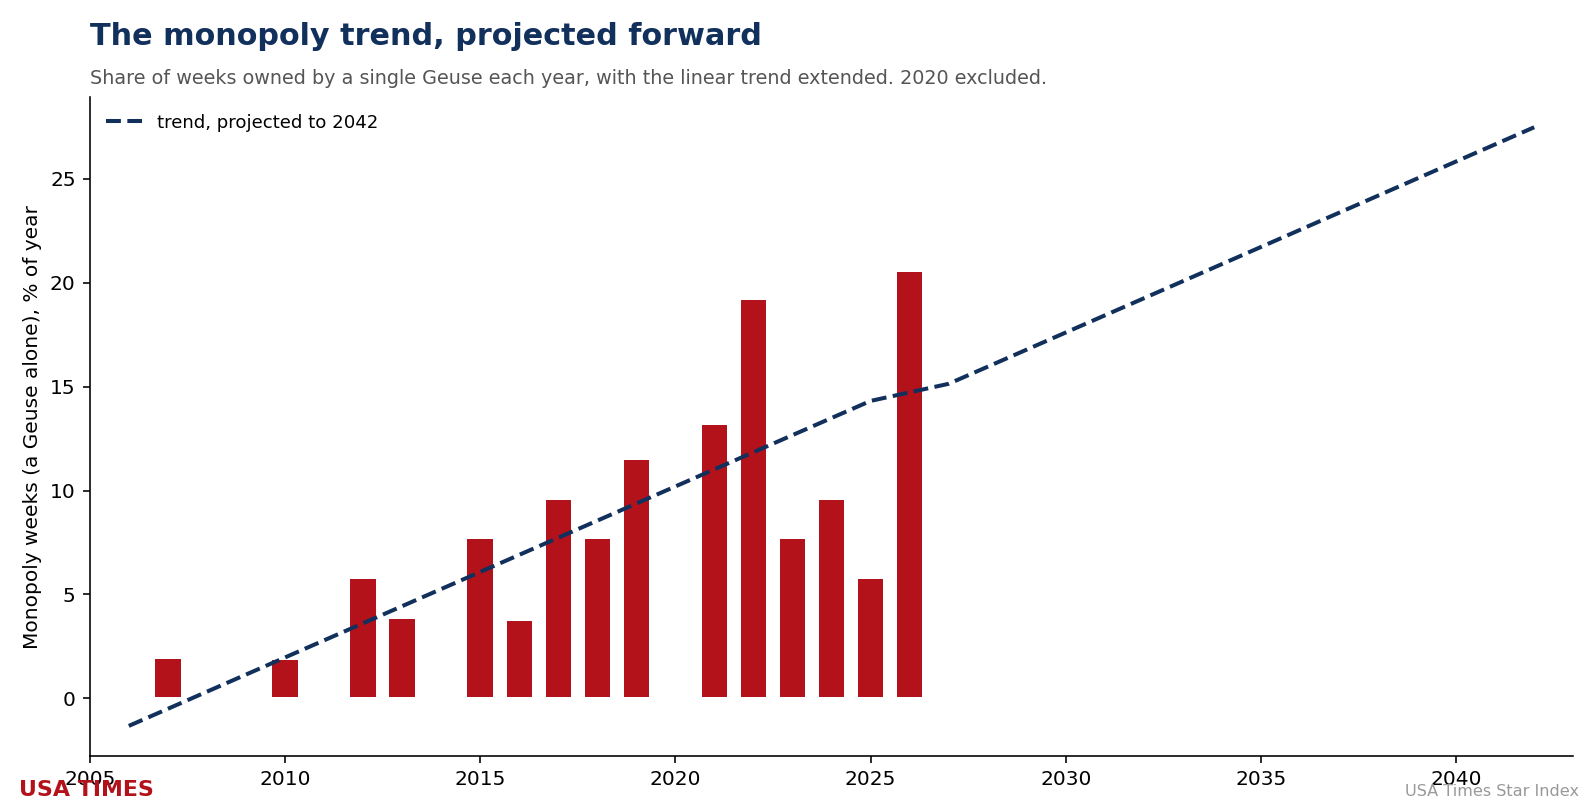
Trends invite extrapolation, and while no honest analyst pretends a straight line will hold for decades, it is genuinely useful to ask where the current one is heading. Fit the monopoly-week share to its twenty-year trajectory and project it forward, and the arithmetic is sobering.
| Year | Projected monopoly weeks |
|---|---|
| 2030 | 15.7% |
| 2035 | 19.0% |
| 2040 | 22.4% |
| 2050 | 29.1% |
At the present rate, monopoly weeks — those owned outright by a single Geuse — would climb from today’s roughly one-in-ten toward one-in-five by the 2040s, and would not reach half of all weeks until around 2081. That is a caveat as much as a forecast: the change is real and directional, but slow, and decades of runway remain before the extreme arrives. Still, the arrow has pointed the same way for twenty years, and nothing in the structure of the modern business suggests it is about to reverse.
Why the shared week is dying
A trend this consistent has causes, and they are structural rather than accidental. The shared, fragmented week — that healthy grey band at the bottom of our year chart — was built on a category of film that has been quietly disappearing: the mid-budget wide release. For most of the 2000s, a typical weekend carried three or four movies for grown-ups opening at once — a thriller, a comedy, a drama, a genre picture — each drawing a real slice of the audience, none dominating. Those films split the market into the pluralistic weeks that used to be the norm. It was the sheer number of viable wide releases that kept any single film from taking over.
Three forces hollowed that category out. Streaming absorbed the mid-budget adult film almost entirely, turning what would once have been a theatrical release into a title that debuts at home. Studios, chasing certainty, concentrated their spending on a shrinking set of franchise tentpoles and stopped making the middle. And the pandemic accelerated both trends by years, permanently thinning the release calendar. The result is a box office with fewer films fighting for each week — and when fewer films compete, the ones that remain face less resistance, which is precisely the condition under which a single title can seize 62% of a week. Concentration at the top is the mirror image of collapse in the middle. The monopoly weeks are rising not because blockbusters got bigger, but because everything around them got smaller or vanished.
The calendar of concentration
Concentration is not spread evenly across the year, either — it has a geography, and it maps neatly onto the release calendar we have documented elsewhere in this index. Monopoly weeks cluster in the two windows studios reserve for their giants: the early-summer corridor that opens in May, and the year-end holiday stretch from Thanksgiving through New Year’s. These are the weeks a single tentpole is deliberately given a cleared runway, and they are where Geuses are manufactured. The fragmented, shared weeks cluster at the opposite ends of the calendar — the post-holiday lull of January and February, and the late-summer dead zone of August and September, when studios park the films they do not expect to break out and the market splinters among them.
This is why the same year can contain both a crimson wall of total domination and a long grey stretch of pluralism: they simply happen in different months. But the balance between those seasons is shifting too. As the tentpole windows expand — as studios stretch “summer” earlier into spring and “holiday” earlier into November — the monopoly weeks eat into the shared ones from both sides. The calendar itself is being reorganized around domination, one formerly quiet week at a time.
A note on the method
A word on how these compositions are measured, in the interest of showing our work. Each week is classified from the shares of the films at the top of that week’s domestic chart, drawn from Box Office Mojo and The Numbers, with the golden-ratio thresholds applied exactly as the index defines them. Because our weekly records track the top two films precisely, the two rare three-film compositions cannot always be distinguished from two-film weeks — but genuine three-event weeks are so scarce that their absence changes none of the conclusions. Shares measure domination within a single week, not a film’s total gross or its quality; a movie can post a towering monopoly week and fade, or settle for a modest share against fierce competition and out-earn it over a full run. What the composition data captures is not how much money was made, but how the power of a given week was distributed — and it is that distribution, tracked across two decades, that has moved so decisively toward the one from the many.
The 52-red year, and what it would mean
Which brings us to the thought experiment at the end of the road: a year that is all red. Fifty-two consecutive weeks, each one a Geuse, each owned outright by a single film taking 62% or more of the entire market. On our year-by-year chart it would be a solid crimson wall — the most concentrated box office that could mathematically exist, since a week can hold only one Geuse and there are only 52 weeks to give.
It is worth taking seriously what such a year would mean, because the industry is, slowly, walking toward it. A 52-Geuse year would be an extinction event for most of cinema. If every single week is claimed outright by one dominant title, there is no oxygen left for anything else. The mid-budget drama, the counter-programmed comedy, the horror sleeper that builds by word of mouth, the specialty release hunting for a foothold — all of them depend on the shared and fragmented weeks that such a year erases entirely. In a world of 52 monopoly weeks, there is quite literally never a week in which a smaller film can find room to breathe.
For exhibitors, it would mean a brutal feast-or-famine calendar: a handful of colossal tentpole weeks separated by dead air, with the theater reduced to a delivery pipe for four or five franchises. For filmmakers outside those franchises, it would mean a market with no entry point. For audiences, it would mean spectacle in abundance and choice in famine — more of less. The paradox of concentration is that it can look like health from a distance (record grosses! packed opening weekends!) while hollowing out everything beneath the very top.
We are nowhere near that world — today’s roughly 12% of monopoly weeks is a long way from 100%. But the value of counting compositions, rather than merely counting films, is that it makes the direction legible. As our headline index has long noted, the raw number of star movies each year barely moves. What moves — and moves only one way — is the shape of the weeks that produce them. Every monopoly week that replaces a shared one is a small, quiet transfer of the American box office from the many to the one.
The ceilings themselves are eternal, fixed forever by arithmetic that will never change: one Geuse, two Betelgeuses, three Mini-geuses, fifty-two weeks. You can never have four. What is not fixed — what is, in fact, still being decided, week by week and year by year — is how close to that last, lonely red wall the movie business chooses to build. For now, the line is still climbing.
Related from the USA Times Data Desk
- Box Office Tracker: "Minions & Monsters" Holds No. 1, "Michael" Quietly Crosses $371M
- The Marathoners: The Films That Owned the Box Office the Longest
- The Secret in Our Stars: The Golden-Ratio Math Hidden in the USA Times Logo
- The Betelgeuse-Betelgeuse Week Has Happened Once in Twenty Years. Our Editor-in-Chief Bets December 18 Won't Be the Second.
- Box-office coverage index · the Star Index methodology
Sources
- Box Office Mojo — Weekend Domestic Box Office
- Box Office Mojo — Yearly Domestic Box Office
- The Numbers — Weekly Box Office Chart
- USA Times — Star Index methodology & data sources