There is an old rule of thumb in Hollywood: a big movie makes most of its money in the first weekend and then falls off a cliff. The steepness of that cliff has a name in the trade — the “second-weekend drop” — and it is watched obsessively, because it separates films with staying power from films that merely opened well. We wondered whether that drop had a natural size, and whether it might land near the number that governs the rest of our index: the golden ratio’s 38.2%.
To test it, we looked at every film that led the U.S. box office two weeks in a row over the last twenty years, and measured how much of its share of the entire market it surrendered from week one to week two. This is a slightly different question than the usual dollar-based drop: it asks not just how much a film fell, but how much ground it ceded to everything else opening around it.
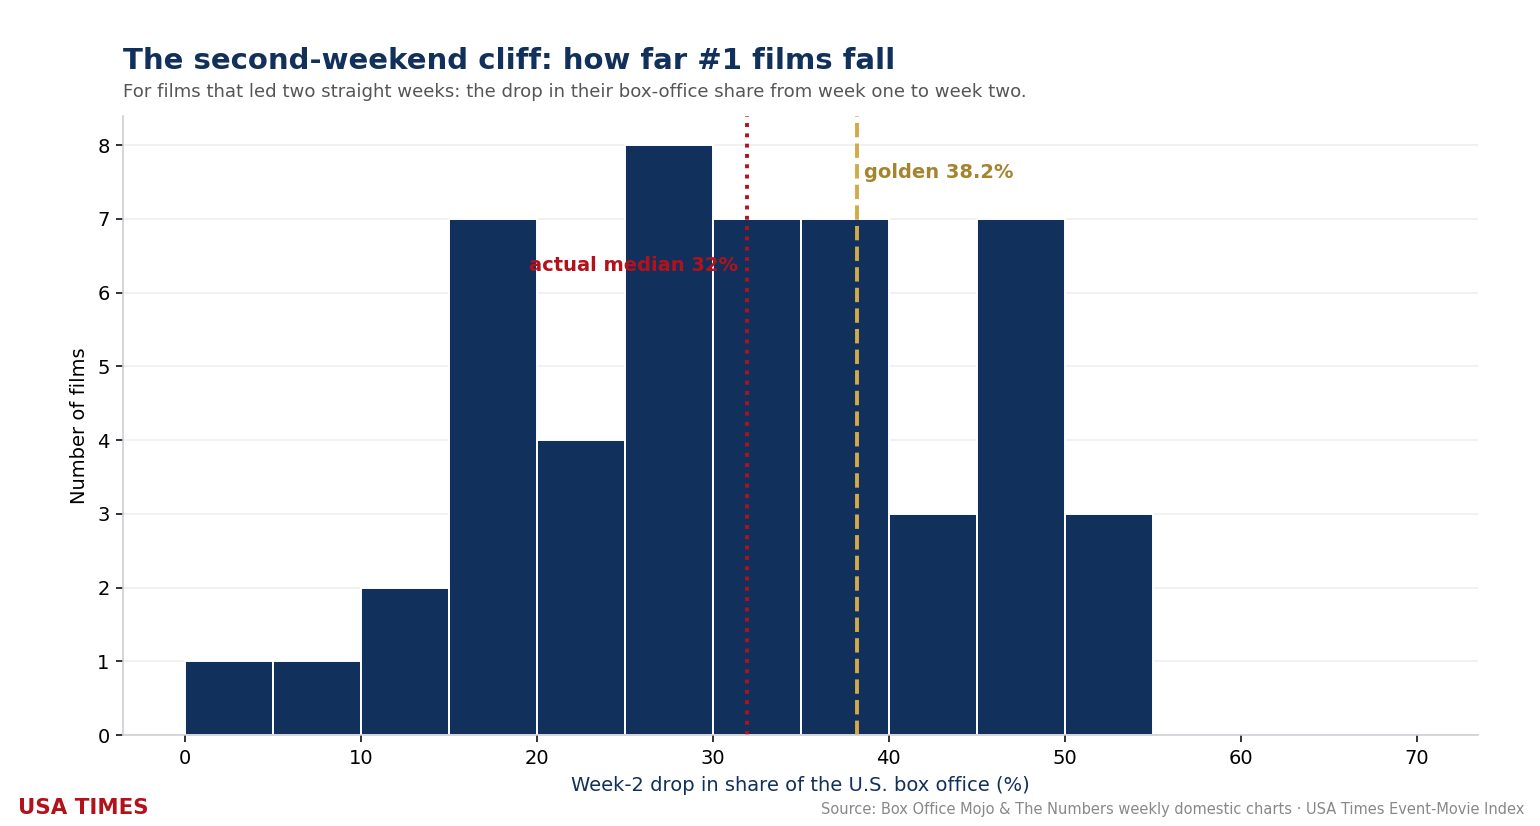
Close to golden, but not quite
The typical second-week film gives up a median of about 32% of its share, with an average near 31%. That is genuinely in the neighborhood of the golden 38.2% — close enough to be striking, but we want to be straight with you: it is not a match, and it would be a stretch to claim the box office “obeys” the golden ratio here. The real story is a broad distribution. Some films barely move; others fall off a genuine cliff. The 38.2% figure sits inside the fat middle of that spread rather than pinning it down.
Batmandir · Guest Passes Step inside for a day. Guest passes from $161/day — brought in by a member. See guest passes →Why land a little below 38.2% on average? Because a film only appears in this sample if it was strong enough to lead twice — and films that lead twice are, by definition, better holders than average. The one-week wonders that crater 60% in week two never make the list. So the population is pre-selected for staying power, which pulls the typical drop gentler than the golden line.
The cliffs and the clingers
The steepest drops belong to films with enormous, front-loaded openings and little repeat business — the movies everyone rushed to see once. The gentlest belong to word-of-mouth successes and holiday releases that held their audience week after week.
Steepest second-week falls
| Film | Year | Share, wk1 → wk2 | Drop |
|---|---|---|---|
| Ant-Man and the Wasp: Quantumania | 2023 | 69.9% → 32.0% | −54% |
| F9: The Fast Saga | 2021 | 66.3% → 32.4% | −51% |
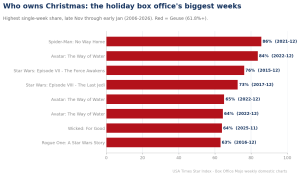
Star Wars: Episode VIII – The Last Jedi | 2017 | 72.6% → 36.0% | −50% |
| Iron Man 2 | 2010 | 69.8% → 35.9% | −49% |
| It: Chapter Two | 2019 | 63.4% → 32.7% | −48% |
| Rogue One: A Star Wars Story | 2016 | 63.1% → 32.8% | −48% |
Best holders
| Film | Year | Share, wk1 → wk2 | Drop |
|---|---|---|---|
| Top Gun: Maverick | 2022 | 72.3% → 74.4% | −-3% |
| The Odyssey | 2026 | 65.1% → 61.8% | −5% |
| Inside Out 2 | 2024 | 73.3% → 67.4% | −8% |
| Spider-Man: Brand New Day | 2026 | 80.0% → 70.0% | −13% |
| The Super Mario Bros. Movie | 2023 | 71.1% → 61.1% | −14% |
| Guardians of the Galaxy Vol. 3 | 2023 | 73.0% → 60.1% | −18% |
What the cliff really measures
It is tempting to reach for a tidy law here — to say the box office “decays by the golden ratio” — and the internet is full of that kind of claim about φ in music, architecture, and nature, most of it built by drawing the rectangle after the fact. We would rather not add to the pile. What the data actually shows is more useful and more human: a strong film cedes roughly a third of its command in its second week, the exact figure swinging widely with how front-loaded the opening was and what opened against it.
The second-weekend cliff, in other words, is real, but it is a range, not a constant. It flatters the golden ratio without confirming it — a coincidence worth noticing and not worth overselling. The films that beat the cliff, the clingers at the bottom of our second table, are the ones worth studying: they are how a movie turns a big opening into a long life.
Why the cliff exists at all
The second-weekend drop is not a mystery of audience psychology so much as a matter of arithmetic. A film with a devoted built-in audience converts most of that demand in its first three days: the fans who pre-ordered tickets, the franchise faithful who would have seen it at midnight if a midnight show existed. Once that reservoir is drained, week two depends on a different and slower engine — word of mouth, repeat viewings, and the casual moviegoer who waits for the crowds to thin. If the first engine was enormous and the second is merely ordinary, the drop looks like a cliff even when the film is performing perfectly respectably.
Exhibition mechanics amplify the effect. Theaters reallocate their best screens and showtimes to whatever opens next, so a film’s second week is fought with fewer and worse slots than its first. Some of the share a champion cedes is not lost demand at all; it is simply real estate handed to the new arrival.
A cliff that has grown steeper over time
The shape of a theatrical run has changed dramatically over the two decades our sample covers. In the era of slow rollouts, a hit could build for weeks; today, saturation marketing, near-universal pre-sales, and social media mean a film’s commercial fate is largely decided by Sunday night of its opening weekend. Opening weekends now routinely account for a larger fraction of a film’s total domestic gross than they did in the mid-2000s, and steeper front-loading mathematically implies steeper second-week falls.
The shortened theatrical window pushes in the same direction. When audiences know a film will reach streaming in weeks rather than months, the marginal moviegoer has less reason to hurry — or to come at all — and the theatrical run compresses toward its opening. That our sample’s gentlest holds cluster among family films and word-of-mouth phenomena is consistent with this: those are precisely the audiences least driven by opening-night urgency.
Share is not dollars
A caveat worth sitting with: measuring the drop in market share rather than dollars changes what the number means. A film’s share can collapse in a week when its own grosses held up fine, simply because a giant opened against it; conversely, a film can lose forty percent of its dollars and lose almost no share in a dead week of January. Our metric therefore blends two forces — a film’s own decay and the strength of what arrived around it — and the blend is the point. It measures command of the marketplace, not raw earning power.
This is also why the share-based drop lands gentler than the dollar-based drops quoted in trade coverage. A champion’s second-week dollar fall of 55% can coexist with a share fall of 35% if the whole market shrank with it, as it usually does after a big opening inflates the total.
What the industry does with this number
The second-weekend hold is arguably the single most consequential early signal a distributor gets. It drives the following week’s screen negotiations, determines whether marketing spend is extended or quietly wound down, and increasingly shapes the timing of the premium video-on-demand release. A film that holds like Top Gun: Maverick earns months of theatrical runway; a film that falls like Quantumania sees its streaming date pulled forward. In that sense the cliff is not merely observed by the industry — it is acted upon, and the action feeds back into the shape of the run itself.
The golden ratio’s gravitational pull
Why check the golden ratio at all? Partly because it anchors the rest of this index, and partly because φ has a long history of being “found” in places it does not quite live — seashells, symphonies, stock charts. The honest pattern across that literature is the one we found here: distributions whose middles pass near 38.2% get celebrated, and the wide spread around the middle gets forgotten. Our median of roughly 32% is close enough to be a good headline and far enough to be a bad law, and we think the distinction is worth preserving. The interesting object is the distribution, not the constant.
What to watch next
The metric’s next test arrives with every new champion. Watch whether the streaming-era compression continues to steepen the median drop, whether holiday corridors keep producing the gentlest holds, and whether the rare share-gainers — films that command more of the market in week two — remain as vanishingly scarce as the top of our second table suggests. If the typical drop drifts up through 38.2% in the coming years, the golden coincidence will have been brief; if it settles there, we will note it — with the same skepticism.
Related from the USA Times Data Desk
- The Efficiency Champions: How Cheap Horror Owns the Box Office
- The 10 Most Dominant Weeks in 20 Years of American Moviegoing
- The Marathoners: The Films That Owned the Box Office the Longest
- Holding the Throne: The Films That Stayed a Box-Office Geuse Two Weeks Running (2006–2026)
- Box-office coverage index · the Star Index methodology