- ≥ 26.18% of the U.S. (domestic) box office that week, or
- ≥ 6.18% of the global box office that week.
- Geuse — 61.8%+ of the week
- Betelgeuse — 38.2%–61.8%
- Mini-geuse — 26.18%–38.2%
Most “best of the year” movie lists rank films by what they made. Ours ranks them by something harder to fake: how much of America’s moviegoing each one swallowed in a single week. We ran all 52 weeks of 2024 through the USA Times Star Index — the top film’s gross as a share of that week’s entire U.S. box office — and marked every week a single movie cleared the 26.18% threshold.
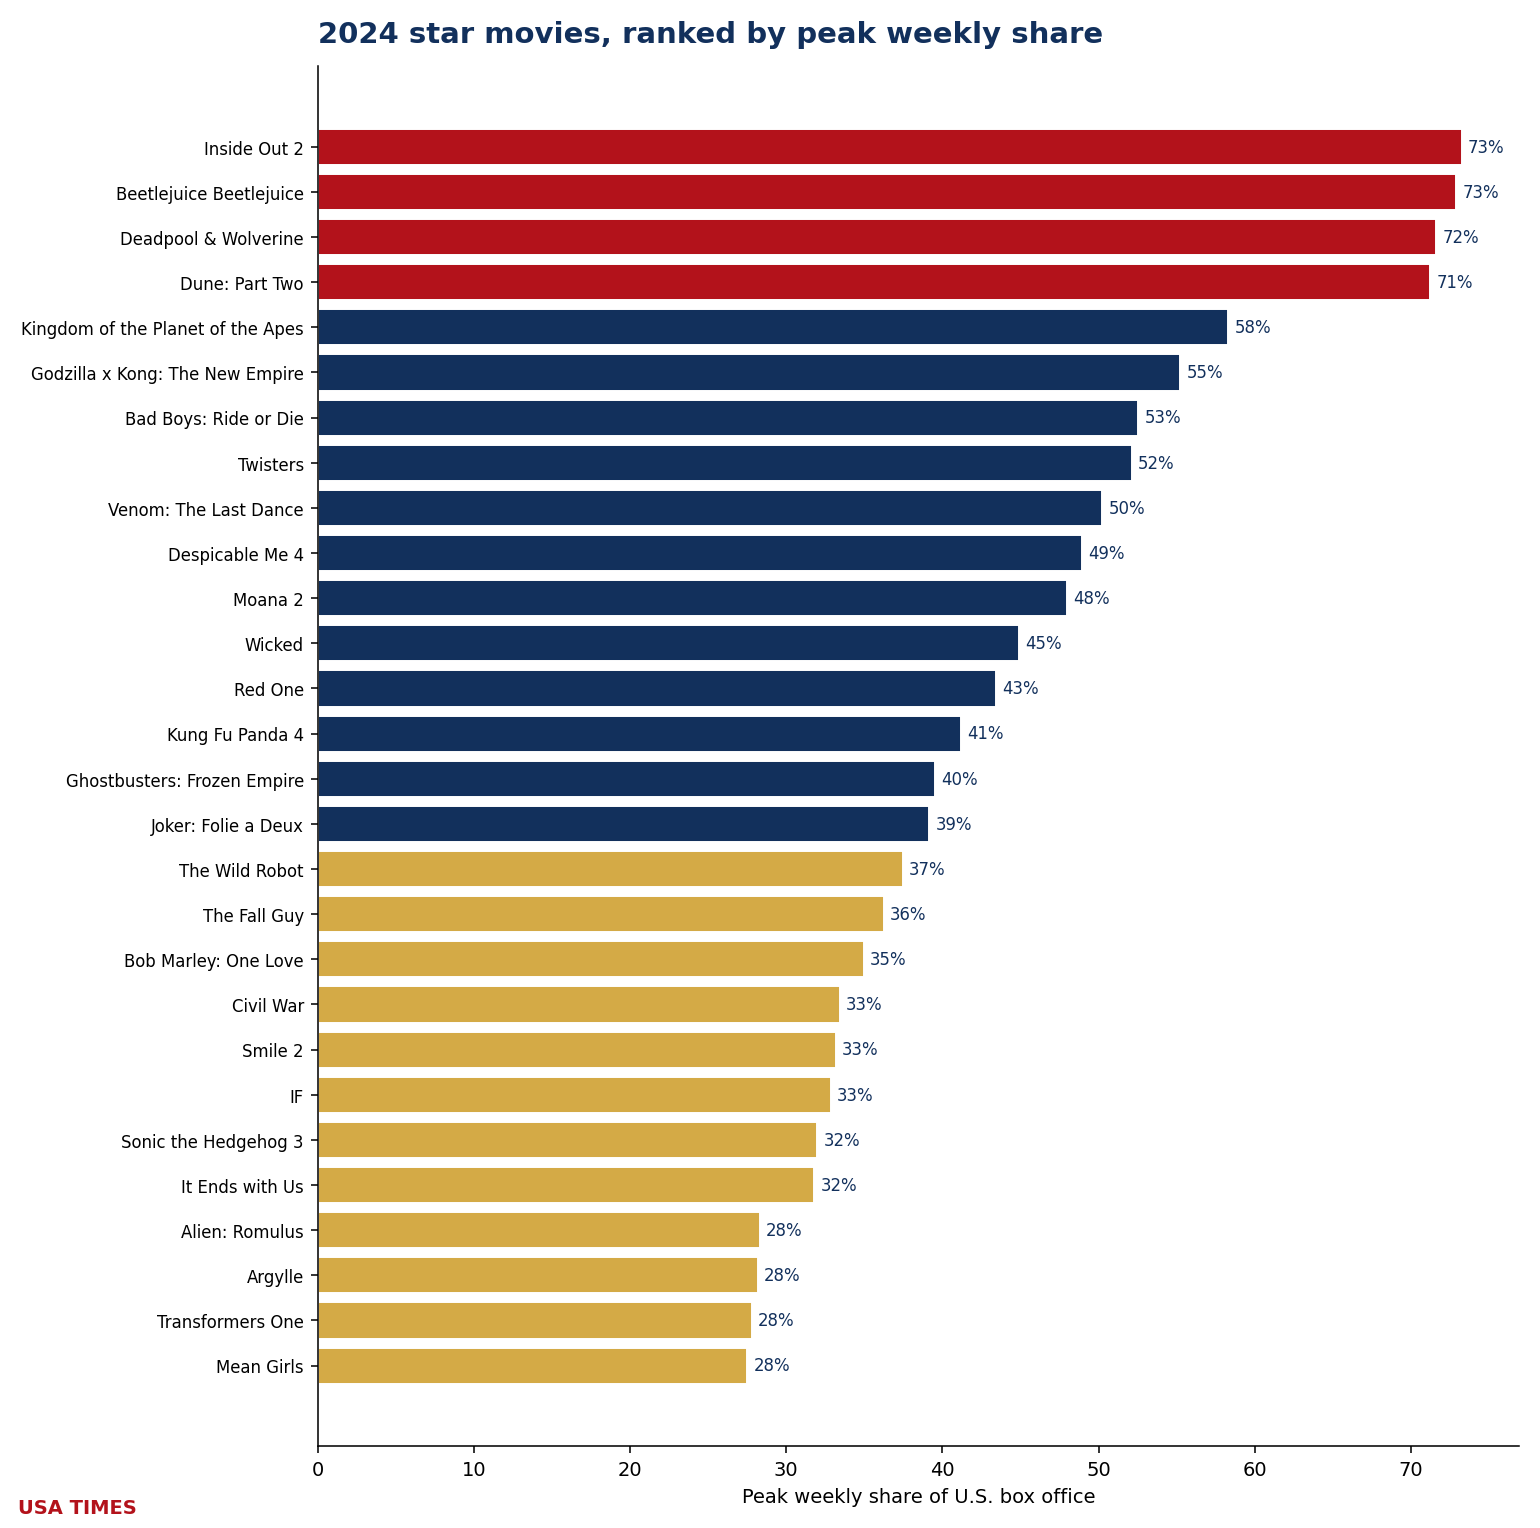
The result: 28 films owned at least one week of 2024, from Inside Out 2 (a staggering 73.3% of the entire domestic box office in one week) down to Mean Girls (27.5% in a dead January week). Fourteen weeks had no owner at all.
Three tiers of event — set by the golden ratio
Not every owned week is equal. We grade each on a scale built entirely from the golden ratio (φ), the same proportion behind the USA Times star:
Batmandir · Founders A numbered seat at the table. S3 · The Founders Club — 161 seats per location. By invitation. Explore membership →| Tier | Weekly share of U.S. box office | 2024 films |
|---|---|---|
| Geuse | 61.8%+ — owned nearly two of every three tickets sold that week | 4 |
| Betelgeuse | 38.2% – 61.8% | 12 |
| Mini-geuse | 26.18% – 38.2% — cleared the bar, owned the week | 12 |
26.18%, 38.2% and 61.8% are all golden-ratio points: φ², the minor section, and 1/φ.
The 28 star movies of 2024 — and which ones actually made money
Owning a week is about attention, not profit. The last column is the USA Times profitability signal: worldwide box office ÷ production budget. A green ▲ means the film out-grossed its budget; a red ▼ means it didn’t. Two films owned a week of America and still lost money outright — Red One (0.74×) and Argylle (0.48×) — and Joker: Folie à Deux only limped past its budget at 1.08×. (Note: a film generally needs roughly 2–2.5× its production budget to break even once marketing is counted, so a ratio just over 1 can still be a loss.)
| # | Film | Peak share | Tier | Worldwide | WW ÷ budget |
|---|---|---|---|---|---|
| 1 | Inside Out 2 | 73.3% | Geuse | $1,698M | 8.5× ▲ |
| 2 | Beetlejuice Beetlejuice | 72.9% | Geuse | $451M | 4.5× ▲ |
| 3 | Deadpool & Wolverine | 71.6% | Geuse | $1,338M | 6.7× ▲ |
| 4 | Dune: Part Two | 71.2% | Geuse | $714M | 3.8× ▲ |
| 5 | Kingdom of the Planet of the Apes | 58.3% | Betelgeuse | $397M | 2.5× ▲ |
| 6 | Godzilla x Kong: The New Empire | 55.2% | Betelgeuse | $572M | 4.2× ▲ |
| 7 | Bad Boys: Ride or Die | 52.5% | Betelgeuse | $404M | 4.0× ▲ |
| 8 | Twisters | 52.1% | Betelgeuse | $371M | 2.4× ▲ |
| 9 | Venom: The Last Dance | 50.3% | Betelgeuse | $476M | 4.0× ▲ |
| 10 | Despicable Me 4 | 48.9% | Betelgeuse | $969M | 9.7× ▲ |
| 11 | Moana 2 | 48.0% | Betelgeuse | $1,059M | 7.1× ▲ |
| 12 | Wicked | 44.9% | Betelgeuse | $756M | 5.0× ▲ |
| 13 | Red One | 43.4% | Betelgeuse | $186M | 0.74× ▼ |
| 14 | Kung Fu Panda 4 | 41.2% | Betelgeuse | $548M | 6.4× ▲ |
| 15 | Ghostbusters: Frozen Empire | 39.5% | Betelgeuse | $226M | 2.3× ▲ |
| 16 | Joker: Folie a Deux | 39.2% | Betelgeuse | $206M | 1.1× ▲ |
| 17 | The Wild Robot | 37.5% | Mini-geuse | $325M | 4.2× ▲ |
| 18 | The Fall Guy | 36.3% | Mini-geuse | $181M | 1.4× ▲ |
| 19 | Bob Marley: One Love | 35.0% | Mini-geuse | $180M | 2.6× ▲ |
| 20 | Civil War | 33.4% | Mini-geuse | $127M | 2.5× ▲ |
| 21 | Smile 2 | 33.2% | Mini-geuse | $138M | 4.9× ▲ |
| 22 | IF | 32.9% | Mini-geuse | $190M | 1.7× ▲ |
| 23 | Sonic the Hedgehog 3 | 32.0% | Mini-geuse | $492M | 4.0× ▲ |
| 24 | It Ends with Us | 31.8% | Mini-geuse | $351M | 14.0× ▲ |
| 25 | Alien: Romulus | 28.3% | Mini-geuse | $351M | 4.4× ▲ |
| 26 | Argylle | 28.2% | Mini-geuse | $96M | 0.48× ▼ |
| 27 | Transformers One | 27.8% | Mini-geuse | $129M | 1.7× ▲ |
| 28 | Mean Girls | 27.5% | Mini-geuse | $105M | 2.9× ▲ |
Worldwide grosses via Box Office Mojo; production budgets are reported studio/press estimates (Box Office Mojo, The Numbers, trade press) and are approximate. Ratio = worldwide gross ÷ production budget; ▲ ≥ 1×, ▼ < 1×.
The most eventful movies of 2024
Peak share tells you how high a film climbed. It doesn’t tell you how long it stayed. A film can explode for one weekend and vanish — or reign for a month. So we counted, for every film, how many weeks it held event status and in which tier. The chart below is the real measure of dominance: staying power.
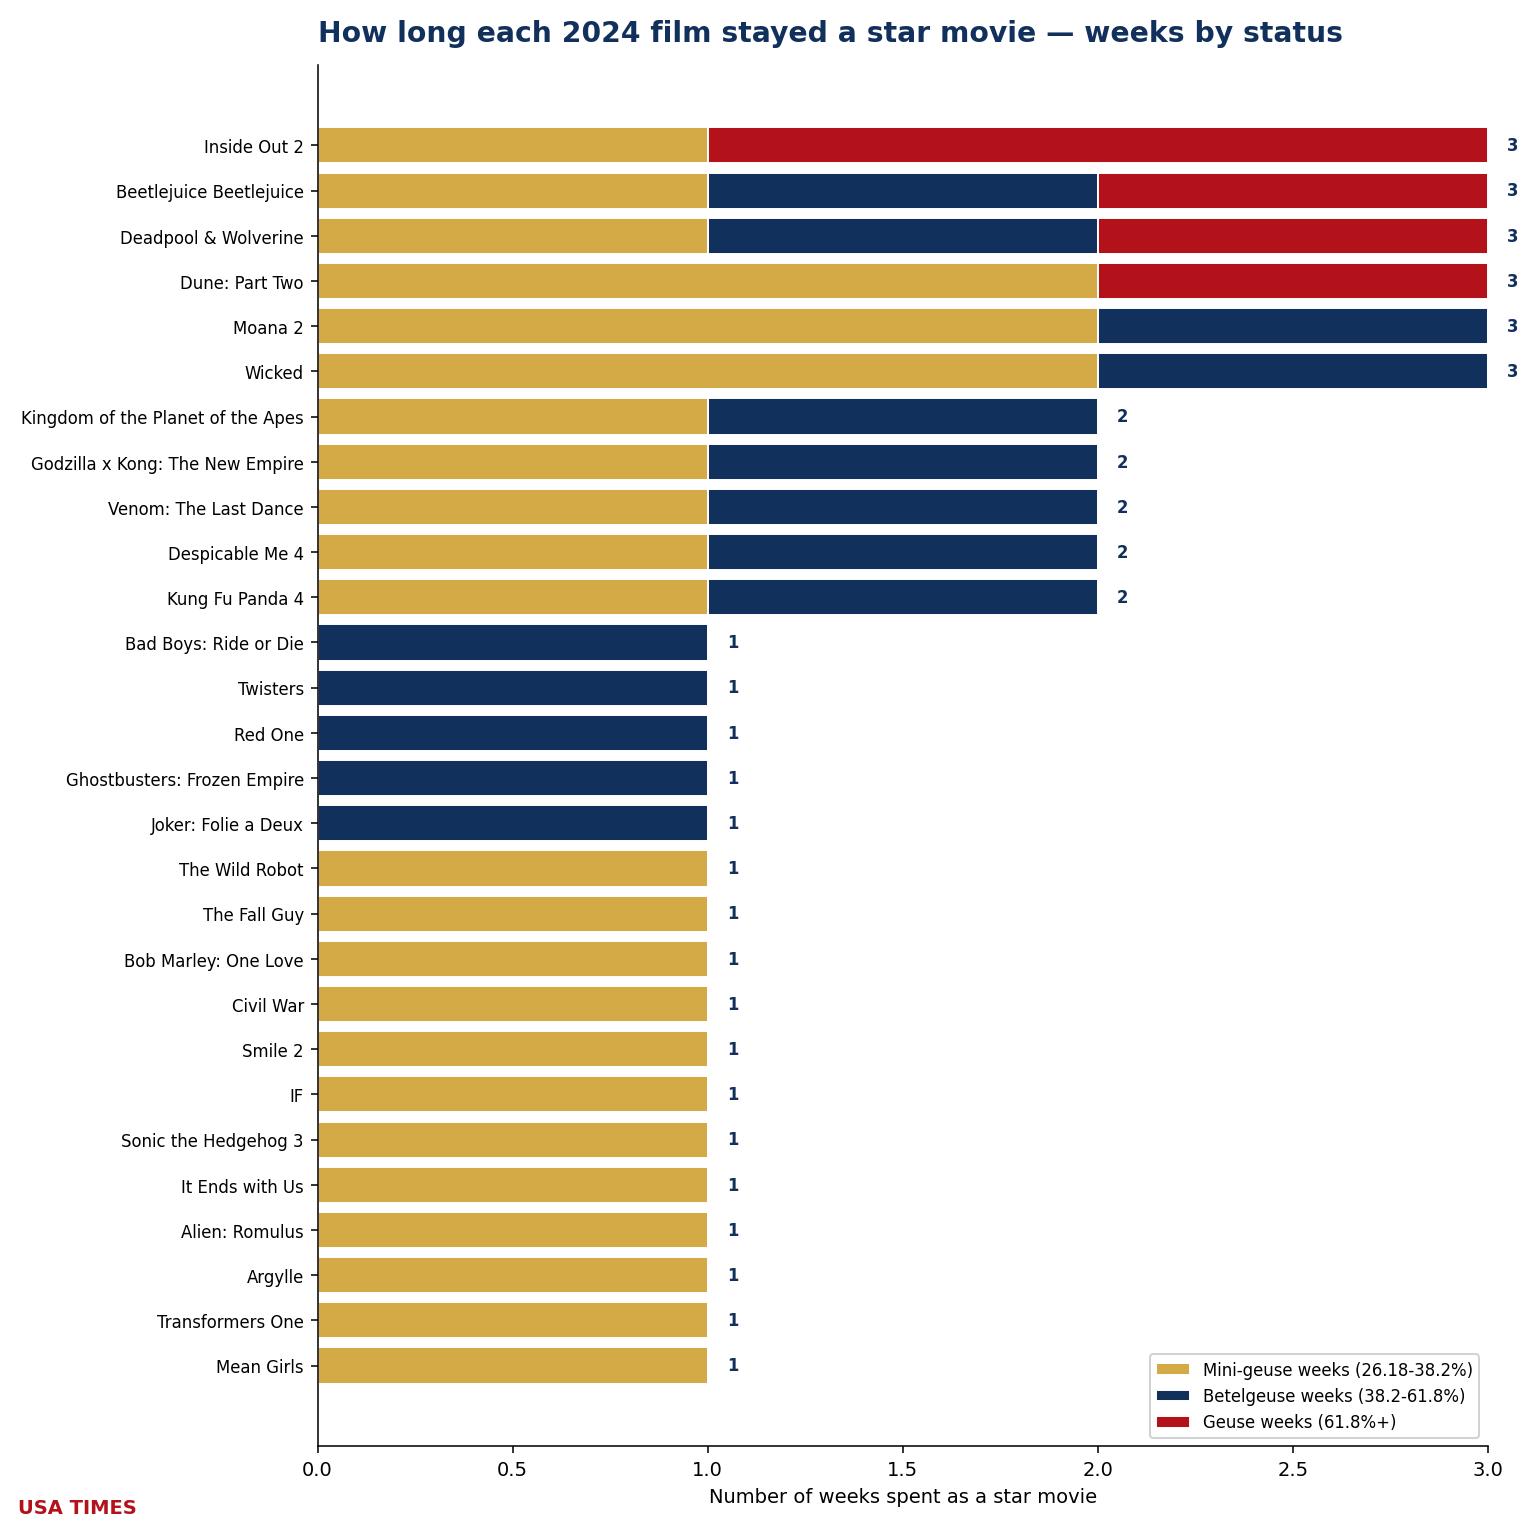
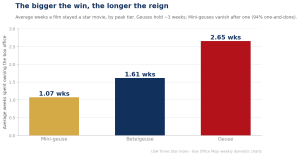
Six films tied for the year’s longest reign at three weeks apiece — but they were not equal. Inside Out 2 is 2024’s most eventful film: it spent two of its three weeks as a Geuse (73.3% and 67.4%), a depth of dominance no other release matched. At the other end sit the one-week wonders — 17 of the 28 owned exactly one week and were gone, Joker: Folie à Deux the archetype. Across all 28 films, 2024 produced 45 film-weeks of event status.
Week by week: the Star Index
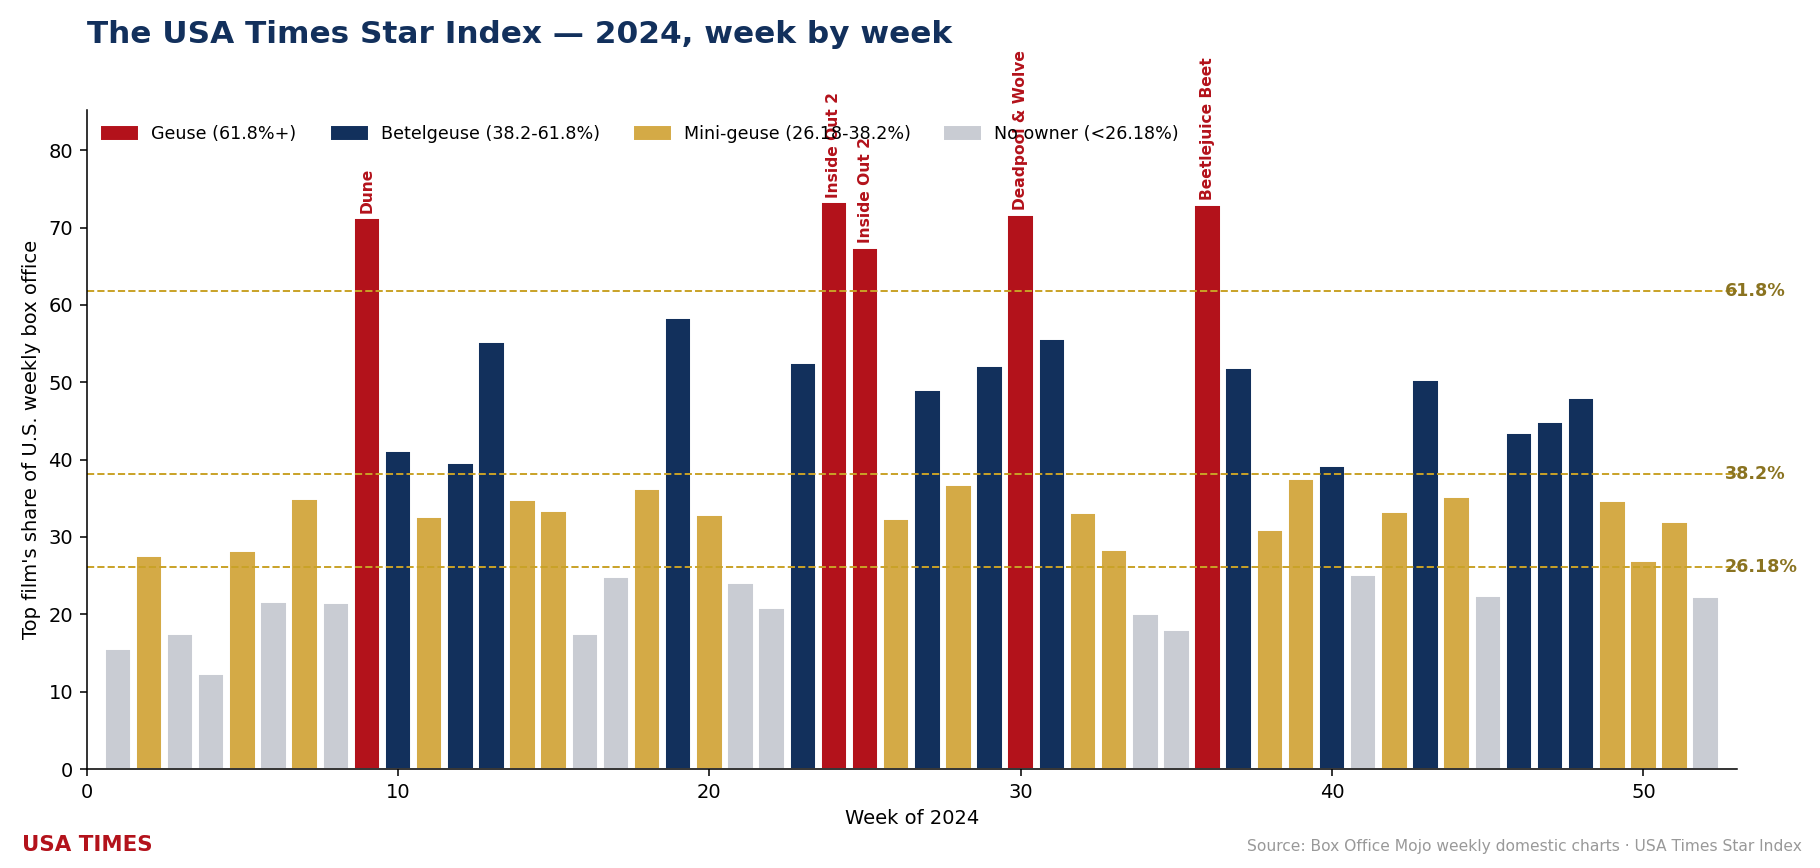
Read left to right, 2024 is a story of feast and famine. Each bar is the top film’s share of the U.S. box office that week, colored by tier. Gray bars are the 14 no-owner weeks.
| Wk | Week starting | Who owned the week | Share | U.S. total |
|---|---|---|---|---|
| 1 | 2024-01-05 | No owner | 15.5% | $113M |
| 2 | 2024-01-12 | Mean Girls | 27.5% | $139M |
| 3 | 2024-01-19 | No owner | 17.5% | $87M |
| 4 | 2024-01-26 | No owner | 12.3% | $75M |
| 5 | 2024-02-02 | Argylle | 28.2% | $79M |
| 6 | 2024-02-09 | No owner | 21.6% | $83M |
| 7 | 2024-02-16 | Bob Marley: One Love | 35.0% | $114M |
| 8 | 2024-02-23 | No owner | 21.4% | $82M |
| 9 | 2024-03-01 | Dune: Part Two | 71.2% | $156M |
| 10 | 2024-03-08 | Kung Fu Panda 4 + Dune: Part Two 34.5% | 41.2% | $189M |
| 11 | 2024-03-15 | Dune: Part Two + Kung Fu Panda 4 31.9% | 32.6% | $121M |
| 12 | 2024-03-22 | Ghostbusters: Frozen Empire | 39.5% | $146M |
| 13 | 2024-03-29 | Godzilla x Kong: The New Empire | 55.2% | $187M |
| 14 | 2024-04-05 | Godzilla x Kong: The New Empire | 34.8% | $113M |
| 15 | 2024-04-12 | Civil War | 33.4% | $101M |
| 16 | 2024-04-19 | No owner | 17.5% | $88M |
| 17 | 2024-04-26 | No owner | 24.8% | $88M |
| 18 | 2024-05-03 | The Fall Guy | 36.3% | $99M |
| 19 | 2024-05-10 | Kingdom of the Planet of the Apes | 58.3% | $129M |
| 20 | 2024-05-17 | IF + Kingdom of the Planet of the Apes 26.4% | 32.9% | $130M |
| 21 | 2024-05-24 | No owner | 24.1% | $162M |
| 22 | 2024-05-31 | No owner | 20.8% | $101M |
| 23 | 2024-06-07 | Bad Boys: Ride or Die | 52.5% | $151M |
| 24 | 2024-06-14 | Inside Out 2 | 73.3% | $348M |
| 25 | 2024-06-21 | Inside Out 2 | 67.4% | $233M |
| 26 | 2024-06-28 | Inside Out 2 | 32.3% | $284M |
| 27 | 2024-07-05 | Despicable Me 4 | 48.9% | $243M |
| 28 | 2024-07-12 | Despicable Me 4 | 36.8% | $188M |
| 29 | 2024-07-19 | Twisters | 52.1% | $230M |
| 30 | 2024-07-26 | Deadpool & Wolverine | 71.6% | $417M |
| 31 | 2024-08-02 | Deadpool & Wolverine | 55.6% | $254M |
| 32 | 2024-08-09 | Deadpool & Wolverine + It Ends with Us 31.8% | 33.0% | $232M |
| 33 | 2024-08-16 | Alien: Romulus | 28.3% | $199M |
| 34 | 2024-08-23 | No owner | 20.0% | $127M |
| 35 | 2024-08-30 | No owner | 18.0% | $125M |
| 36 | 2024-09-06 | Beetlejuice Beetlejuice | 72.9% | $187M |
| 37 | 2024-09-13 | Beetlejuice Beetlejuice | 51.8% | $124M |
| 38 | 2024-09-20 | Beetlejuice Beetlejuice + Transformers One 27.8% | 30.9% | $107M |
| 39 | 2024-09-27 | The Wild Robot | 37.5% | $121M |
| 40 | 2024-10-04 | Joker: Folie a Deux | 39.2% | $114M |
| 41 | 2024-10-11 | No owner | 25.1% | $107M |
| 42 | 2024-10-18 | Smile 2 | 33.2% | $94M |
| 43 | 2024-10-25 | Venom: The Last Dance | 50.3% | $127M |
| 44 | 2024-11-01 | Venom: The Last Dance | 35.1% | $99M |
| 45 | 2024-11-08 | No owner | 22.4% | $97M |
| 46 | 2024-11-15 | Red One | 43.4% | $91M |
| 47 | 2024-11-22 | Wicked | 44.9% | $405M |
| 48 | 2024-11-29 | Moana 2 + Wicked 30.6% | 48.0% | $339M |
| 49 | 2024-12-06 | Moana 2 + Wicked 28.1% | 34.7% | $181M |
| 50 | 2024-12-13 | Moana 2 | 27.0% | $130M |
| 51 | 2024-12-20 | Sonic the Hedgehog 3 | 32.0% | $311M |
| 52 | 2024-12-27 | No owner | 22.3% | $307M |
Red-shaded = Geuse week (61.8%+). Blue-shaded = Betelgeuse (38.2–61.8%). Gray = no owner. A red “+” marks the seven weeks a second film also cleared 26.18%.
Never four in a week — and in 2024, never even three
Because four films clearing 26.18% would need more than 100% of a single week, four is arithmetically impossible and three is rare. 2024 proved it: seven weeks had two owners at once — but never three, and never four. Crowd a week with too many big films and they cannibalize each other until nobody owns it: exactly what happened the final week of the year, when Mufasa and Sonic 3 split Christmas and neither cleared the bar.
Where the events cluster
Star-weeks by month in 2024: Jan 1, Feb 2, Mar 5, Apr 2, May 3, Jun 4, Jul 4, Aug 3, Sep 4, Oct 3, Nov 3, Dec 4. Whether that shape holds across two decades is what our multi-year index is built to answer — we are extending it back to 2006, one year at a time.
How we built this
For each week of 2024 we divided the No. 1 film’s weekly domestic gross by the total domestic box office for that week, both from Box Office Mojo’s weekly charts, and checked the No. 2 film for the rare two-owner weeks. A film is a star movie if its share reached 26.18% in any week; its tier is set by its peak. The profitability signal divides each film’s worldwide gross (Box Office Mojo) by its reported production budget. All weekly figures are domestic (Friday–Thursday); no share here is estimated.
Sources: Box Office Mojo — 2024 domestic weekly box office and the 52 weekly charts linked therein; worldwide grosses and budget estimates via Box Office Mojo and The Numbers. Method: USA Times Star Index. See also the USA Times definition of a star movie.
2006–2023 open in the 20-year index; 2024, 2025 and 2026 have their own pages.
Related from the USA Times Data Desk
- Since 1940: Every Year's Biggest Indian Film — and the Budget Boom That Changed the Math
- The Star Movies of 2026, So Far (Updated Weekly)
- The Star Movies of 2025: Every Film That Took Over a Week at the Box Office
- The Star Movies of Indian Cinema, 2025: Dhamaka, Toofan, Tsunami
- Box-office coverage index · the Star Index methodology
Sources
- Box Office Mojo — Weekend Domestic Box Office
- Box Office Mojo — Yearly Domestic Box Office
- The Numbers — Weekly Box Office Chart
- USA Times — Star Index methodology & data sources