When is the U.S. box office actually a fight? The instinct is to say summer — all those tentpoles stacked on top of each other. The data says the opposite. We measured the gap between the No. 1 and No. 2 film every week for twenty years, then averaged it by month. The most lopsided month, by far, is May: the No. 1 film beats No. 2 by an average of 29 share points. The closest months are the quiet ones — January (a 9-point gap) and August (10).
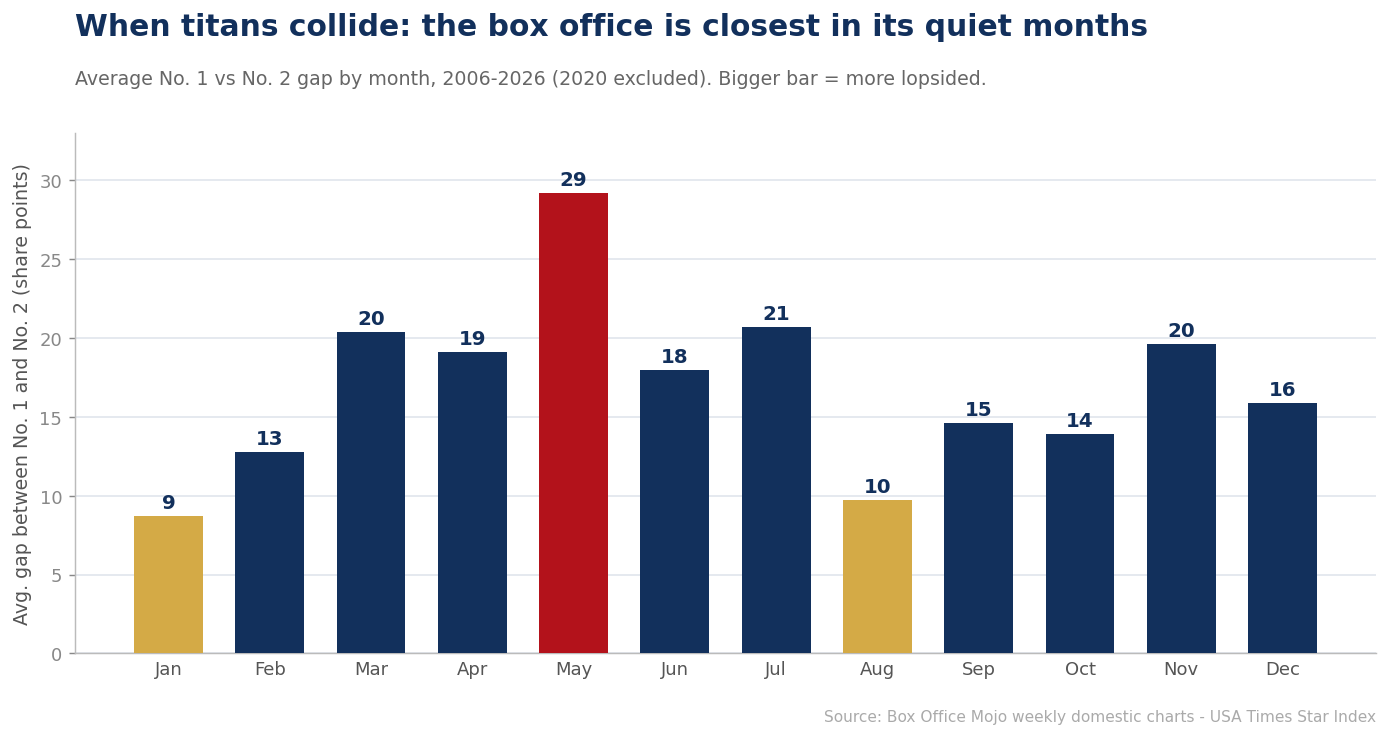
The giants don’t compete — they clear the room
The pattern makes sense once you see it. When a true event film opens — Avengers in late April, a Pixar or a Star Wars in the summer corridor, a Thanksgiving juggernaut in November — it doesn’t so much beat the competition as vaporize it. Those months (May, July, March, November) post the widest gaps precisely because one film is taking 60–90% of the market and everything else is fighting over scraps. The blockbuster season is the least competitive time at the top of the chart.
The real contests happen in the off-season. January, February and August — the so-called dump months — are when no single film is big enough to run away, so two mid-sized releases end up separated by a point or two. If you want to see an actual photo finish at the box office, don’t look at the Fourth of July. Look at a cold weekend in January.
Batmandir · Guest Passes Step inside for a day. Guest passes from $161/day — brought in by a member. See guest passes →Why it matters for release strategy
For a studio, the chart is a map of where oxygen exists. Drop a modest film into May and it will likely be buried under a giant; drop the same film into late January and it can plausibly win a weekend outright. That is why counter-programming clusters in the gaps — and why the “quiet” months quietly mint a surprising number of one-week champions.
How the gap is measured — and what it leaves out
A word on the yardstick. The gap here is the difference in share of the weekly top-ten gross between the first- and second-place film, not the difference in raw dollars. That choice matters. A 29-point share gap in a $250 million May weekend and a 9-point gap in a $70 million January weekend describe very different amounts of money, but they describe the same thing about structure: how much of the available audience one title absorbed. Using share rather than dollars is what lets a summer weekend and a winter weekend sit on the same chart without the summer simply drowning everything else out.
The trade-off is that share is a zero-sum measure. When a giant opens, No. 2’s share falls even if its dollar gross is perfectly healthy — a film earning $30 million behind a $150 million opener looks, on this chart, like it was crushed, when in fact it may have done exactly what its studio hoped. The averages also smooth over a lot of variance inside each month: May’s 29 points is an average of weekends where the leader took nearly everything and weekends, later in the month, where the field had re-balanced. Readers should treat the monthly figures as a description of tendency, not a rule for any given weekend.
The mechanism: why concentration follows the calendar
The lopsidedness of the big months is not an accident of which films happened to be good. It is built into how studios date releases. Tentpoles are given the widest possible screen counts — frequently four thousand or more locations, with multiple auditoriums per multiplex and premium formats locked up — and the rest of the industry schedules around them. Competing studios move their own mid-sized titles a week or two away rather than open head-to-head, which is exactly why the second-place film on a tentpole weekend is so often a holdover in its third or fourth week rather than a fresh challenger. Concentration at the top is the product of everyone else voluntarily stepping aside.
The off-season inverts each of those inputs. Screen counts for late-winter releases are smaller and more evenly distributed, no single title commands the premium-format inventory, and the films being released — horror, romantic comedies, mid-budget thrillers, awards holdovers widening after nominations — tend to draw comparably sized audiences. With several titles opening in a similar range and none with the marketing weight to run away, the gap between first and second naturally shrinks. The quiet months are competitive not because the films are better matched by design, but because nothing on the schedule is big enough to bend the market around it.
How the calendar got this way
The May-to-July corridor as a tentpole zone is a relatively modern construction. Through the 1970s and 1980s, summer was important but not sacrosanct, and studios were far more willing to put major releases into spring and early fall. What changed was the industrialization of the opening weekend: as marketing budgets grew and wide releases became the norm, the first three days became the whole game, and studios learned that the surest way to own a weekend was to plant a flag on a date years in advance and dare everyone else to move. The Memorial Day and Fourth of July frames became reservations, then the entire first weekend of May, then the whole month.
Over the same period the “dump month” label stuck to January and August — unfairly, in retrospect. Those months were originally where studios parked films they had little confidence in, but the absence of giants turned them into the most reliable place for a modestly budgeted film to open at No. 1. Horror in particular discovered this and built a business around it. The twenty-year average in the chart above is, in part, a record of that migration: the closer races in the quiet months reflect a market in which studios have learned to fill the gaps with films that are sized to win them.
What it means for audiences and exhibitors
For moviegoers, the practical implication is about choice. A wide gap means the multiplex has effectively become a single-film venue for the weekend: the tentpole occupies most screens and showtimes, and everything else is squeezed into off-peak slots. A narrow gap means the opposite — a handful of films of similar size sharing the building, more variety at the times people actually want to go, and a better chance that the second- or third-choice film is still playing in a full-sized auditorium. Ironically, the months with the most anticipated releases are the months with the least genuine choice at the theater.
For exhibitors the picture is more mixed. Concentrated weekends are lucrative but fragile: the whole month leans on one or two titles, and if one underperforms there is little on the schedule to absorb the shortfall. The quiet months are lower-grossing but more diversified, with the risk spread across several films that each carry a smaller share of the load. Theater chains have argued for years that what they need most is not bigger summers but fuller calendars — a steadier flow of mid-sized releases in the months the majors leave thin. The gap data is one way of quantifying that argument.
Comparing this with what No. 2 tells us
This finding sits alongside our earlier look at the perpetual runner-up, and the two are best read together. That analysis found that the No. 2 slot is disproportionately occupied by holdovers — last week’s winner sliding down a rung — rather than by fresh releases that narrowly lost. The monthly gap chart explains why: in the concentrated months a holdover is usually the only thing left with enough audience to place second at all, while in the quiet months two or three new openers can land close together and the runner-up is far more likely to be a genuine same-weekend rival. The identity of No. 2 and the size of the gap are two views of the same underlying calendar.
The forward look
Two forces could reshape this map. The first is the thinning of the tentpole pipeline: fewer franchise releases per year means fewer weekends where a single film clears the room, and if the majors continue to spread their biggest titles more evenly across the calendar, the gap in months like March and May should narrow. The second is the shortened theatrical window. When a film’s exclusive run is measured in weeks rather than months, holdovers fade faster, which tends to leave the No. 2 slot to fresh openers and could make even the big months look more contested than they historically have been.
Whether either of those shifts is large enough to show up in a twenty-year average is an open question, and one this series will return to as new years are added. For now, the conclusion stands: if you want to see the box office as a race rather than a coronation, the calendar tells you exactly when to look, and it is almost never the weekend everyone is talking about.
Related from the USA Times Data Desk
- The Perpetual Runner-Up: Twenty Years of No. 2 at the Box Office
- The Box-Office Calendar: The Months Movies Take Over
- Box-office coverage index