- ≥ 26.18% of the U.S. (domestic) box office that week, or
- ≥ 6.18% of the global box office that week.
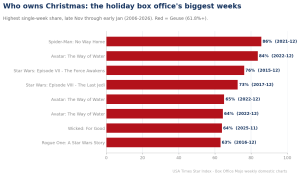
- Geuse — 61.8%+ of the week
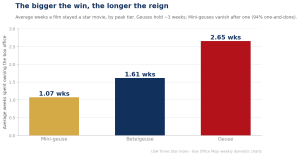
- Betelgeuse — 38.2%–61.8%
- Mini-geuse — 26.18%–38.2%
We ran all 52 weeks of 2025 through the USA Times Star Index — the No. 1 film’s gross as a share of that week’s entire U.S. box office — and marked every week a single film cleared the 26.18% threshold. 27 films owned at least one week of 2025, from A Minecraft Movie (an 80.2% stranglehold in April) down to Now You See Me: Now You Don’t (29.8%).
The year’s sharpest lesson in what this index measures: Mission: Impossible — The Final Reckoning opened to $95 million and still never owned a week — it had the misfortune of debuting the same week Lilo & Stitch took $217 million, so the pie was so big Mission got only ~24% of it. Owning a week is about dominance, not raw size.
Three tiers of event — set by the golden ratio
| Tier | Weekly share of U.S. box office | 2025 films |
|---|---|---|
| Geuse | 61.8%+ | 3 |
| Betelgeuse | 38.2–61.8% | 18 |
| Mini-geuse | 26.18–38.2% | 6 |
26.18%, 38.2% and 61.8% are all golden-ratio points.
Batmandir · Guest Passes Step inside for a day. Guest passes from $161/day — brought in by a member. See guest passes →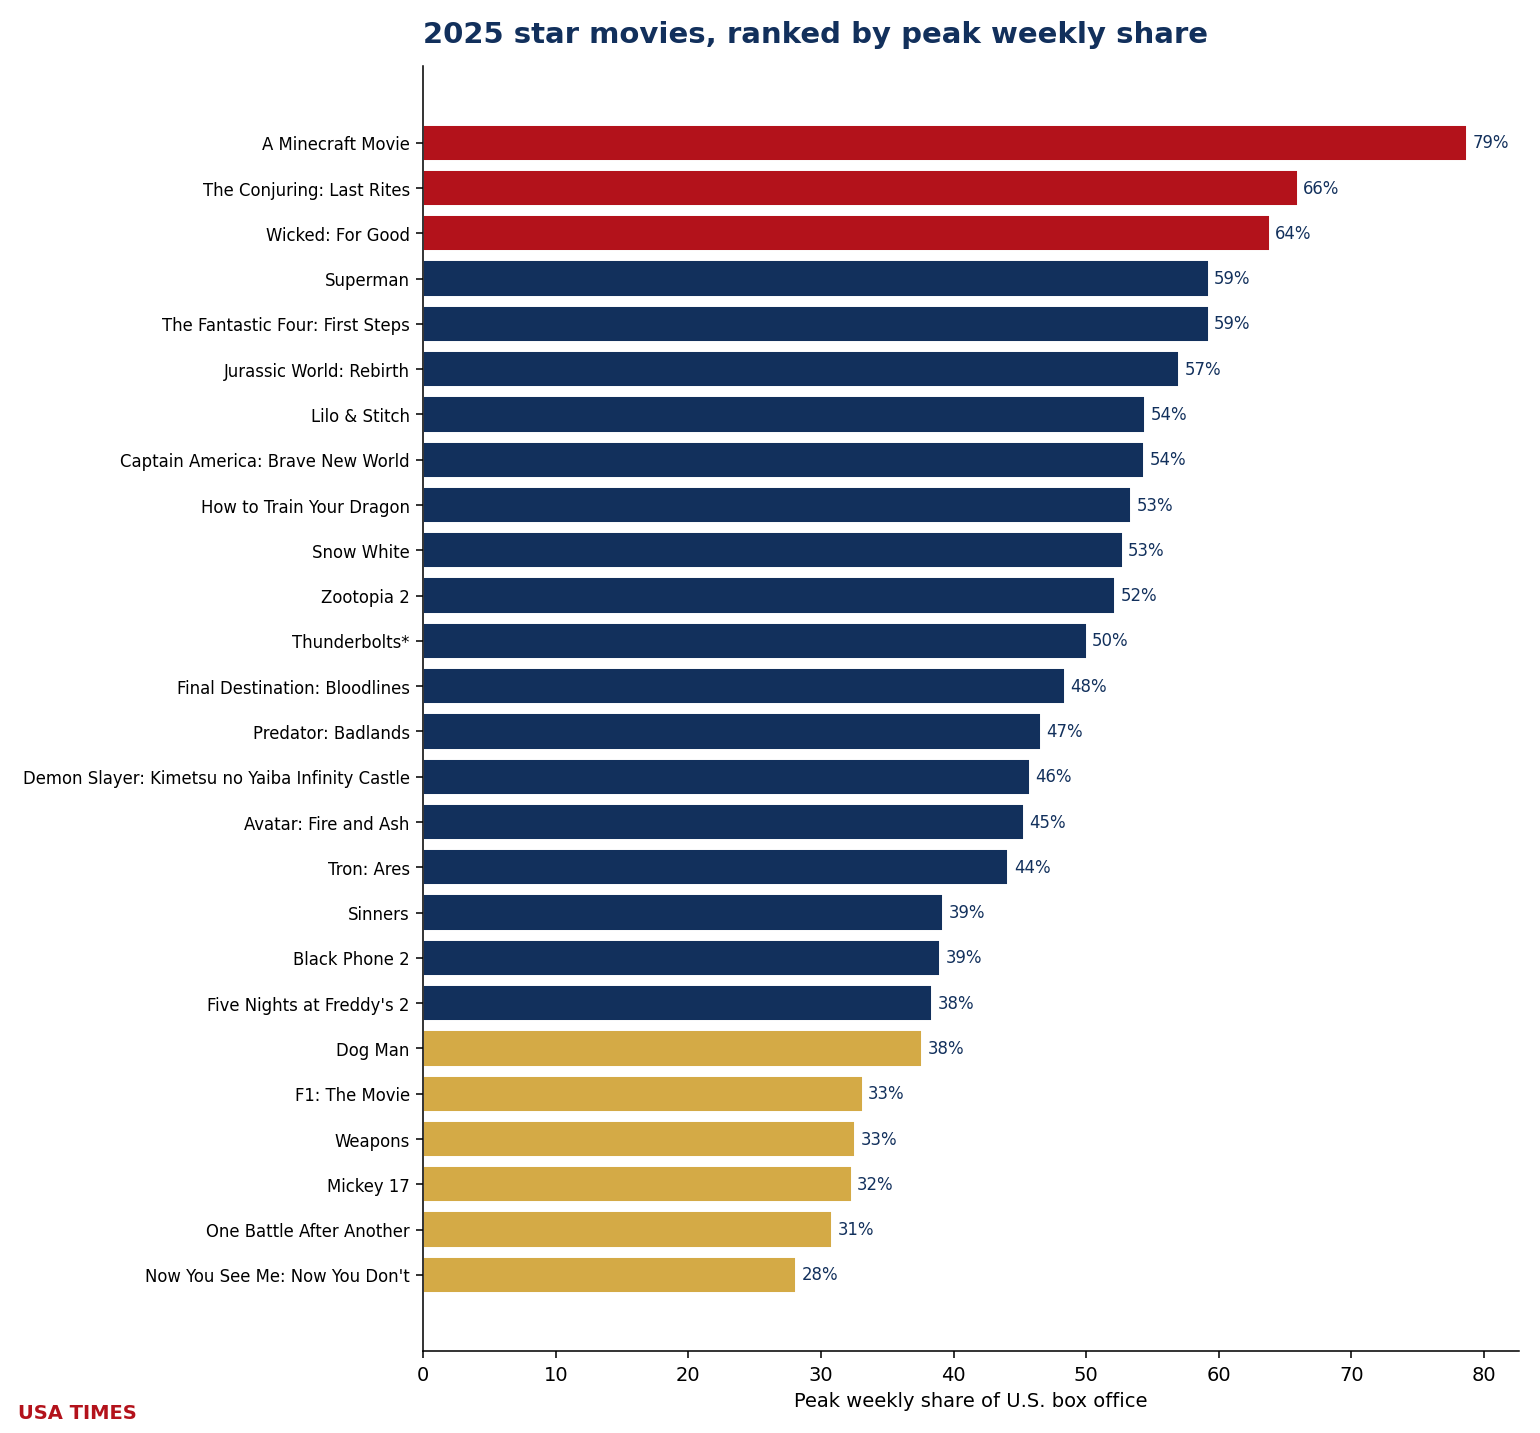
The 27 star movies of 2025 — and which made money
The last column is the USA Times profitability signal: worldwide box office ÷ production budget. Green ▲ beat its budget; red ▼ did not. Two films owned a week of America and still lost money — Tron: Ares (0.65×) and Snow White (0.82×) — and Mickey 17 only scraped over the line. (A film generally needs ~2–2.5× its budget to break even after marketing.)
| # | Film | Peak share | Tier | Worldwide | WW ÷ budget |
|---|---|---|---|---|---|
| 1 | The Conjuring: Last Rites* | 87.2% | Geuse | $492M | 8.9× ▲ |
| 2 | A Minecraft Movie | 80.2% | Geuse | $955M | 6.4× ▲ |
| 3 | Wicked: For Good | 64.8% | Geuse | $541M | 3.6× ▲ |
| 4 | The Fantastic Four: First Steps | 60.2% | Betelgeuse | $521M | 2.6× ▲ |
| 5 | Superman | 59.8% | Betelgeuse | $619M | 2.8× ▲ |
| 6 | Jurassic World: Rebirth | 58.1% | Betelgeuse | $867M | 4.8× ▲ |
| 7 | Snow White | 55.9% | Betelgeuse | $205M | 0.82× ▼ |
| 8 | Captain America: Brave New World | 55.3% | Betelgeuse | $415M | 2.3× ▲ |
| 9 | Lilo & Stitch | 54.9% | Betelgeuse | $1,037M | 10.4× ▲ |
| 10 | How to Train Your Dragon | 54.3% | Betelgeuse | $634M | 4.2× ▲ |
| 11 | Zootopia 2 | 53.2% | Betelgeuse | $1,800M | 12.0× ▲ |
| 12 | Thunderbolts | 51.5% | Betelgeuse | $382M | 2.1× ▲ |
| 13 | Final Destination: Bloodlines | 50.0% | Betelgeuse | $285M | 5.7× ▲ |
| 14 | Predator: Badlands | 48.8% | Betelgeuse | $184M | 1.8× ▲ |
| 15 | Demon Slayer: Infinity Castle | 46.6% | Betelgeuse | $737M | 36.9× ▲ |
| 16 | Tron: Ares | 46.3% | Betelgeuse | $142M | 0.65× ▼ |
| 17 | Avatar: Fire and Ash | 46.1% | Betelgeuse | $1,486M | 5.9× ▲ |
| 18 | Black Phone 2 | 41.8% | Betelgeuse | $120M | 4.0× ▲ |
| 19 | Sinners | 40.2% | Betelgeuse | $366M | 4.1× ▲ |
| 20 | Dog Man | 39.1% | Betelgeuse | $236M | 5.9× ▲ |
| 21 | Five Nights at Freddy’s 2 | 39.1% | Betelgeuse | $180M | 4.5× ▲ |
| 22 | Taylor Swift: Release Party of a Showgirl | 37.4% | Mini-geuse | — | — |
| 23 | Mickey 17 | 35.8% | Mini-geuse | $132M | 1.1× ▲ |
| 24 | Weapons | 33.6% | Mini-geuse | $270M | 7.1× ▲ |
| 25 | F1: The Movie | 33.5% | Mini-geuse | $606M | 2.4× ▲ |
| 26 | One Battle After Another | 32.2% | Mini-geuse | $200M | 1.5× ▲ |
| 27 | Now You See Me: Now You Don’t | 29.8% | Mini-geuse | $180M | 2.0× ▲ |
Worldwide grosses via Box Office Mojo; budgets are reported studio/press estimates (approximate). *The Conjuring: Last Rites week-36 figures are reconstructed from the following week’s decline (Box Office Mojo’s week-36 page failed to load) and will be verified.
The most eventful movies of 2025
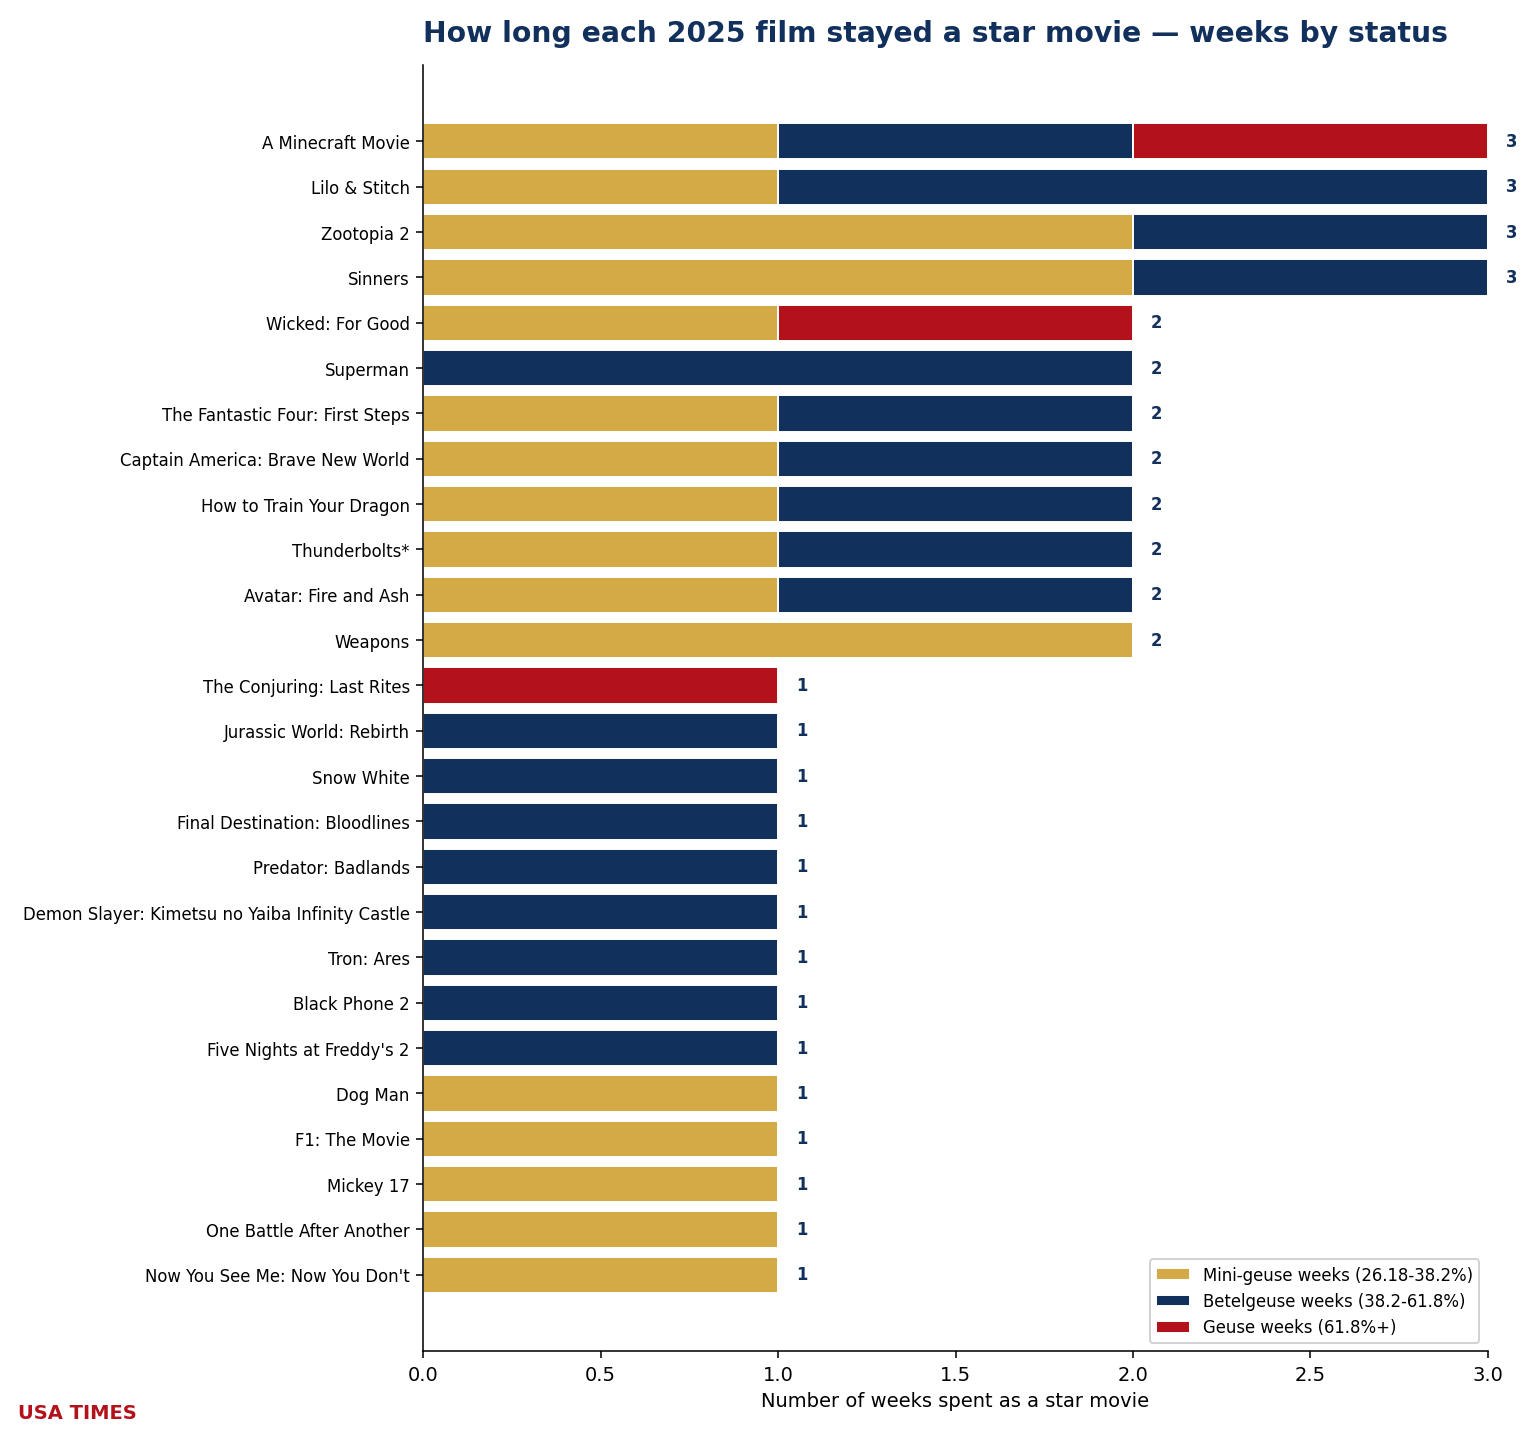
Staying power, not peak height, is the real measure of a reign. The 2025 leaderboard:
- A Minecraft Movie — 3 weeks in event status (1 as a Geuse), peak 80.2%.
- Captain America: Brave New World — 3 weeks in event status, peak 55.3%.
- Lilo & Stitch — 3 weeks in event status, peak 54.9%.
- Zootopia 2 — 3 weeks in event status, peak 53.2%.
- Sinners — 3 weeks in event status, peak 40.2%.
- Wicked: For Good — 2 weeks in event status (1 as a Geuse), peak 64.8%.
At the other end, 14 of the 27 owned exactly one week and vanished — the one-week wonders. Across all 27 films, 2025 produced its event weeks in the same feast-and-famine rhythm as 2024.
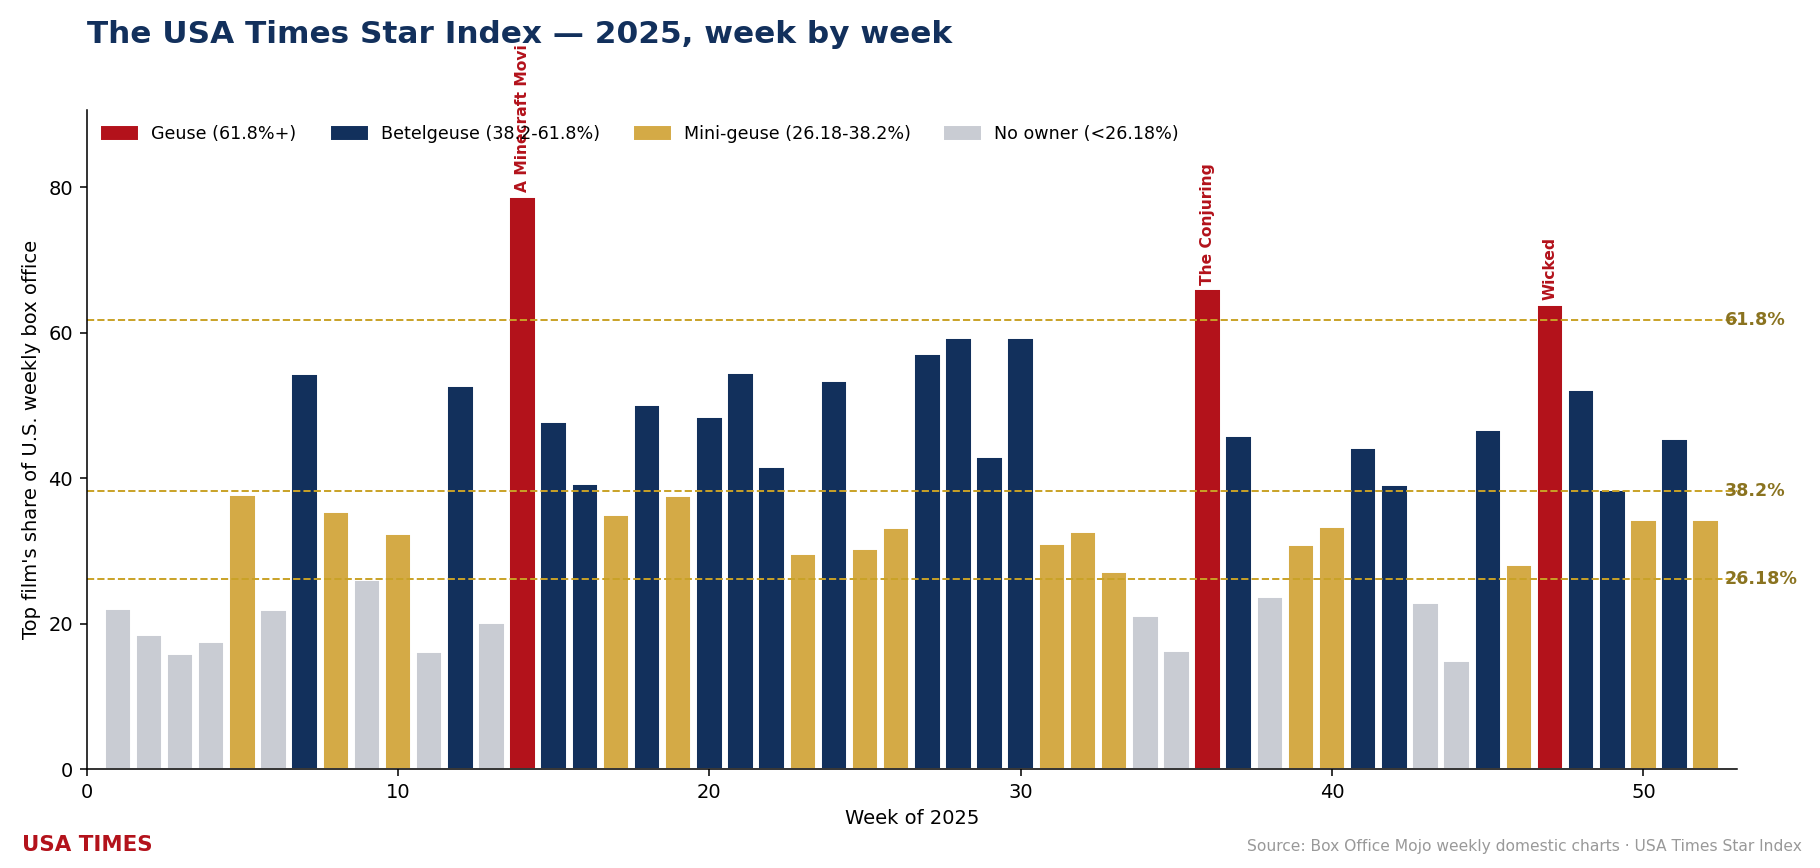
Week by week: the Star Index
| Wk | Week starting | Who owned the week | Share | U.S. total |
|---|---|---|---|---|
| 1 | 2025-01-03 | No owner | 22.7% | $136M |
| 2 | 2025-01-10 | No owner | 19.2% | $102M |
| 3 | 2025-01-17 | No owner | 17.0% | $107M |
| 4 | 2025-01-24 | No owner | 18.8% | $81M |
| 5 | 2025-01-31 | Dog Man | 39.1% | $103M |
| 6 | 2025-02-07 | No owner | 24.2% | $69M |
| 7 | 2025-02-14 | Captain America: Brave New World | 55.3% | $204M |
| 8 | 2025-02-21 | Captain America: Brave New World | 38.1% | $94M |
| 9 | 2025-02-28 | Captain America: Brave New World | 29.3% | $66M |
| 10 | 2025-03-07 | Mickey 17 | 35.8% | $72M |
| 11 | 2025-03-14 | No owner | 17.8% | $68M |
| 12 | 2025-03-21 | Snow White | 55.9% | $94M |
| 13 | 2025-03-28 | No owner | 21.1% | $97M |
| 14 | 2025-04-04 | A Minecraft Movie | 80.2% | $250M |
| 15 | 2025-04-11 | A Minecraft Movie | 49.4% | $209M |
| 16 | 2025-04-18 | Sinners + A Minecraft Movie 28.0% | 40.2% | $193M |
| 17 | 2025-04-25 | Sinners | 35.9% | $193M |
| 18 | 2025-05-02 | Thunderbolts | 51.5% | $185M |
| 19 | 2025-05-09 | Thunderbolts + Sinners 28.9% | 39.3% | $111M |
| 20 | 2025-05-16 | Final Destination: Bloodlines | 50.0% | $140M |
| 21 | 2025-05-23 | Lilo & Stitch | 54.9% | $396M |
| 22 | 2025-05-30 | Lilo & Stitch | 42.3% | $204M |
| 23 | 2025-06-06 | Lilo & Stitch | 30.2% | $158M |
| 24 | 2025-06-13 | How to Train Your Dragon | 54.3% | $228M |
| 25 | 2025-06-20 | How to Train Your Dragon | 30.7% | $186M |
| 26 | 2025-06-27 | F1: The Movie | 33.5% | $249M |
| 27 | 2025-07-04 | Jurassic World: Rebirth | 58.1% | $235M |
| 28 | 2025-07-11 | Superman | 59.8% | $297M |
| 29 | 2025-07-18 | Superman | 43.7% | $199M |
| 30 | 2025-07-25 | The Fantastic Four: First Steps | 60.2% | $263M |
| 31 | 2025-08-01 | The Fantastic Four: First Steps | 31.9% | $177M |
| 32 | 2025-08-08 | Weapons | 33.6% | $191M |
| 33 | 2025-08-15 | Weapons | 28.0% | $129M |
| 34 | 2025-08-22 | No owner | 22.2% | $99M |
| 35 | 2025-08-29 | No owner | 16.9% | $92M |
| 36 | 2025-09-05 | The Conjuring: Last Rites | 87.2% | $120M |
| 37 | 2025-09-12 | Demon Slayer: Infinity Castle | 46.6% | $188M |
| 38 | 2025-09-19 | No owner | 25.7% | $92M |
| 39 | 2025-09-26 | One Battle After Another | 32.2% | $98M |
| 40 | 2025-10-03 | Taylor Swift: Release Party of a Showgirl | 37.4% | $91M |
| 41 | 2025-10-10 | Tron: Ares | 46.3% | $94M |
| 42 | 2025-10-17 | Black Phone 2 | 41.8% | $86M |
| 43 | 2025-10-24 | No owner | 25.1% | $99M |
| 44 | 2025-10-31 | No owner | 16.7% | $72M |
| 45 | 2025-11-07 | Predator: Badlands | 48.8% | $109M |
| 46 | 2025-11-14 | Now You See Me: Now You Don’t | 29.8% | $93M |
| 47 | 2025-11-21 | Wicked: For Good | 64.8% | $320M |
| 48 | 2025-11-28 | Zootopia 2 + Wicked: For Good 32.6% | 53.2% | $223M |
| 49 | 2025-12-05 | Five Nights at Freddy’s 2 + Zootopia 2 28.4% | 39.1% | $194M |
| 50 | 2025-12-12 | Zootopia 2 + Five Nights at Freddy’s 2 26.4% | 36.5% | $98M |
| 51 | 2025-12-19 | Avatar: Fire and Ash | 46.1% | $334M |
| 52 | 2025-12-26 | Avatar: Fire and Ash | 34.6% | $325M |
Red-shaded = Geuse; blue-shaded = Betelgeuse; gray = no owner. “+” marks weeks a second film also cleared 26.18%. Weekly total = sum of all films grossing ≥ $1M that week per Box Office Mojo (captures ~99% of the week; the sub-$1M tail is excluded).
Never four in a week
Five weeks of 2025 had two simultaneous owners — Sinners and A Minecraft Movie; Zootopia 2 and Wicked: For Good twice in the holidays — but never three, and never four. The arithmetic (4 × 26.18% > 100%) holds another year.
Where the events cluster
Owned weeks are not spread evenly across the calendar. Star-weeks by month in 2025: Jan 0, Feb 3, Mar 3, Apr 4, May 5, Jun 4, Jul 4, Aug 3, Sep 3, Oct 3, Nov 4, Dec 4. They bunch into the summer tent-pole run and the holiday corridor and thin out in the January and early-autumn lulls — the pattern our 20-year index is built to test.
How we built this
For each week we divided the No. 1 film’s weekly domestic gross by that week’s total domestic box office (the sum of all films grossing ≥ $1M, per Box Office Mojo’s weekly charts), and checked the No. 2 film for two-owner weeks. A film is a star movie if its share reached 26.18% in any week; its tier is set by its peak. The profitability signal divides worldwide gross (Box Office Mojo) by reported production budget. No share here is invented.
Sources: Box Office Mojo weekly domestic charts (2025, weeks 1–52); worldwide grosses and budget estimates via Box Office Mojo and The Numbers. Method: USA Times Star Index. See also the USA Times definition of a star movie.
2006–2023 open in the 20-year index; 2024, 2025 and 2026 have their own pages.
Related from the USA Times Data Desk
- The Star Movies of Indian Cinema, 2025: Dhamaka, Toofan, Tsunami
- Wikipedia Credits a 1982 Bollywood Film With Nearly Double Sholay's Gross. Its Citations Are About Completely Different Movies.
- The Star Movies of 2026, So Far (Updated Weekly)
- The Star Movies of 2024: Every Film That Took Over a Week at the Box Office
- Box-office coverage index · the Star Index methodology
Sources
- Box Office Mojo — Weekend Domestic Box Office
- Box Office Mojo — Yearly Domestic Box Office
- The Numbers — Weekly Box Office Chart
- USA Times — Star Index methodology & data sources