Browse all our box-office analysis in one place: the complete coverage index.
For full definitions, thresholds, data sources, and limitations, see our Star Index methodology.
- ≥ 26.18% of the U.S. (domestic) box office that week, or
- ≥ 6.18% of the global box office that week.
- Geuse — 61.8%+ of the week
- Betelgeuse — 38.2%–61.8%
- Mini-geuse — 26.18%–38.2%
This is the master ledger of the USA Times Star Index, and as of this edition it is complete: every film that, in any single week between 2006 and 2025, captured at least 26.18% of the U.S. box office — the USA Times definition of a star movie. Twenty consecutive years — 2006 through 2025 — are now in the ledger, measured week by week from Box Office Mojo’s weekly charts, graded into the three golden-ratio tiers, and checked for profitability (worldwide gross ÷ reported budget). That is 1,043 chart weeks and 437 owner-seasons of evidence, reaching back past the pandemic into the fourteen normal years of the old theatrical world. The pandemic year is measured under a dark-market rule: the 22 weeks of 2020 in which national grosses collapsed below $5 million are recorded but excluded from star-movie status. 2026 runs live on its own tracker.
Batmandir · Guest Passes Step inside for a day. Guest passes from $161/day — brought in by a member. See guest passes →The complete index, 2006–2025
 USA Times Billion-Dollar Club: one S2 star per $1 billion in worldwide gross (floor). Two stars = crossed $2B.
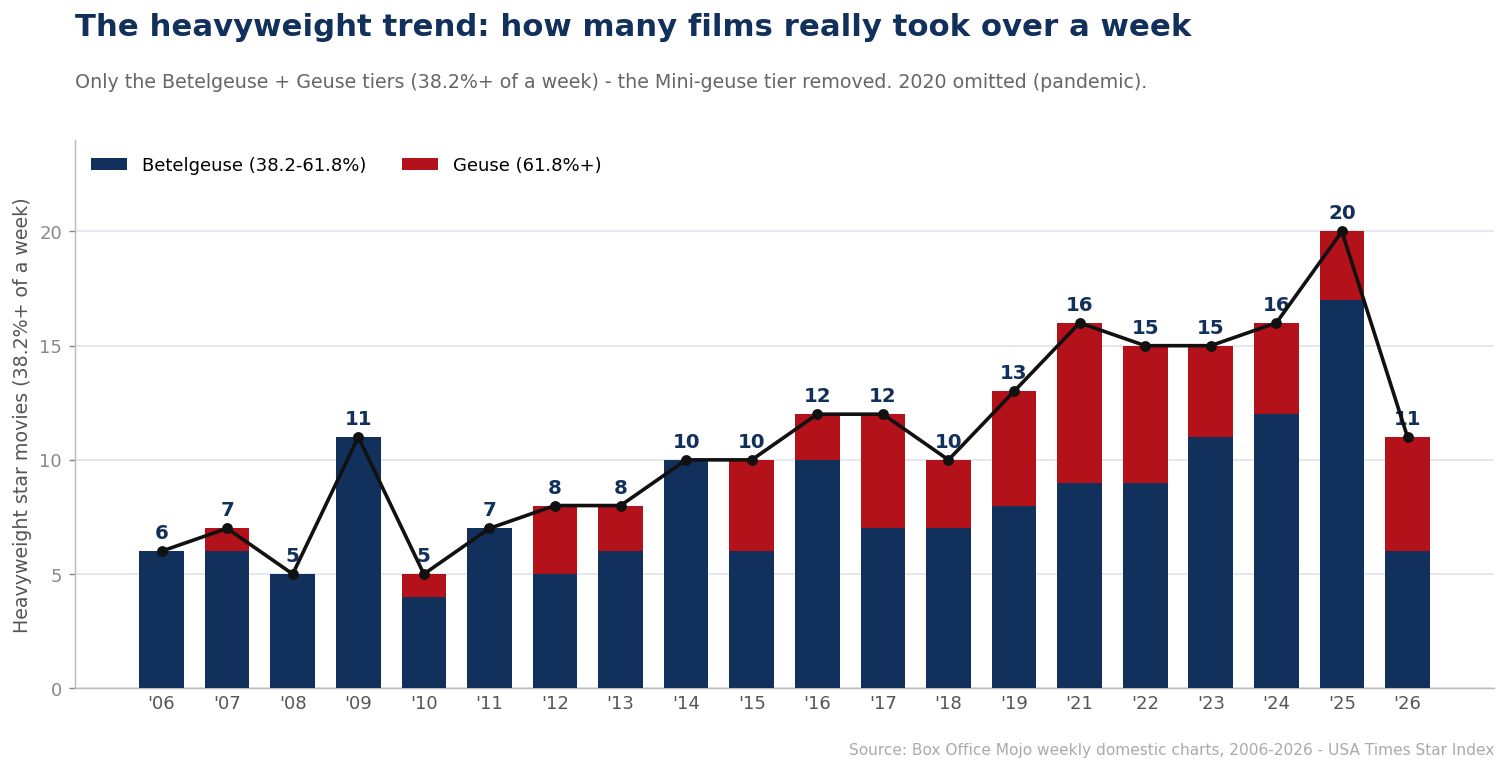
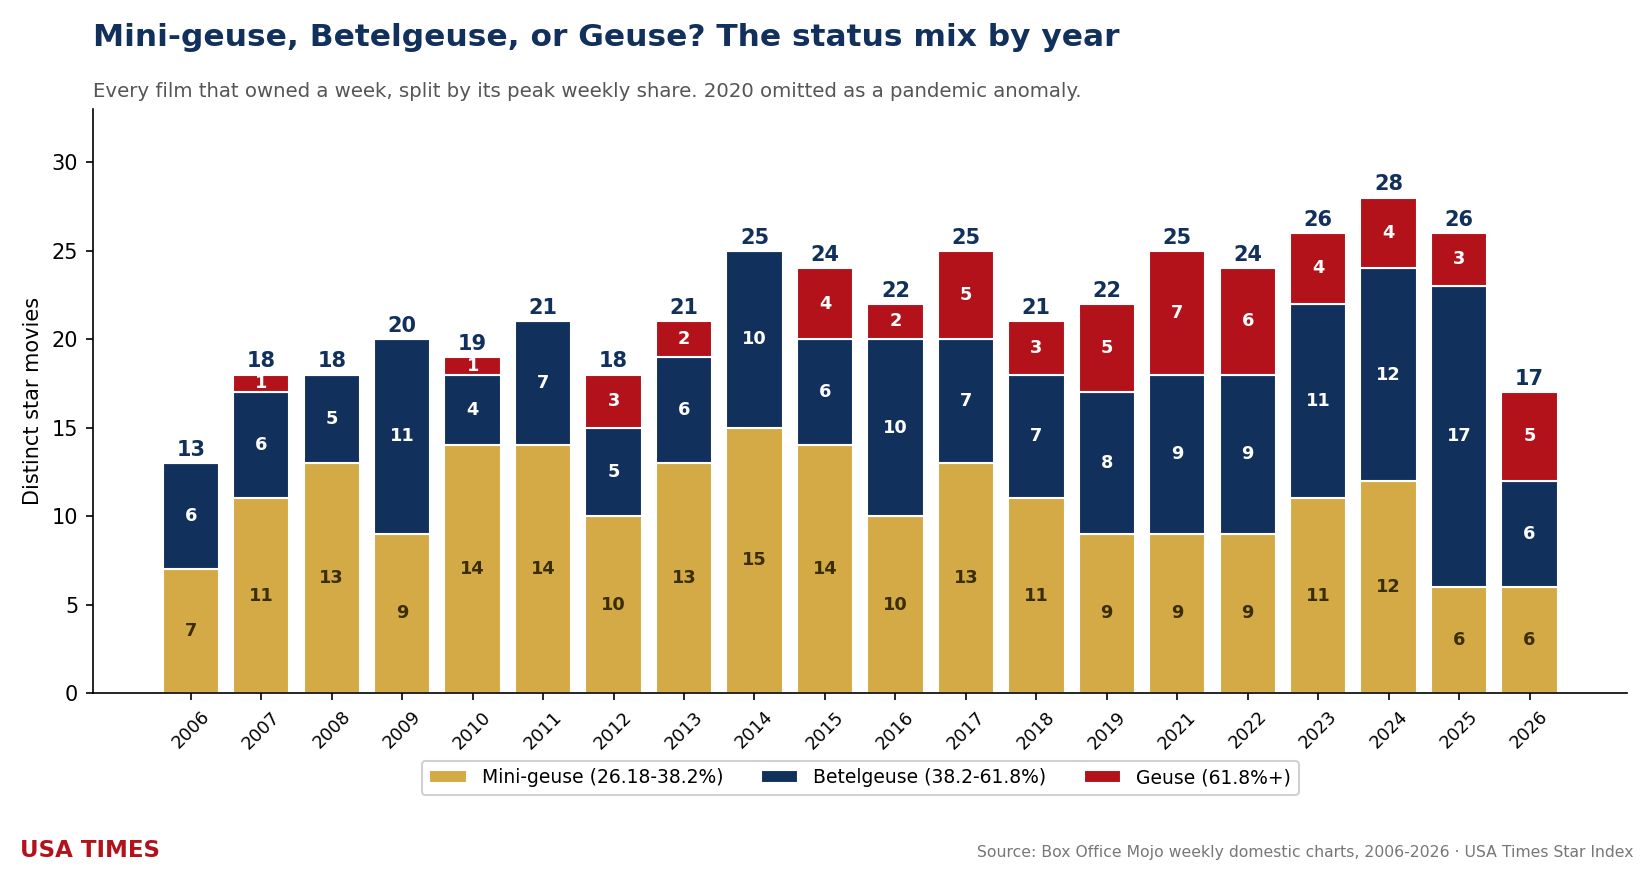
The number barely moves. Nineteen of the twenty years land between 17 and 28 star movies, and the one exception is the very first year in the ledger: 2006 at 13, the all-time floor. The mean across the whole run is 21.9 a year and the median is 21.5. There is a modest drift upward — the first decade averages 19.7 owners a year, the second 24.0 — but that is a movement of about four films a year across two decades in which the domestic market swung from $9.1 billion to $11.8 billion and back down to $8.6 billion, admission prices roughly doubled, and the entire streaming industry was born and matured. The ceiling is 2024 at 28. The audience appears to have a roughly fixed appetite for films that take over a week, and the industry, whatever else changes, keeps supplying about that many.
The market-size staircase. Among the fourteen pre-pandemic years the smallest market is 2006 at $9.107 billion, followed by 2008 ($9.576B) and 2007 ($9.580B); the largest is 2018 at $11.844 billion, about 30% more money in the same number of weeks. Yet those three smallest markets produced 13, 18 and 18 star movies and the largest produced 21. Market size sets how much money an owner collects; it does not set how many owners there are.
| Year | Mini-geuse movies | Geuse | Betelgeuse | Mini-geuse | Owned / empty wks | Concentration | Biggest single week | Longest hold | Owned a week, lost money |
|---|---|---|---|---|---|---|---|---|---|
| 2006 | 13 | 0 | 6 | 7 | 15 / 37 | 13.1% | Pirates of the Caribbean: Dead Man’s Chest (60.2%) | Pirates of the Caribbean: Dead Man’s Chest and Ice Age 2: The Meltdown (2 wks each) | none below 1× — but Superman Returns (1.45×) still lost money after marketing |
| 2007 | 18 | 1 | 6 | 11 | 20 / 32 | 19.1% | Spider-Man 3 (78.1%) | Spider-Man 3, Shrek the Third and two others (2 wks each) | none below 1× — but Rush Hour 3 (1.84×) and Bee Movie (1.96×) still lost money after marketing |
| 2008 | 18 | 0 | 5 | 13 | 20 / 32 | 17.9% | Iron Man (61.2%) | Iron Man and The Dark Knight (2 wks each) | none below 1× — but The Incredible Hulk (1.77×) and The Chronicles of Narnia: Prince Caspian (1.87×) still lost money after marketing |
| 2009 | 20 | 0 | 11 | 9 | 23 / 29 | 19.8% | X-Men Origins: Wolverine (51.4%) | Star Trek, Avatar and two others (2 wks each) | none below 1× — but Watchmen (1.43×) and G.I. Joe: The Rise of Cobra (1.73×) still lost money after marketing |
| 2010 | 19 | 1 | 4 | 14 | 27 / 26 | 20.9% | Iron Man 2 (69.8%) | Alice in Wonderland and Avatar (3 wks each) | none — floor: Tron: Legacy, 2.35× |
| 2011 | 21 | 0 | 7 | 14 | 23 / 29 | 18.8% | Harry Potter and the Deathly Hallows: Part 2 (60.2%) | Transformers: Dark of the Moon and Puss in Boots (2 wks each) | none below 1× — but Green Lantern (1.19×) and Rango (1.82×) still lost money after marketing |
| 2012 | 18 | 3 | 5 | 10 | 24 / 28 | 23.3% | The Avengers (79.7%) | The Avengers and The Dark Knight Rises (3 wks each) | none — floor: Snow White and the Huntsman, 2.33× |
| 2013 | 21 | 2 | 6 | 13 | 25 / 27 | 22.9% | Iron Man 3 (78.3%) | The Hunger Games: Catching Fire and Gravity (3 wks each) | none — floor: Oz the Great and Powerful, 2.29× |
| 2014 | 25 | 0 | 10 | 15 | 29 / 23 | 23.7% | The Amazing Spider-Man 2 (57.3%) | The Hunger Games: Mockingjay – Part 1 (3 wks) | none — floor: Noah, 2.87× |
| 2015 | 24 | 4 | 6 | 14 | 31 / 21 | 35.8% | Avengers: Age of Ultron (80.4%) | Jurassic World and American Sniper (3 wks each) | none — floor: The Peanuts Movie, 2.49× |
| 2016 | 22 | 2 | 10 | 10 | 34 / 19 | 30.6% | Captain America: Civil War (74.0%) | The Jungle Book, Deadpool and Zootopia (3 wks each) | none below 1× — but Ghostbusters (1.59×), The Magnificent Seven (1.80×) and Star Trek Beyond (1.86×) still lost money after marketing |
| 2017 | 25 | 5 | 7 | 13 | 32 / 20 | 32.2% | Guardians of the Galaxy Vol. 2 (73.7%) | Guardians of the Galaxy Vol. 2 and Beauty and the Beast (3 wks each) | none below 1× — but Blade Runner 2049 (1.45×) still lost money after marketing |
| 2018 | 21 | 3 | 7 | 11 | 29 / 23 | 29.2% | Avengers: Infinity War (81.3%) | Black Panther (4 wks) | none below 1× — but Solo: A Star Wars Story (1.43×) still lost money after marketing |
| 2019 | 22 | 5 | 8 | 9 | 31 / 21 | 36.7% | Avengers: Endgame (88.3%) | Avengers: Endgame, The Lion King and two others (3 wks each) | none — floor: Dumbo, 2.08× |
| 2020* | 17 | 3 | 1 | 13 | 25 / 5 | 26.4% | The Croods: A New Age (67.9%†) | Tenet (6 wks) | Let Him Go 0.55× and The New Mutants 0.73× (five owners under 1×) |
| 2021 | 28 | 7 | 10 | 11 | 43 / 10 | 48.9% | Spider-Man: No Way Home (85.6%) | Godzilla vs. Kong and Shang-Chi and the Legend of the Ten Rings (4 wks each) | Wonder Woman 1984 0.85× and The Suicide Squad 0.91× |
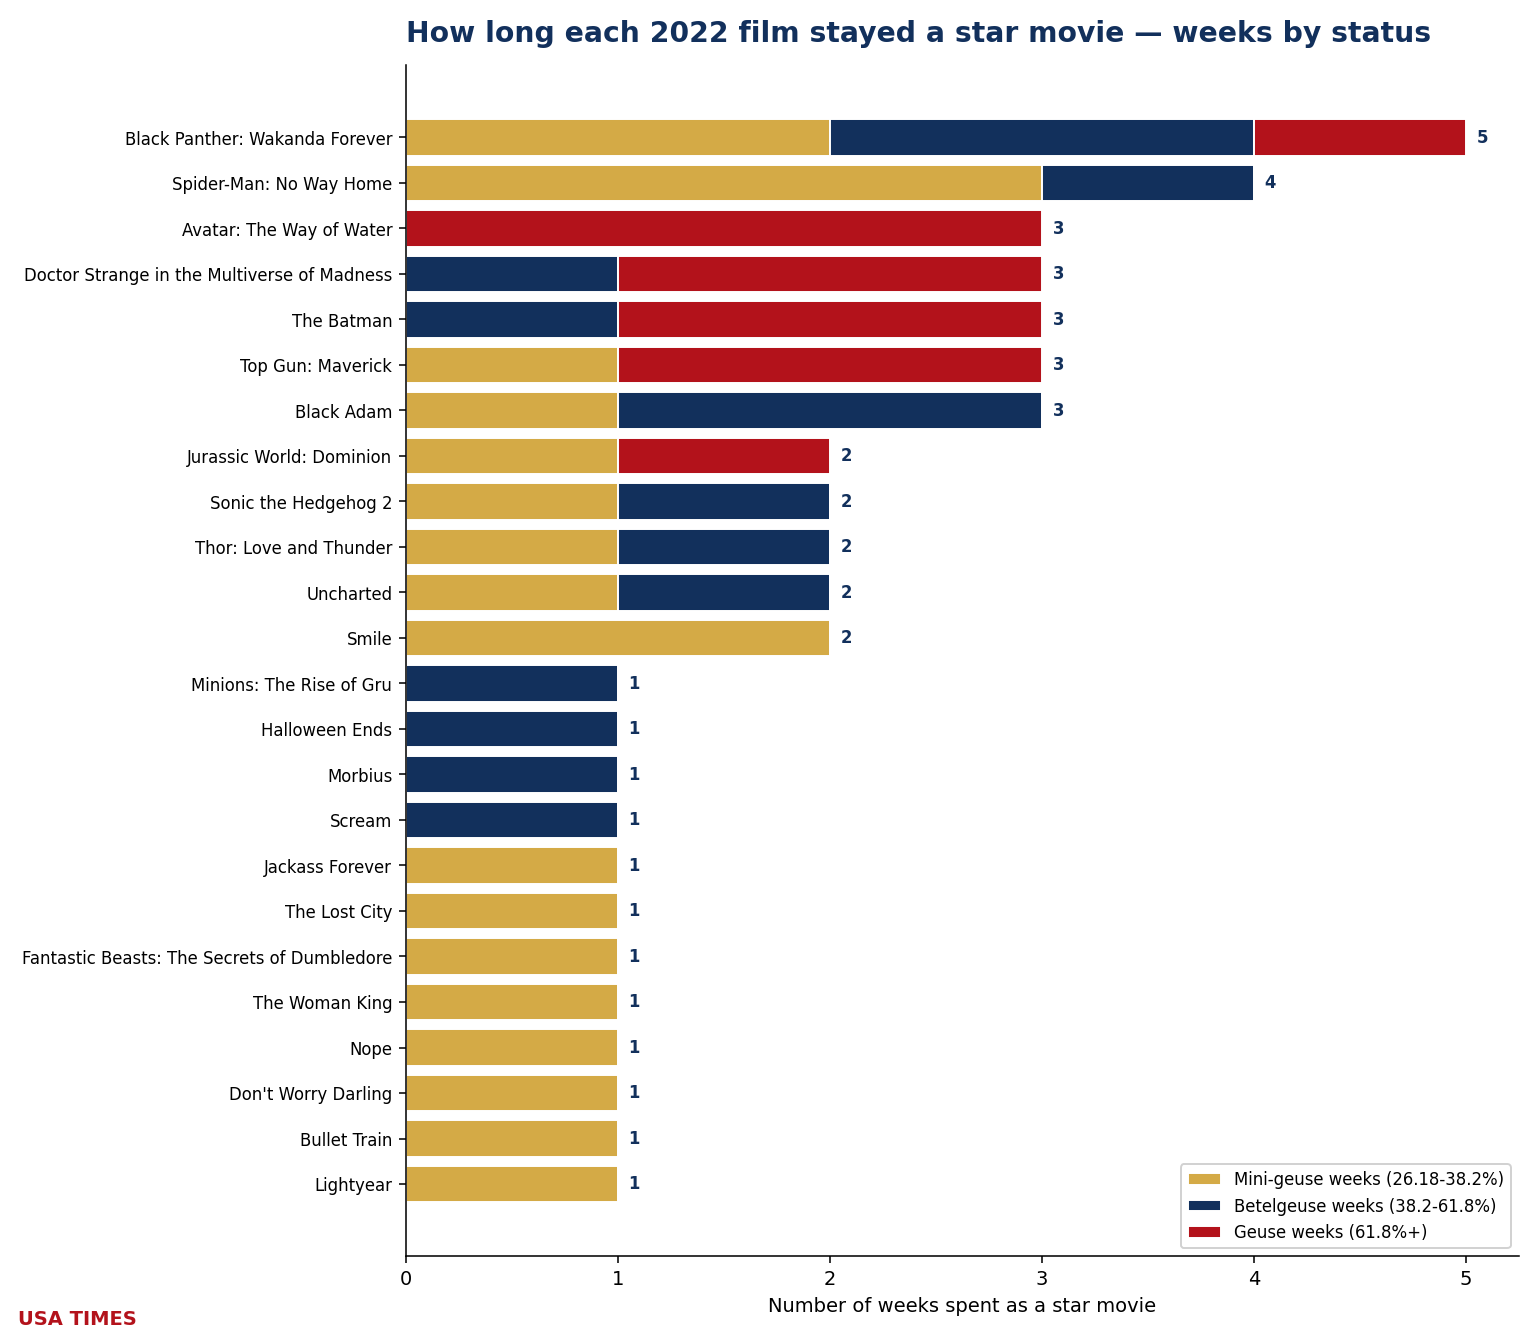
| 2022 | 24 | 6 | 9 | 9 | 42 / 10 | 49.9% | Black Panther: Wakanda Forever (86.1%) | Black Panther: Wakanda Forever (5 wks) | none below 1× — but Lightyear (1.13×) and The Woman King (1.95×) still lost money after marketing |
| 2023 | 26 | 4 | 11 | 11 | 36 / 16 | 37.3% | Guardians of the Galaxy Vol. 3 (73.0%) | The Super Mario Bros. Movie (5 wks) | The Marvels 0.76× and Killers of the Flower Moon 0.79× |
| 2024 | 28 | 4 | 12 | 12 | 38 / 14 | 42.2% | Inside Out 2 (73.3%) | Inside Out 2, Beetlejuice Beetlejuice and four others (3 wks each) | Argylle 0.48× and Red One 0.74× |
| 2025 | 27 | 3 | 17 | 7 | 39 / 13 | 41.7% | A Minecraft Movie (78.7%) | A Minecraft Movie, Lilo & Stitch and two others (3 wks each) | Tron: Ares 0.65× and Snow White 0.76× |
“Geuse/Betelgeuse/Mini-geuse” = films whose peak week fell in each golden-ratio tier (61.8%+, 38.2–61.8%, 26.18–38.2%). “Owned / empty weeks” counts measurable weeks with and without an owner. *2020 is scored on its 30 measurable weeks; †pandemic-market peaks are recorded in-year but are not eligible for all-time records. 2024 and 2025 also have full standalone pages; 2026 runs on its own live tracker.
Seasonality: when the owners show up
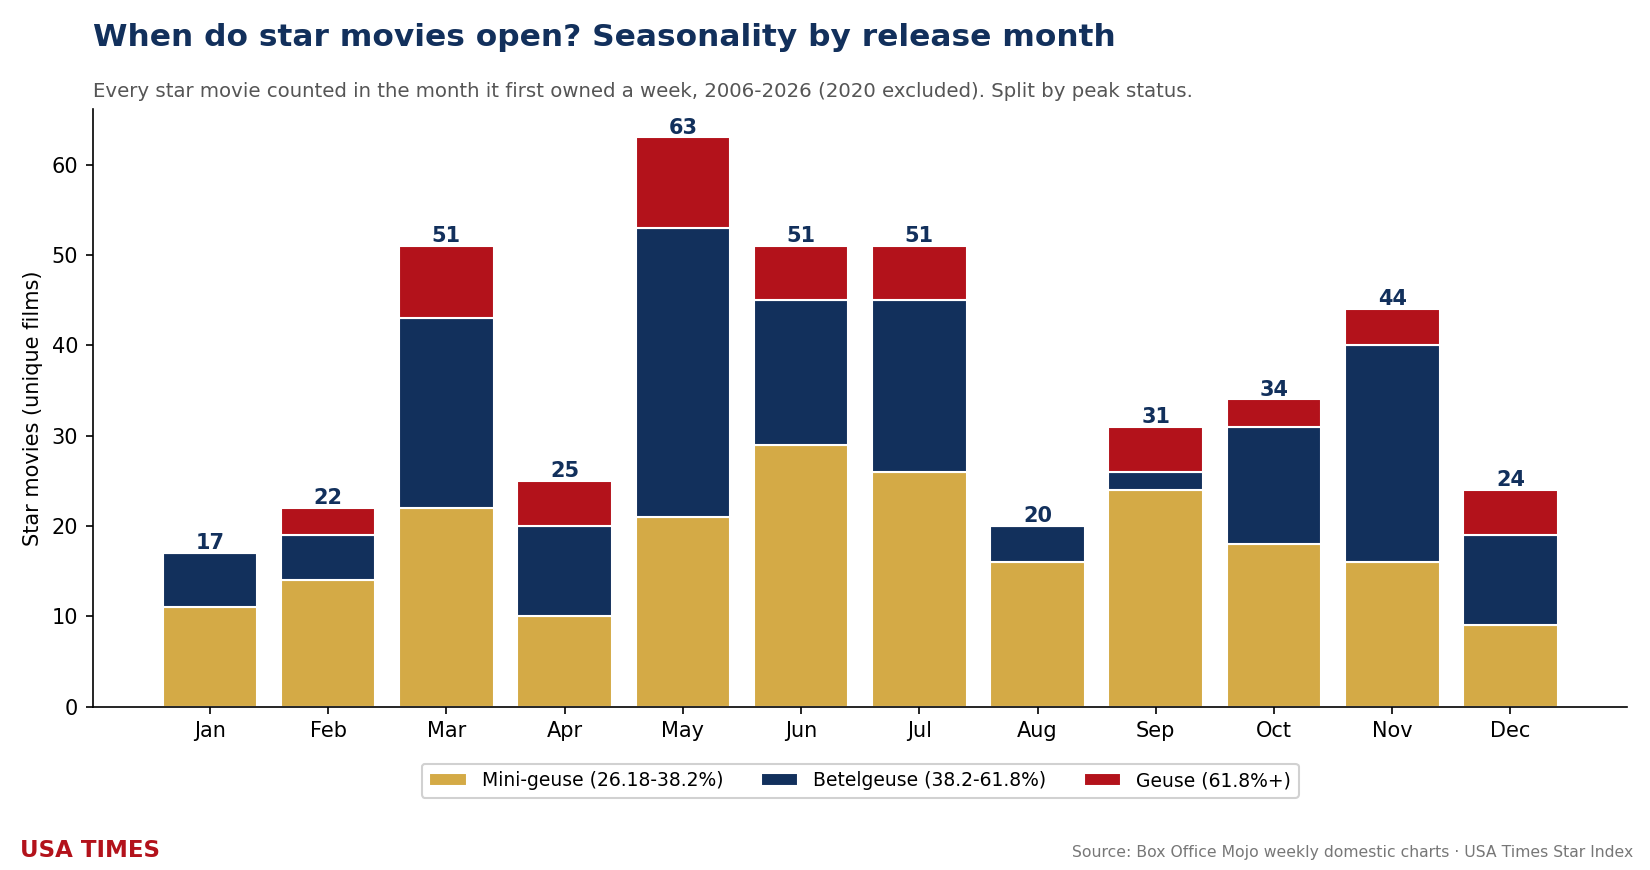
Across all twenty years, May is the owner factory: 77 of its 84 weeks — 92% — had a film at 26.18% or better. March and July tie next at 75% each, with June (71%) and November (71%) close behind. At the other end sit the two genuine dead zones: January (32%) and August (33%), where two weeks in three pass with nobody in charge, and February (40%) not far behind. The pattern is remarkably stable: the summer and the pre-Christmas corridor are where studios put the films designed to own a week, and the post-holiday and late-summer troughs are where they put everything else.
Concentration: the owners are taking more of the room
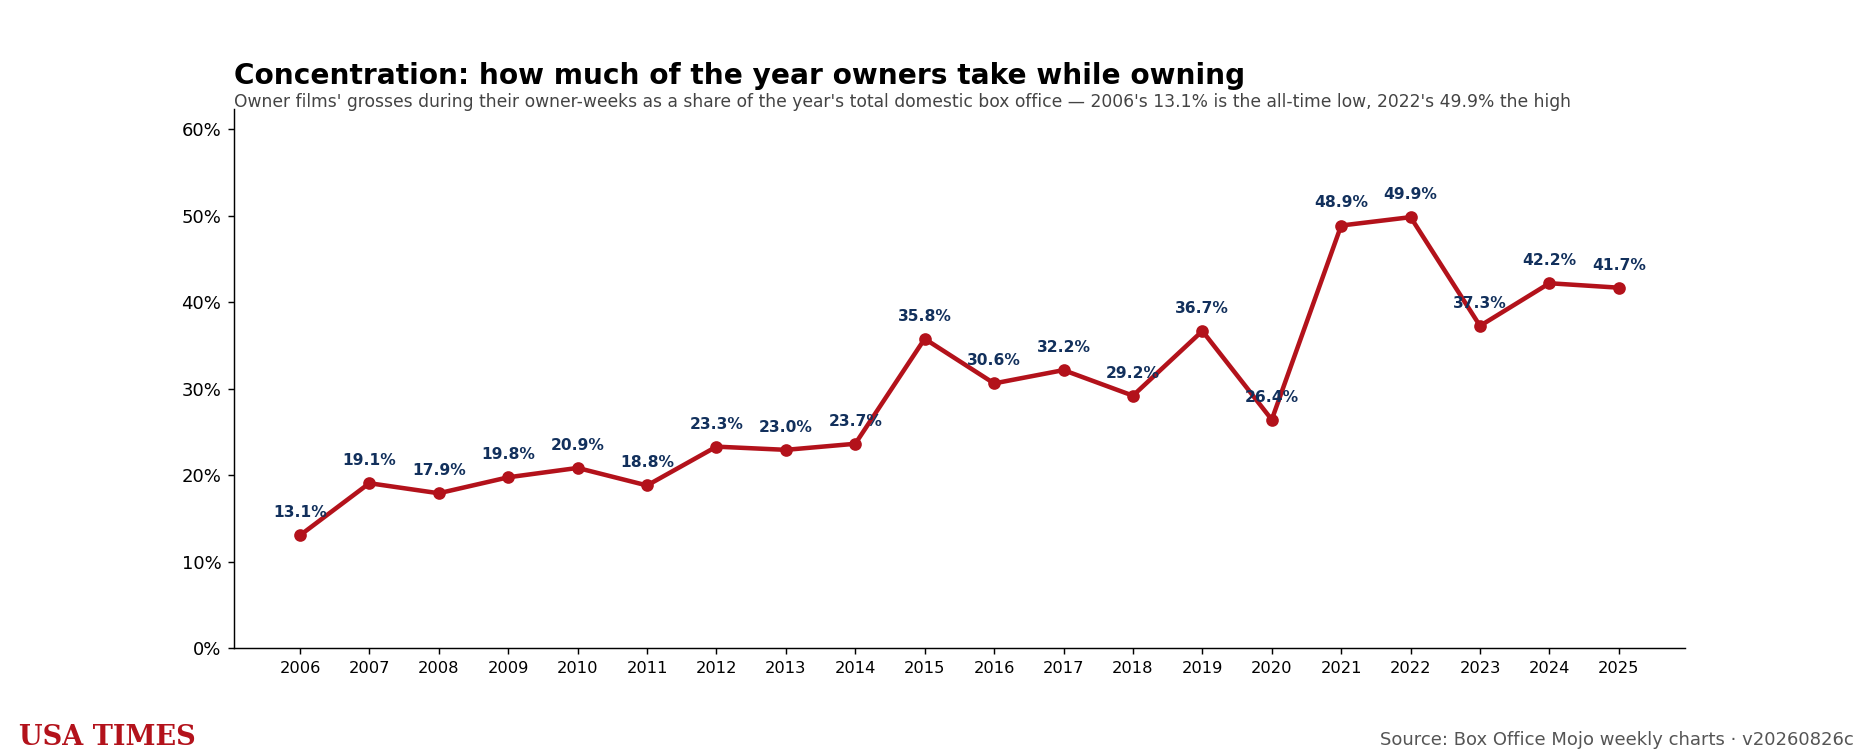
This is the number that has moved. Concentration — what the owners take, during the weeks they own, as a share of the whole year’s domestic box office — averaged 19.0% across 2006–2012 and 44.0% across 2021–2025. The all-time low is 2006’s 13.1%; the all-time high is 2022’s 49.9%. The count of star movies is nearly flat, but each one now swallows a far larger share of the year. The mid-budget film that used to absorb the other three-quarters of the calendar is the thing that actually disappeared — not the blockbuster, which arrives at the same rate it always did.
The predictive read: which release slots reliably produce an owner
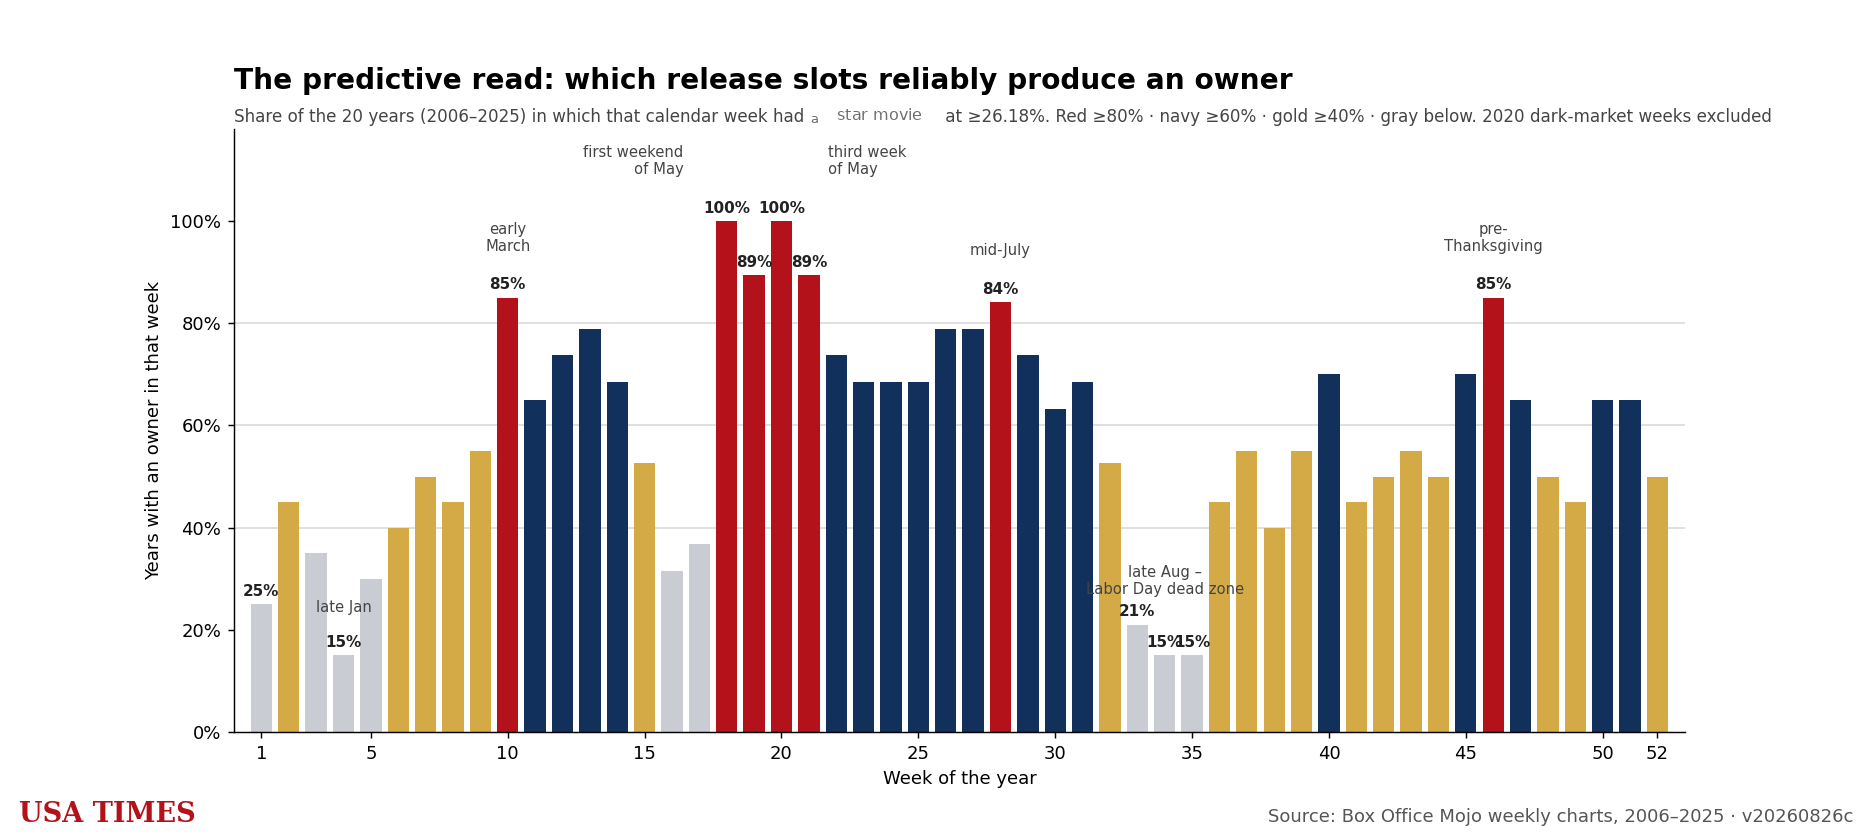
With twenty years on the board, the calendar itself becomes predictive. Two weeks are perfect: week 18 (the first weekend of May) and week 20 (the third week of May) produced a star movie in every single measurable year — 19/19 and 19/19 (the denominator is 19, not 20, because both weeks fell inside 2020’s dark-market shutdown). Weeks 19 and 21 sit at 89.5% each, which means the whole month of May is effectively a guaranteed ownership window. Outside May the most reliable slots are week 10 in early March (85%), week 46 in the run-up to Thanksgiving (85%) and week 28 in mid-July (84%).
The dead slots are just as consistent. Week 4 (late January), week 34 (late August) and week 35 (Labor Day) each produced an owner in only 3 of 20 years — 15% — with week 33 (21%) and week 1 (25%) barely better. The practical read for a distributor is blunt: a film placed in early May is entering a window that has produced an owner in every measurable year on record — it will be competing for the room, not inheriting an empty one — while a film placed in late August is entering a week that has had no owner at all in seventeen of the last twenty years. The August slot is cheap for a reason. It is also, on this evidence, the easiest week in the calendar in which to become the owner yourself.
All-time superlatives: twenty years in one place
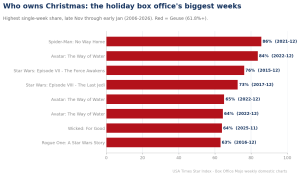
- Biggest single week ever: Avengers: Endgame (2019) at 88.35% of the entire domestic box office in week 17. The top five: Avengers: Endgame 88.3% (2019), Black Panther: Wakanda Forever 86.1% (2022), Spider-Man: No Way Home 85.6% (2021), Avatar: The Way of Water 83.7% (2022) and Doctor Strange in the Multiverse of Madness 83.3% (2022). 2020’s pandemic-market peaks are excluded from this ranking.
- Most eventful film: Tenet (2020) held event status for 6 weeks — but in a market running at a fraction of normal size, so it carries the pandemic asterisk. Only four films in twenty years have held event status for five weeks or more: Tenet (2020, 6), The Super Mario Bros. Movie (2023, 5), Black Panther: Wakanda Forever (2022, 5) and The Croods: A New Age (2020, 5). The longest hold in an undisrupted market is 5 weeks: The Super Mario Bros. Movie (2023) and Black Panther: Wakanda Forever (2022).
- Best return on a budget: Paranormal Activity 2 (2010) at 59.17× its reported budget. The rest of the top five: Get Out 52.0× (2017), Paranormal Activity 3 41.4× (2011), Demon Slayer: Kimetsu no Yaiba Infinity Castle 40.1× (2025) and Insidious: Chapter 2 32.4× (2013).
- Worst return by an owner: Argylle (2024) at 0.48×. The rest of the bottom five: Let Him Go 0.55× (2020), Tron: Ares 0.65× (2025), The New Mutants 0.73× (2020) and Red One 0.74× (2024). Every one of them owned a week outright and still lost money.
- Clean sweeps: in fifteen of the twenty years every owner with a reported budget finished at or above 1× — 2006, 2007, 2008, 2009, 2010, 2011, 2012, 2013, 2014, 2015, 2016, 2017, 2018, 2019, 2022. The five years that were not clean are 2020, 2021, 2023, 2024, 2025. Every clean sweep except 2022 happened before 2020, and four of the last five years put at least one outright week-owner underwater — the single clearest sign in the index that the economics of owning a week have changed.
- One-week wonders: in absolute terms the year with the most was 2014 (21 of 25 owners lasted exactly one week) and the fewest was 2006 (11 — but from only 13 owners). By rate the leader is 2011, where 19 of 21 owners (90%) held for a single week. Across all twenty years 299 of 437 owners (68%) owned exactly one week and were gone.
- Tier distribution over time: five years produced no Geuse at all — 2006, 2008, 2009, 2011, 2014 — and every one of them falls in the first half of the index. The Geuse-heavy years are all recent: 2021 (7), 2022 (6) and 2017 (5). In 2006 the top tier was empty and seven of thirteen owners were Mini-geuse-tier; in 2025 seventeen of twenty-seven peaked in the Betelgeuse-event band. The same number of films owns the year, but they own it harder.
- Emptiest and fullest calendars: 2006 had 37 weeks with no owner at all, the most in the index — five more than any other year. At the other end, 2021 and 2022 tie for the fewest empty weeks of any full year (10 each). (2020 shows only five empty weeks, but on a 30-week measurable calendar.)
Each of the twenty years follows, earliest first, with its own week-by-week index, its ranked owners, how long each held the room, and a full ledger with worldwide gross, reported budget and the profitability arrow.
2006: the emptiest year the index has ever measured
At $9.107 billion domestic across 52 chart weeks, 2006 produced thirteen distinct star movies (0 Geuse · 6 Betelgeuse · 7 Mini-geuse). That is the smallest crop in the twenty-year index. Fifteen of the year’s 52 measurable weeks had an owner; thirty-seven had none. No week carried two owners at once.
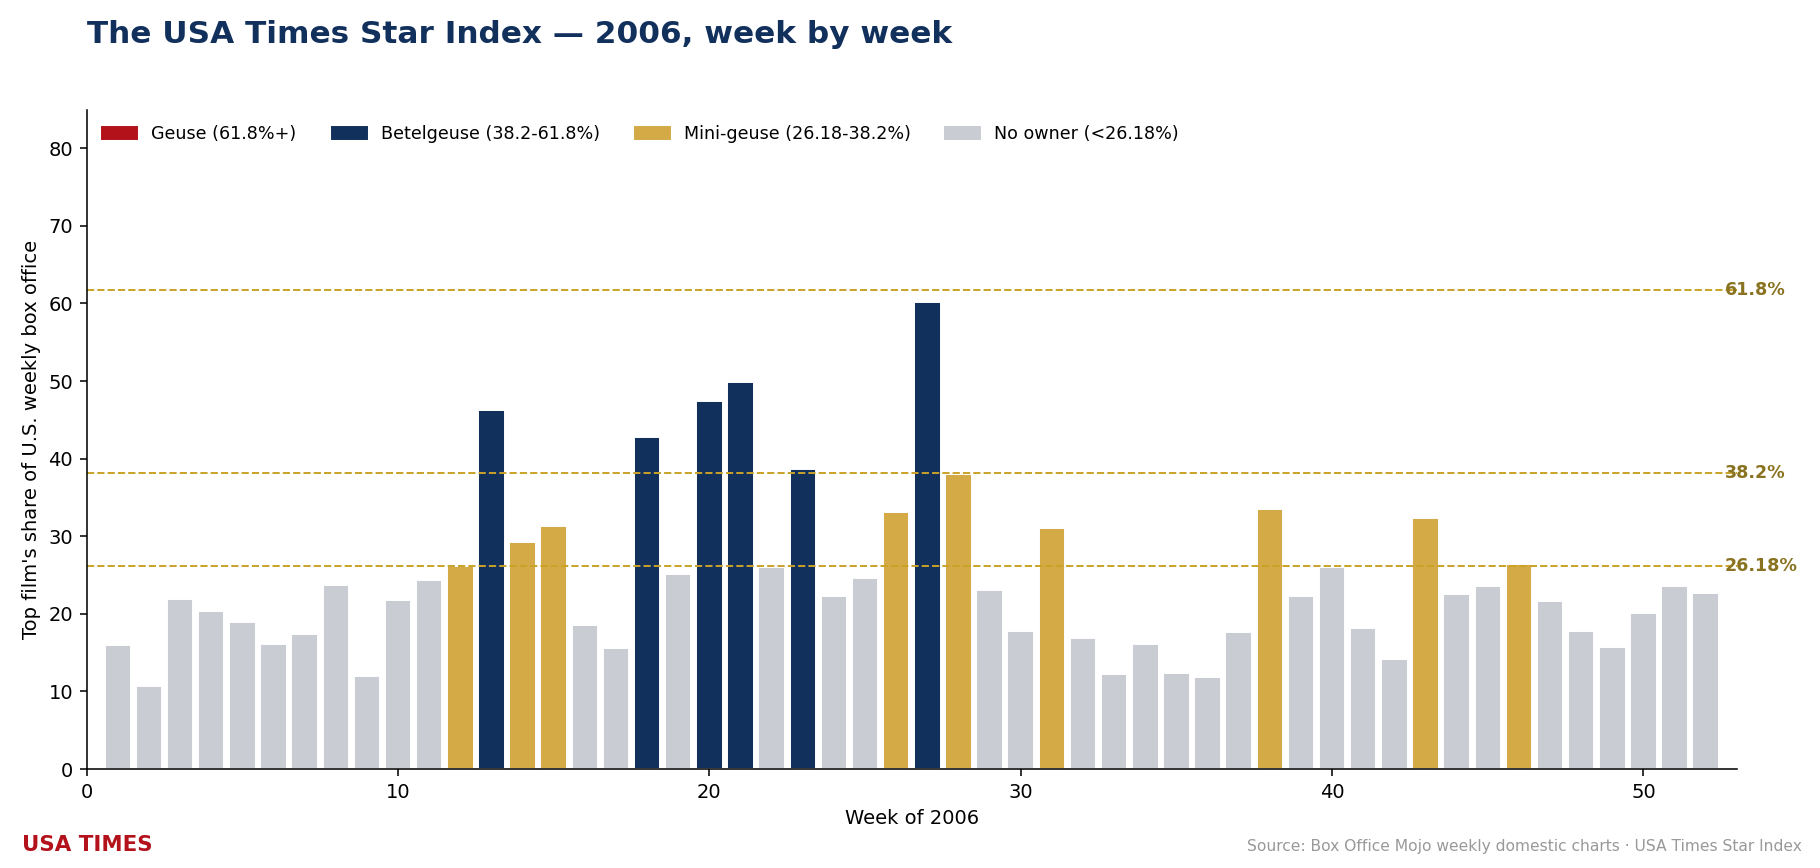
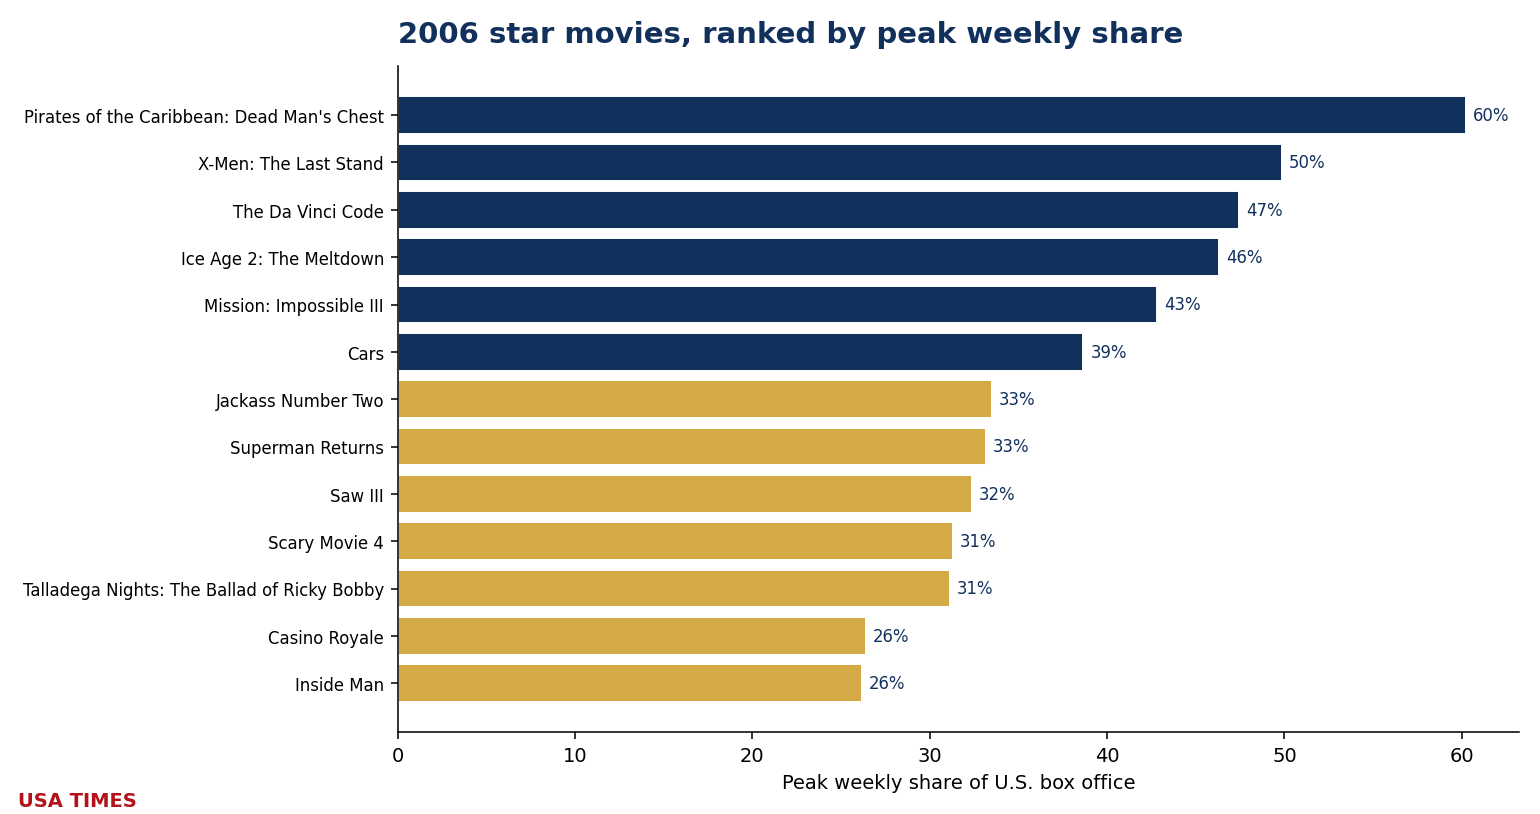
No film reached Geuse. The year’s ceiling is Pirates of the Caribbean: Dead Man’s Chest at 60.21% (W27), the 3rd-lowest year-ceiling in the index, and one of five zero-Geuse years (2006, 2008, 2009, 2011, 2014). Five more peaked in Betelgeuse territory (38.2–61.8%): X-Men: The Last Stand (49.86%, W21), The Da Vinci Code (47.45%, W20), Ice Age 2: The Meltdown (46.33%, W13), Mission: Impossible III (42.79%, W18) and Cars (38.65%, W23). Seven finished as Mini-geuse-tier owners, from Jackass Number Two (33.49%) down to Inside Man (26.18%, the year’s narrowest clearance of the 26.18% bar).
Two films tie for the longest hold at 2 weeks each: Pirates of the Caribbean: Dead Man’s Chest and Ice Age 2: The Meltdown. Eleven of the thirteen owners (85%) were one-week wonders. Money: 2006 is a clean-sweep year — all 13 owners with a reported budget finished at or above 1× that budget, one of fifteen such years in the twenty. The green arrows carry an asterisk, though: Superman Returns (1.45×) sits below the informal ~2× real-world breakeven line that marketing spend imposes. Best return of the year: Saw III at 16.49×. Concentration: the year’s owners took 13.1% of all domestic box office during the weeks they owned — the lowest in the index.
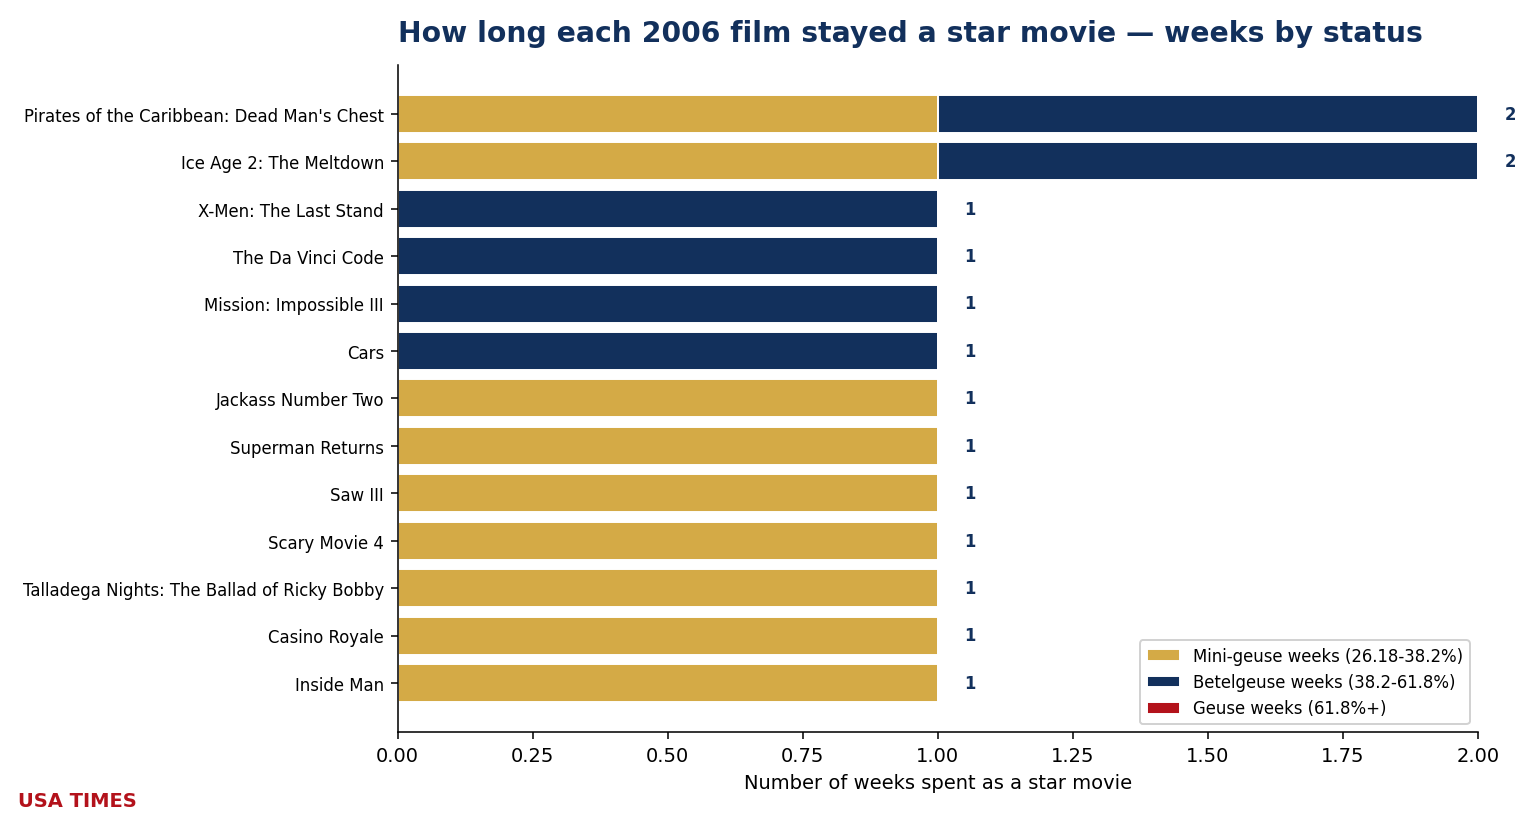
The 2006 ledger
| Film | Peak share | Tier at peak | Weeks as event | WW gross | Budget* | WW / budget |
|---|---|---|---|---|---|---|
| Pirates of the Caribbean: Dead Man’s Chest | 60.21% (W27) | Betelgeuse | 2 | $1.066B | $225.0M | ▲ 4.74× |
| X-Men: The Last Stand | 49.86% (W21) | Betelgeuse | 1 | $460.4M | $210.0M | ▲ 2.19× |
| The Da Vinci Code | 47.45% (W20) | Betelgeuse | 1 | $760.0M | $125.0M | ▲ 6.08× |
| Ice Age 2: The Meltdown | 46.33% (W13) | Betelgeuse | 2 | $660.9M | $80.0M | ▲ 8.26× |
| Mission: Impossible III | 42.79% (W18) | Betelgeuse | 1 | $398.5M | $150.0M | ▲ 2.66× |
| Cars | 38.65% (W23) | Betelgeuse | 1 | $462.0M | $120.0M | ▲ 3.85× |
| Jackass Number Two | 33.49% (W38) | Mini-geuse | 1 | $84.6M | $11.5M | ▲ 7.36× |
| Superman Returns | 33.18% (W26) | Mini-geuse | 1 | $391.1M | $270.0M | ▲ 1.45× |
| Saw III | 32.36% (W43) | Mini-geuse | 1 | $164.9M | $10.0M | ▲ 16.49× |
| Scary Movie 4 | 31.32% (W15) | Mini-geuse | 1 | $178.3M | $45.0M | ▲ 3.96× |
| Talladega Nights: The Ballad of Ricky Bobby | 31.13% (W31) | Mini-geuse | 1 | $163.4M | $72.5M | ▲ 2.25× |
| Casino Royale | 26.41% (W46) | Mini-geuse | 1 | $606.0M | $150.0M | ▲ 4.04× |
| Inside Man | 26.18% (W12) | Mini-geuse | 1 | $186.0M | $45.0M | ▲ 4.13× |
*Budgets are reported estimates (Box Office Mojo, The Numbers, trade press) and should be read as such. A green ▲ marks a film that returned at least its reported budget in worldwide gross; a red ▼ marks one that did not. Industry rules of thumb put real breakeven nearer 2–2.5× budget once print and advertising are counted, so a green arrow below that range is not the same as a profit.
2007: Spider-Man 3 alone clears Geuse
At $9.580 billion domestic across 52 chart weeks, 2007 produced eighteen distinct star movies (1 Geuse · 6 Betelgeuse · 11 Mini-geuse). That is the 3rd-smallest crop in the twenty-year index. Twenty of the year’s 52 measurable weeks had an owner; thirty-two had none. Two weeks carried two owners at once (W21, W44).
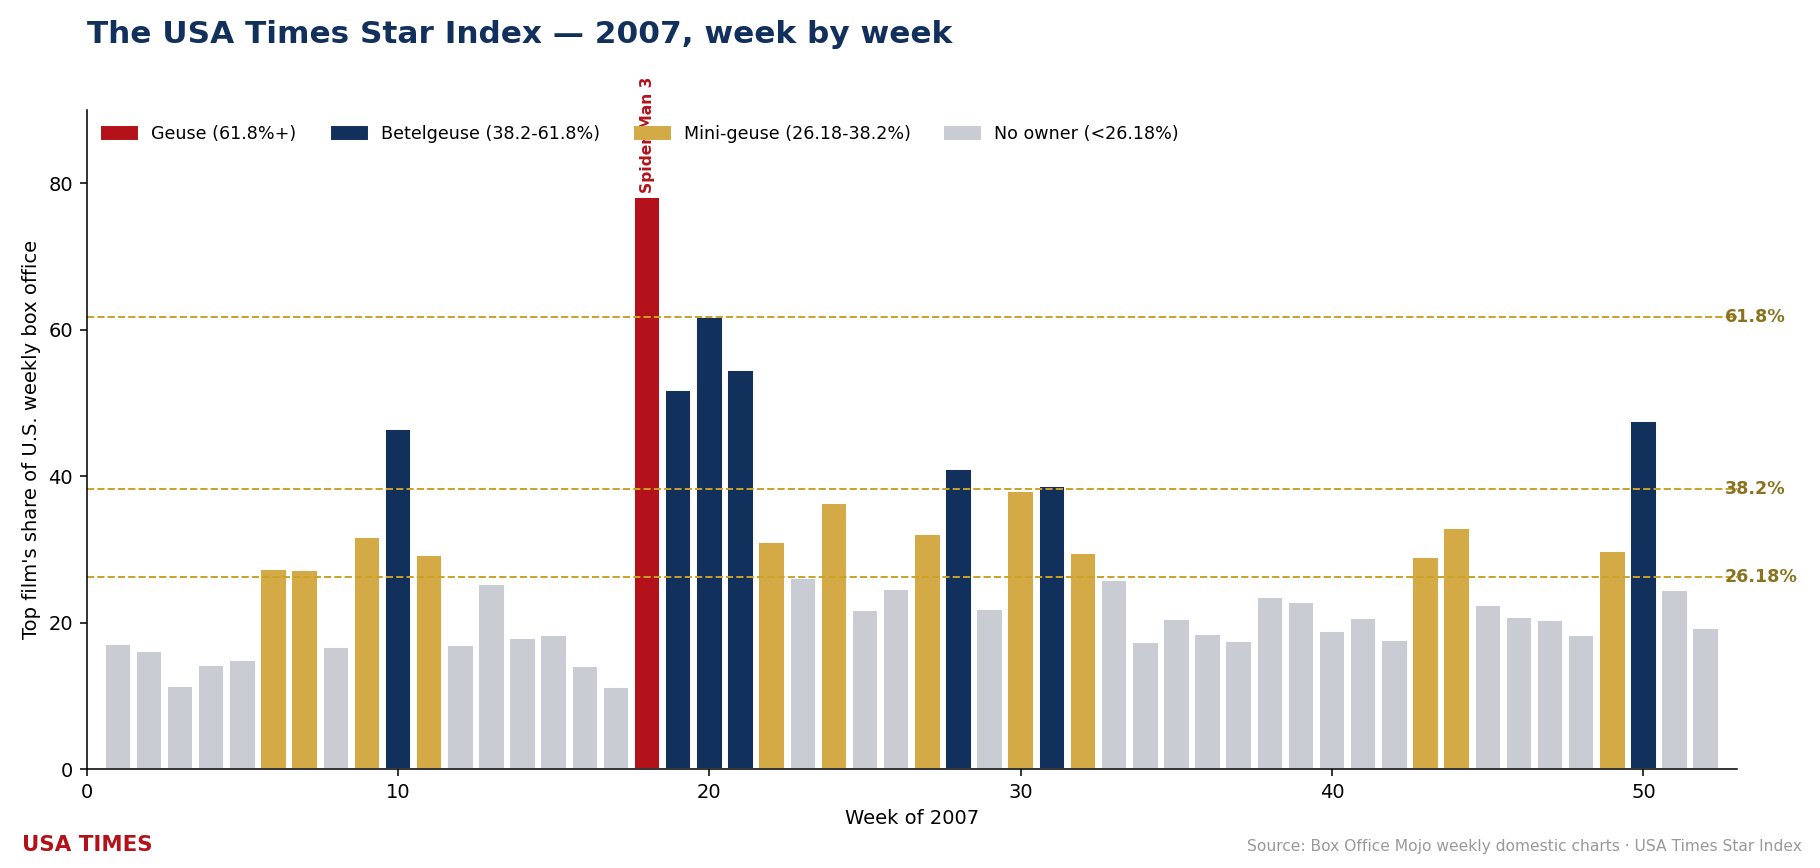
One film cleared the 61.8% Geuse line: Spider-Man 3 (78.07%, W18). Six more peaked in Betelgeuse territory (38.2–61.8%): Shrek the Third (61.74%, W20), Pirates of the Caribbean: At World’s End (54.54%, W21), I Am Legend (47.57%, W50), 300 (46.50%, W10), Harry Potter and the Order of the Phoenix (40.96%, W28) and The Bourne Ultimatum (38.72%, W31). Eleven finished as Mini-geuse-tier owners, from The Simpsons Movie (37.93%) down to Bee Movie (26.97%, the year’s narrowest clearance of the 26.18% bar).
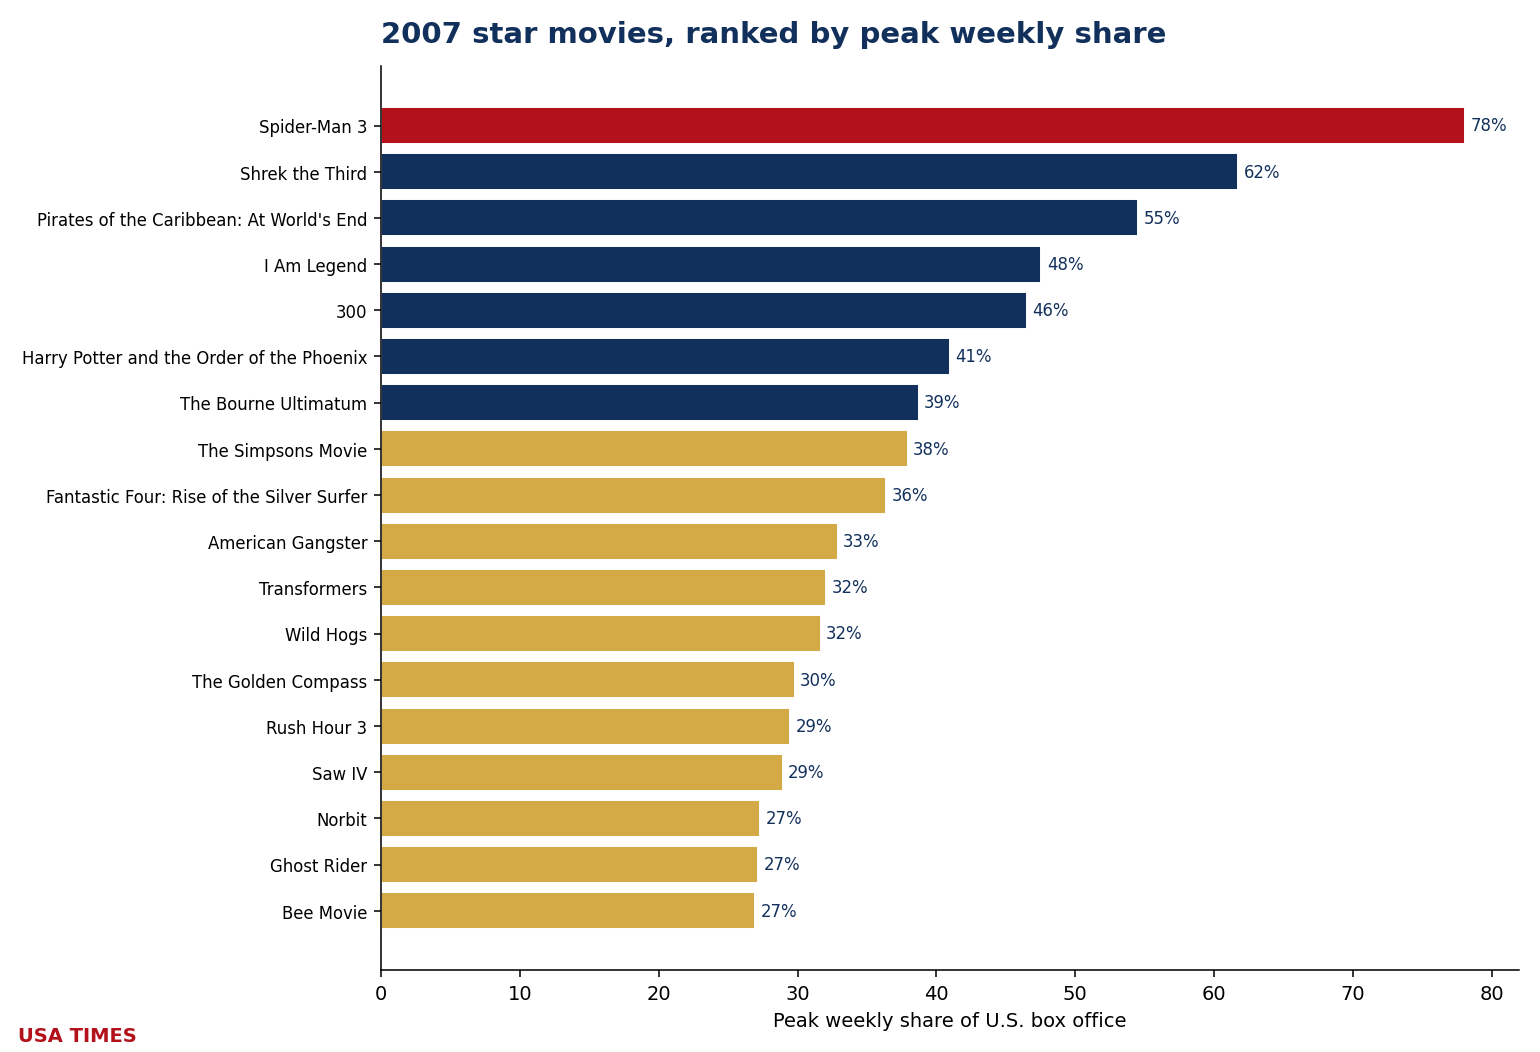
Four films tie for the longest hold at 2 weeks each: Spider-Man 3, Shrek the Third, Pirates of the Caribbean: At World’s End and 300. Fourteen of the eighteen owners (78%) were one-week wonders. Money: 2007 is a clean-sweep year — all 18 owners with a reported budget finished at or above 1× that budget, one of fifteen such years in the twenty. The green arrows carry an asterisk, though: Rush Hour 3 (1.84×) and Bee Movie (1.96×) sit below the informal ~2× real-world breakeven line that marketing spend imposes. Best return of the year: Saw IV at 13.94×. Concentration: the year’s owners took 19.1% of all domestic box office during the weeks they owned.
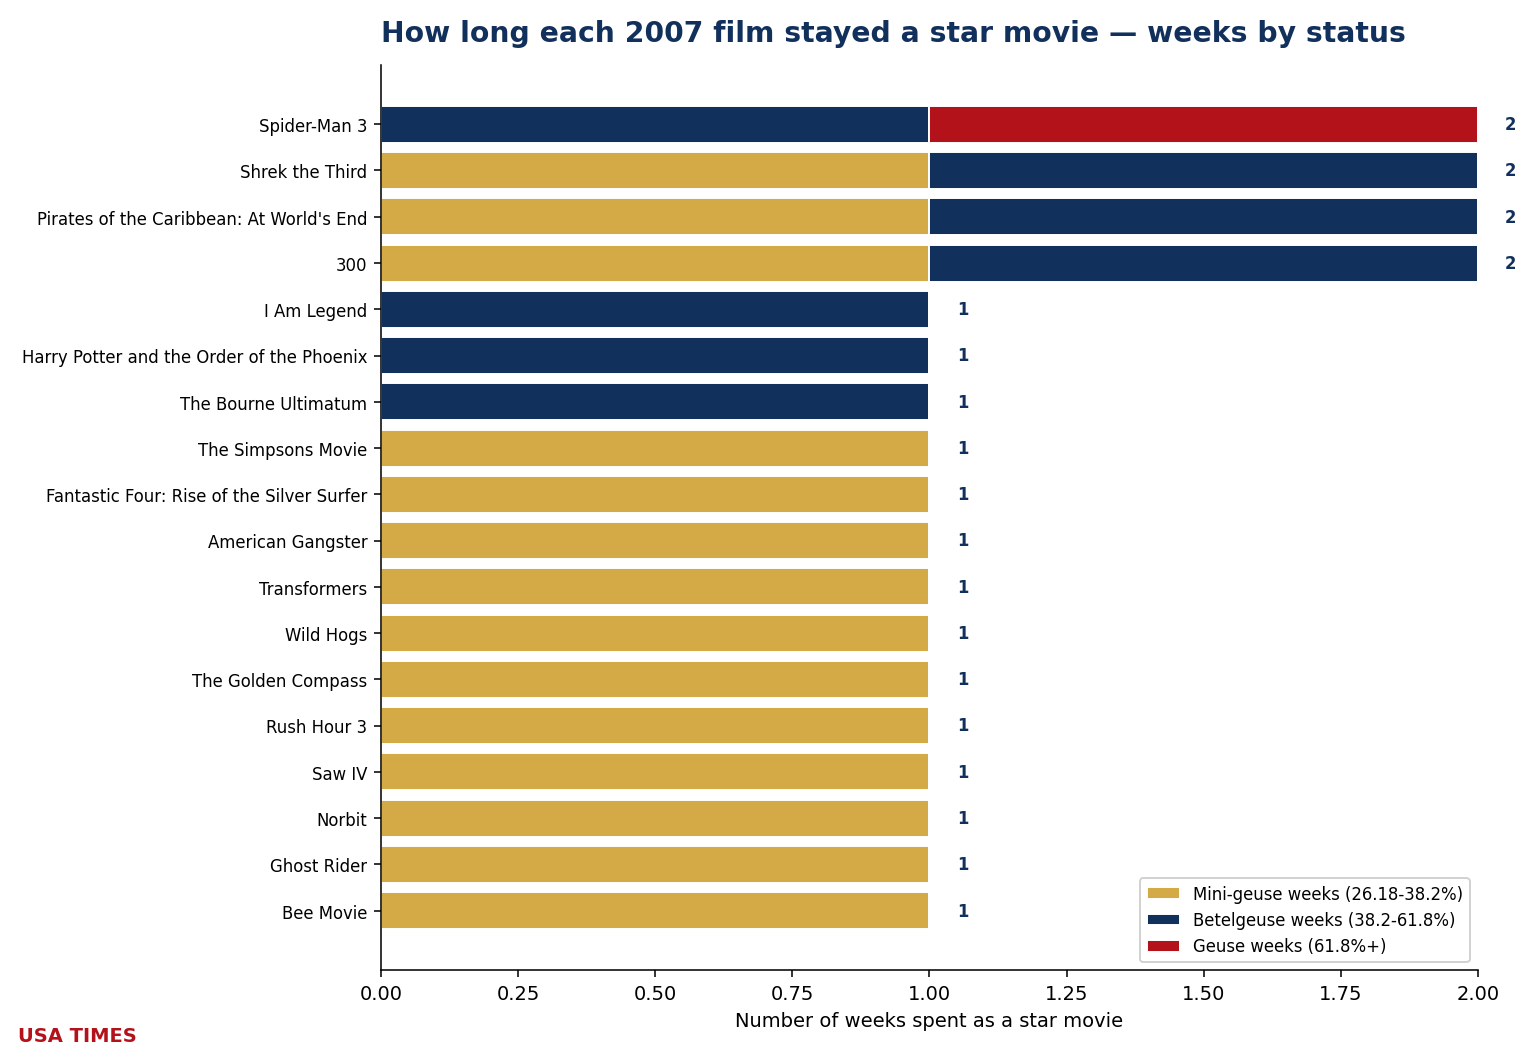
The 2007 ledger
| Film | Peak share | Tier at peak | Weeks as event | WW gross | Budget* | WW / budget |
|---|---|---|---|---|---|---|
| Spider-Man 3 | 78.07% (W18) | Geuse | 2 | $885.8M | $258.0M | ▲ 3.43× |
| Shrek the Third | 61.74% (W20) | Betelgeuse | 2 | $808.3M | $160.0M | ▲ 5.05× |
| Pirates of the Caribbean: At World’s End | 54.54% (W21) | Betelgeuse | 2 | $961.0M | $300.0M | ▲ 3.20× |
| I Am Legend | 47.57% (W50) | Betelgeuse | 1 | $585.4M | $150.0M | ▲ 3.90× |
| 300 | 46.50% (W10) | Betelgeuse | 2 | $456.1M | $65.0M | ▲ 7.02× |
| Harry Potter and the Order of the Phoenix | 40.96% (W28) | Betelgeuse | 1 | $942.0M | $150.0M | ▲ 6.28× |
| The Bourne Ultimatum | 38.72% (W31) | Betelgeuse | 1 | $442.8M | $110.0M | ▲ 4.03× |
| The Simpsons Movie | 37.93% (W30) | Mini-geuse | 1 | $536.4M | $75.0M | ▲ 7.15× |
| Fantastic Four: Rise of the Silver Surfer | 36.39% (W24) | Mini-geuse | 1 | $301.9M | $130.0M | ▲ 2.32× |
| American Gangster | 32.89% (W44) | Mini-geuse | 1 | $269.8M | $100.0M | ▲ 2.70× |
| Transformers | 32.06% (W27) | Mini-geuse | 1 | $709.7M | $150.0M | ▲ 4.73× |
| Wild Hogs | 31.66% (W9) | Mini-geuse | 1 | $253.6M | $60.0M | ▲ 4.23× |
| The Golden Compass | 29.79% (W49) | Mini-geuse | 1 | $372.2M | $180.0M | ▲ 2.07× |
| Rush Hour 3 | 29.46% (W32) | Mini-geuse | 1 | $258.1M | $140.0M | ▲ 1.84× |
| Saw IV | 28.92% (W43) | Mini-geuse | 1 | $139.3M | $10.0M | ▲ 13.94× |
| Norbit | 27.28% (W6) | Mini-geuse | 1 | $159.8M | $60.0M | ▲ 2.66× |
| Ghost Rider | 27.15% (W7) | Mini-geuse | 1 | $228.7M | $110.0M | ▲ 2.08× |
| Bee Movie | 26.97% (W44) | Mini-geuse | 1 | $293.5M | $150.0M | ▲ 1.96× |
*Budgets are reported estimates (Box Office Mojo, The Numbers, trade press) and should be read as such. A green ▲ marks a film that returned at least its reported budget in worldwide gross; a red ▼ marks one that did not. Industry rules of thumb put real breakeven nearer 2–2.5× budget once print and advertising are counted, so a green arrow below that range is not the same as a profit.
2008: Iron Man and The Dark Knight both fall just short of the top tier
At $9.576 billion domestic across 52 chart weeks, 2008 produced eighteen distinct star movies (0 Geuse · 5 Betelgeuse · 13 Mini-geuse). Twenty of the year’s 52 measurable weeks had an owner; thirty-two had none. No week carried two owners at once.
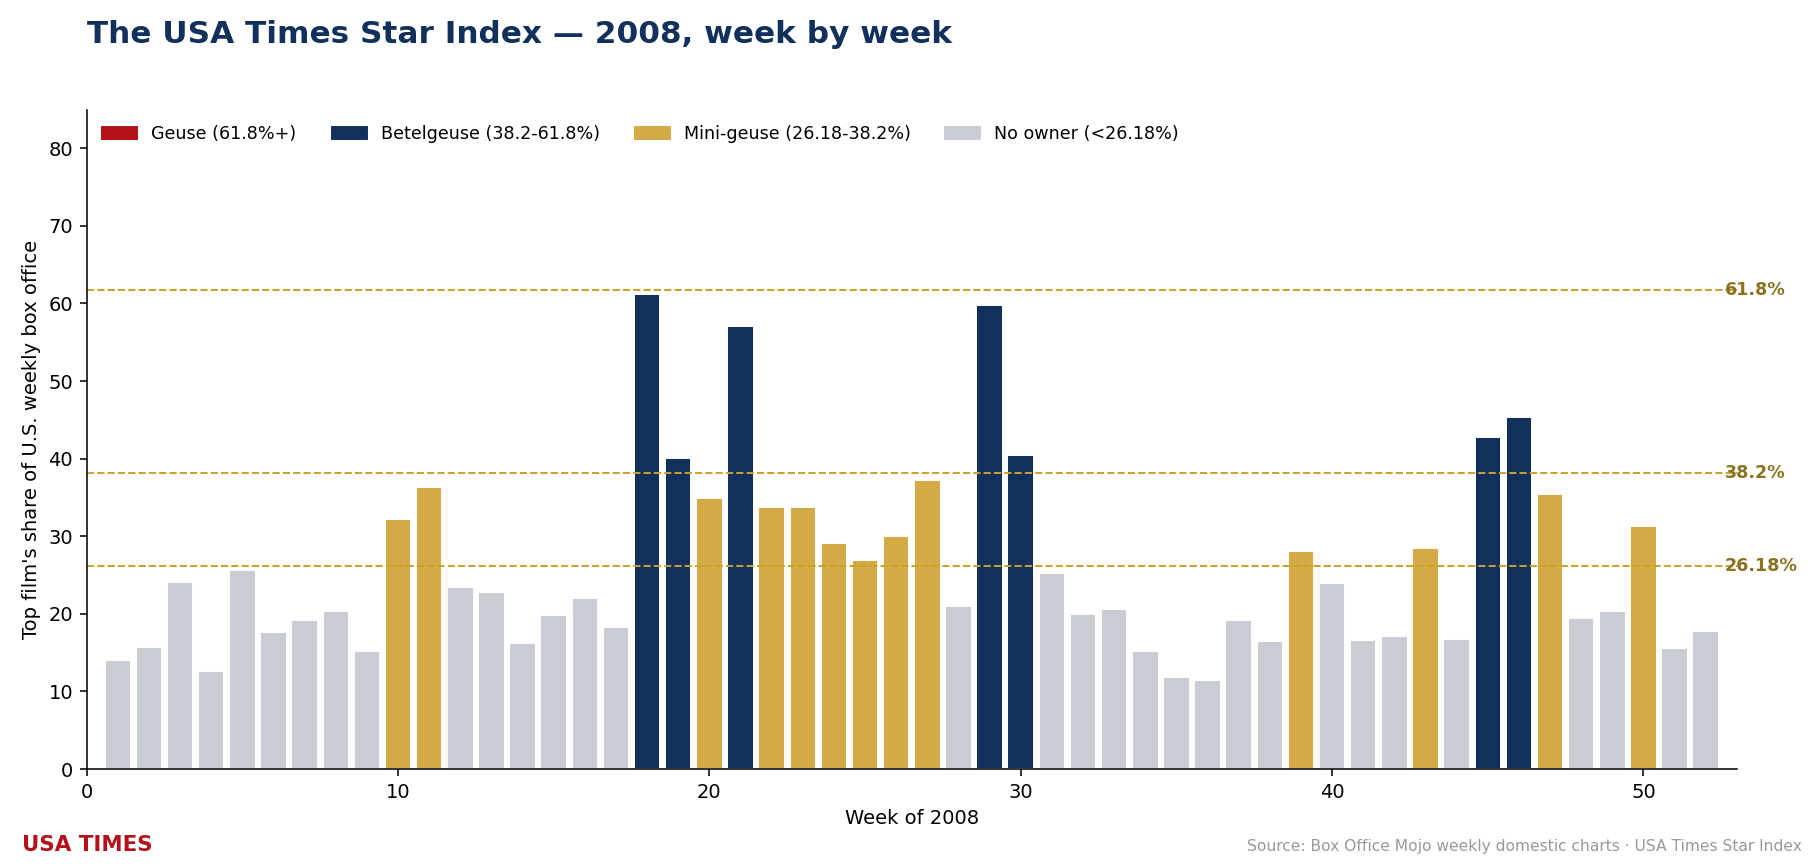
No film reached Geuse. The year’s ceiling is Iron Man at 61.16% (W18), the 5th-lowest year-ceiling in the index, and one of five zero-Geuse years (2006, 2008, 2009, 2011, 2014). Four more peaked in Betelgeuse territory (38.2–61.8%): The Dark Knight (59.78%, W29), Indiana Jones and the Kingdom of the Crystal Skull (57.04%, W21), Quantum of Solace (45.43%, W46) and Madagascar: Escape 2 Africa (42.80%, W45). Thirteen finished as Mini-geuse-tier owners, from Hancock (37.31%) down to Get Smart (26.96%, the year’s narrowest clearance of the 26.18% bar).
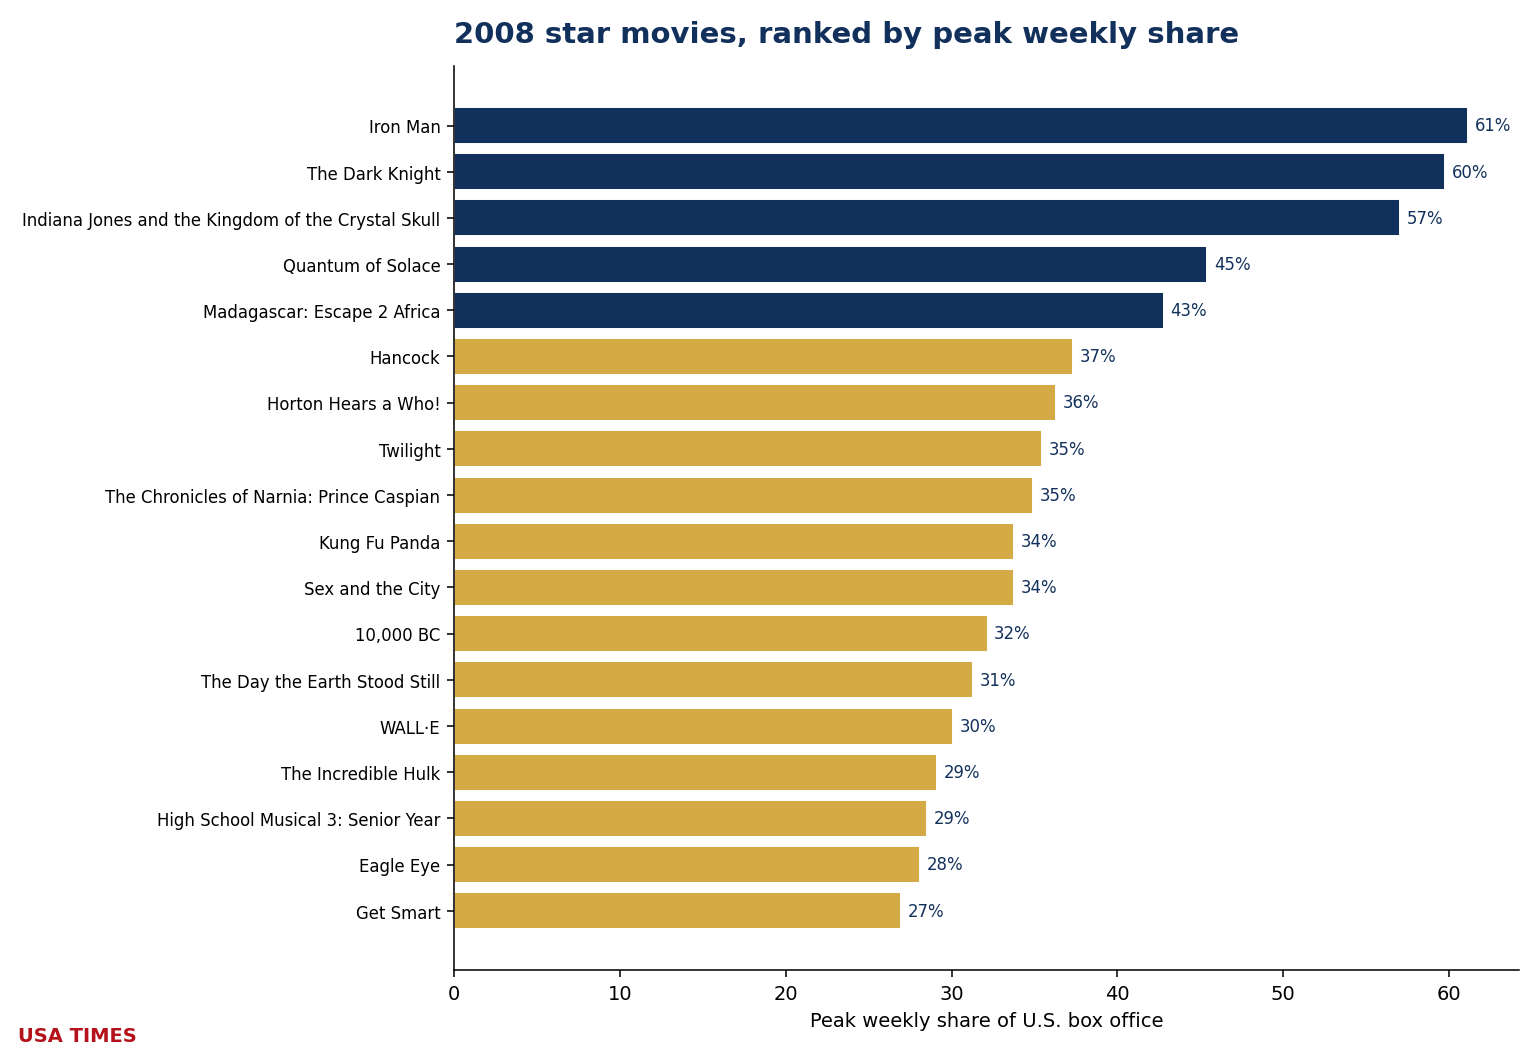
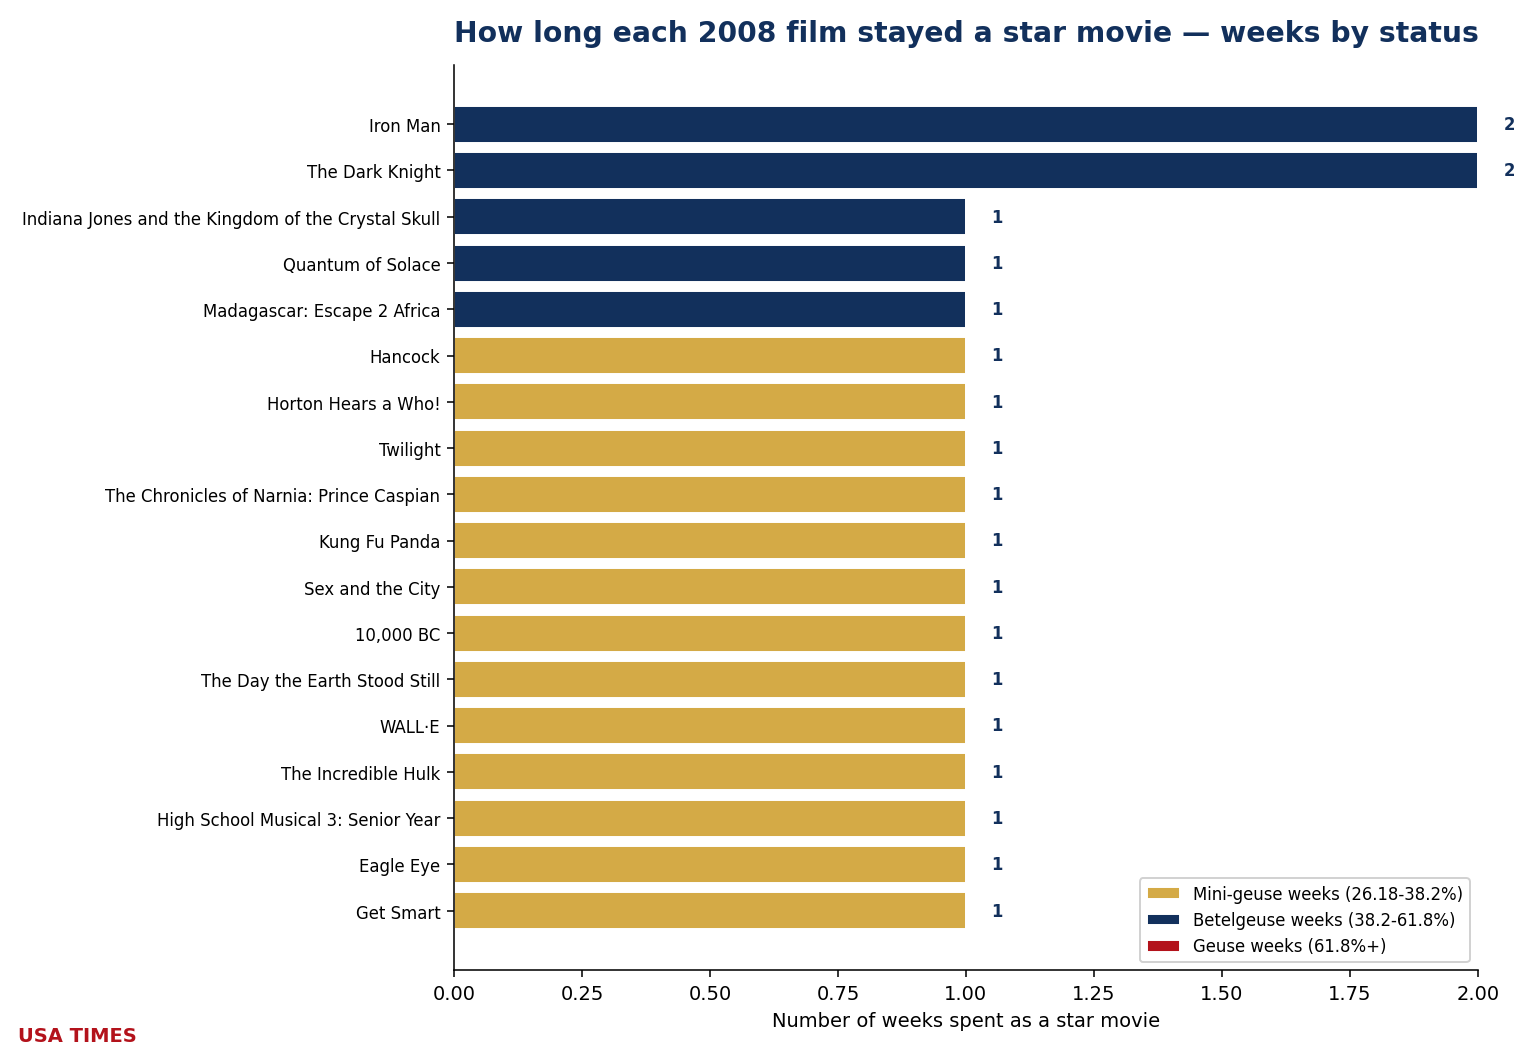
Two films tie for the longest hold at 2 weeks each: Iron Man and The Dark Knight. Sixteen of the eighteen owners (89%) were one-week wonders. Money: 2008 is a clean-sweep year — all 18 owners with a reported budget finished at or above 1× that budget, one of fifteen such years in the twenty. The green arrows carry an asterisk, though: The Incredible Hulk (1.77×) and The Chronicles of Narnia: Prince Caspian (1.87×) sit below the informal ~2× real-world breakeven line that marketing spend imposes. Best return of the year: High School Musical 3: Senior Year at 22.99×, the 10th-best return anywhere in the twenty-year index. Concentration: the year’s owners took 17.9% of all domestic box office during the weeks they owned — the 2nd-lowest in the index.
The 2008 ledger
| Film | Peak share | Tier at peak | Weeks as event | WW gross | Budget* | WW / budget |
|---|---|---|---|---|---|---|
| Iron Man | 61.16% (W18) | Betelgeuse | 2 | $585.4M | $140.0M | ▲ 4.18× |
| The Dark Knight | 59.78% (W29) | Betelgeuse | 2 | $1.004B | $185.0M | ▲ 5.43× |
| Indiana Jones and the Kingdom of the Crystal Skull | 57.04% (W21) | Betelgeuse | 1 | $786.6M | $185.0M | ▲ 4.25× |
| Quantum of Solace | 45.43% (W46) | Betelgeuse | 1 | $589.6M | $200.0M | ▲ 2.95× |
| Madagascar: Escape 2 Africa | 42.80% (W45) | Betelgeuse | 1 | $603.9M | $150.0M | ▲ 4.03× |
| Hancock | 37.31% (W27) | Mini-geuse | 1 | $629.4M | $150.0M | ▲ 4.20× |
| Horton Hears a Who! | 36.32% (W11) | Mini-geuse | 1 | $298.6M | $85.0M | ▲ 3.51× |
| Twilight | 35.45% (W47) | Mini-geuse | 1 | $392.6M | $37.0M | ▲ 10.61× |
| The Chronicles of Narnia: Prince Caspian | 34.90% (W20) | Mini-geuse | 1 | $419.7M | $225.0M | ▲ 1.87× |
| Kung Fu Panda | 33.78% (W23) | Mini-geuse | 1 | $632.0M | $130.0M | ▲ 4.86× |
| Sex and the City | 33.77% (W22) | Mini-geuse | 1 | $418.8M | $65.0M | ▲ 6.44× |
| 10,000 BC | 32.17% (W10) | Mini-geuse | 1 | $269.8M | $105.0M | ▲ 2.57× |
| The Day the Earth Stood Still | 31.31% (W50) | Mini-geuse | 1 | $233.1M | $80.0M | ▲ 2.91× |
| WALL·E | 30.07% (W26) | Mini-geuse | 1 | $521.3M | $180.0M | ▲ 2.90× |
| The Incredible Hulk | 29.13% (W24) | Mini-geuse | 1 | $264.8M | $150.0M | ▲ 1.77× |
| High School Musical 3: Senior Year | 28.51% (W43) | Mini-geuse | 1 | $252.9M | $11.0M | ▲ 22.99× |
| Eagle Eye | 28.10% (W39) | Mini-geuse | 1 | $178.8M | $80.0M | ▲ 2.23× |
| Get Smart | 26.96% (W25) | Mini-geuse | 1 | $230.7M | $80.0M | ▲ 2.88× |
*Budgets are reported estimates (Box Office Mojo, The Numbers, trade press) and should be read as such. A green ▲ marks a film that returned at least its reported budget in worldwide gross; a red ▼ marks one that did not. Industry rules of thumb put real breakeven nearer 2–2.5× budget once print and advertising are counted, so a green arrow below that range is not the same as a profit.
2009: the lowest ceiling the index has ever measured
At $10.529 billion domestic across 52 chart weeks, 2009 produced twenty distinct star movies (0 Geuse · 11 Betelgeuse · 9 Mini-geuse). Twenty-three of the year’s 52 measurable weeks had an owner; twenty-nine had none. One week carried two owners at once (W20).
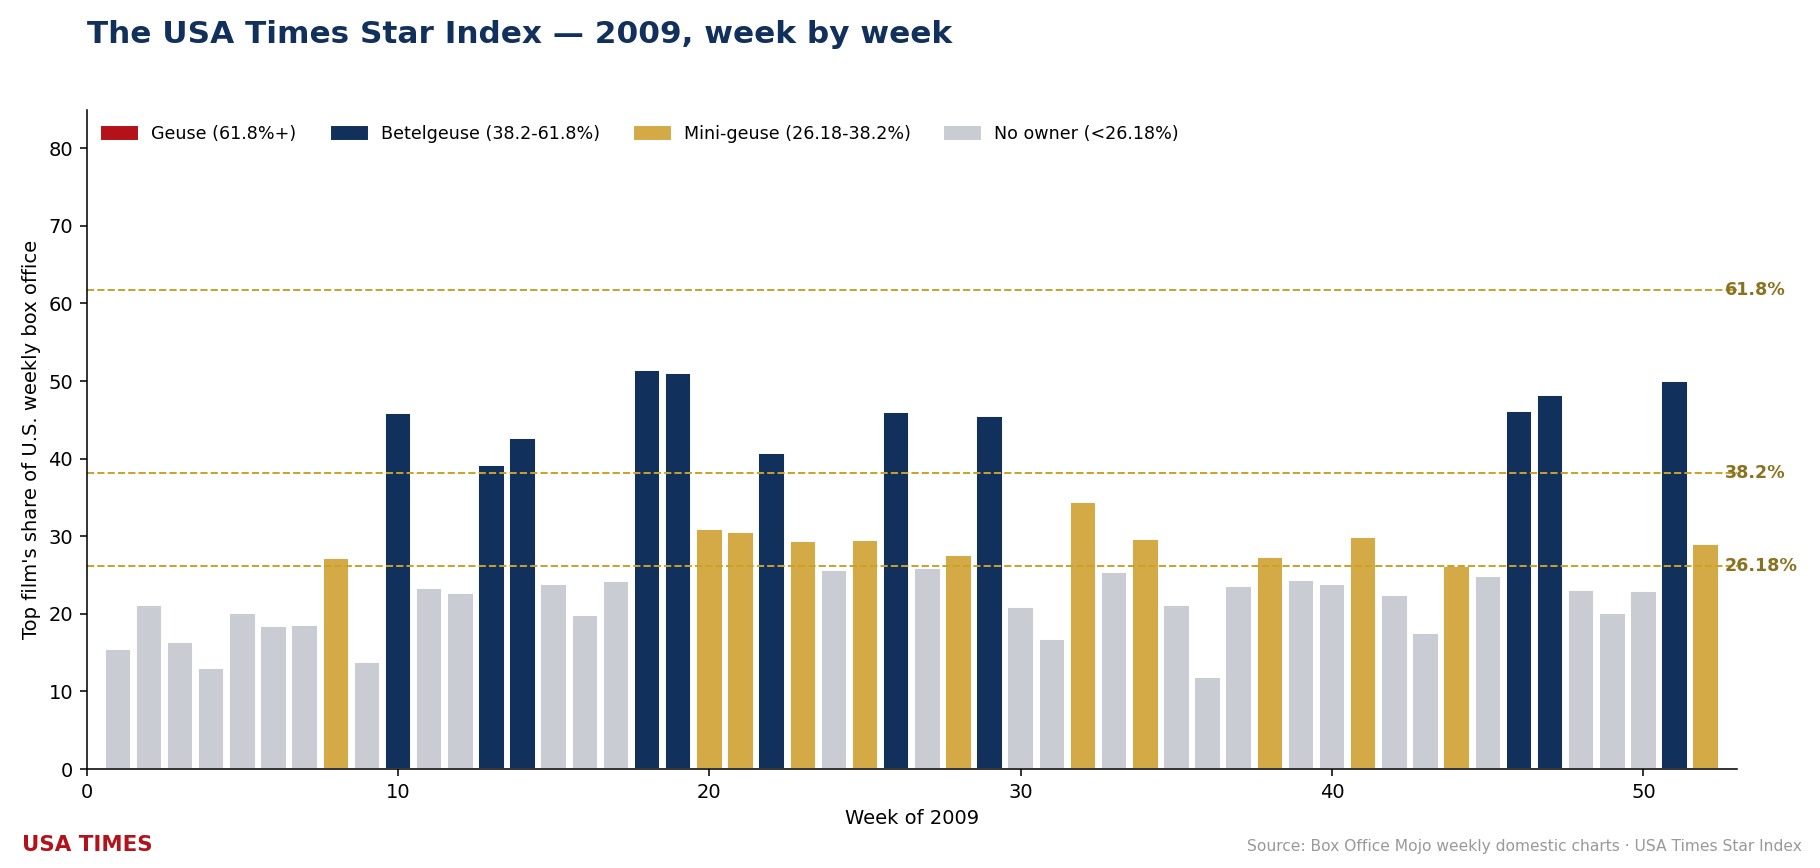
No film reached Geuse. The year’s ceiling is X-Men Origins: Wolverine at 51.43% (W18), the lowest year-ceiling in the index, and one of five zero-Geuse years (2006, 2008, 2009, 2011, 2014). Ten more peaked in Betelgeuse territory (38.2–61.8%): Star Trek (51.02%, W19), Avatar (50.03%, W51), The Twilight Saga: New Moon (48.23%, W47), 2012 (46.17%, W46), Transformers: Revenge of the Fallen (46.01%, W26) and Watchmen (45.87%, W10), plus four more. Nine finished as Mini-geuse-tier owners, from G.I. Joe: The Rise of Cobra (34.40%) down to This Is It (26.23%, the year’s narrowest clearance of the 26.18% bar).
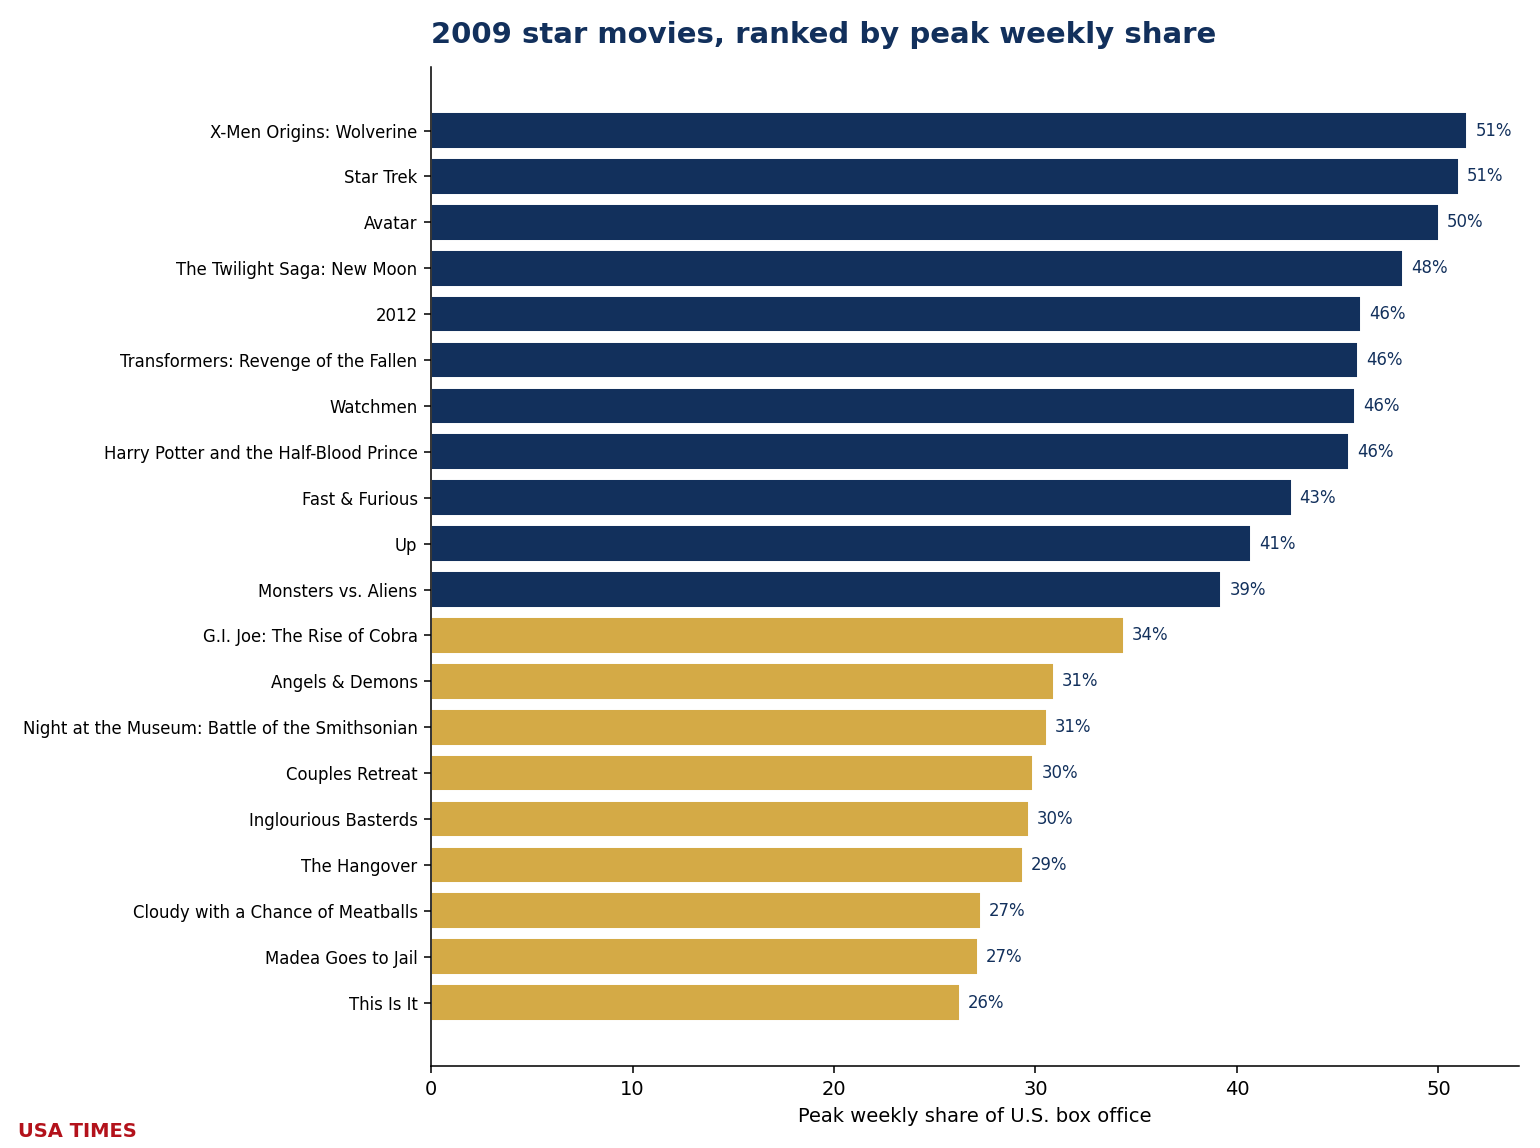
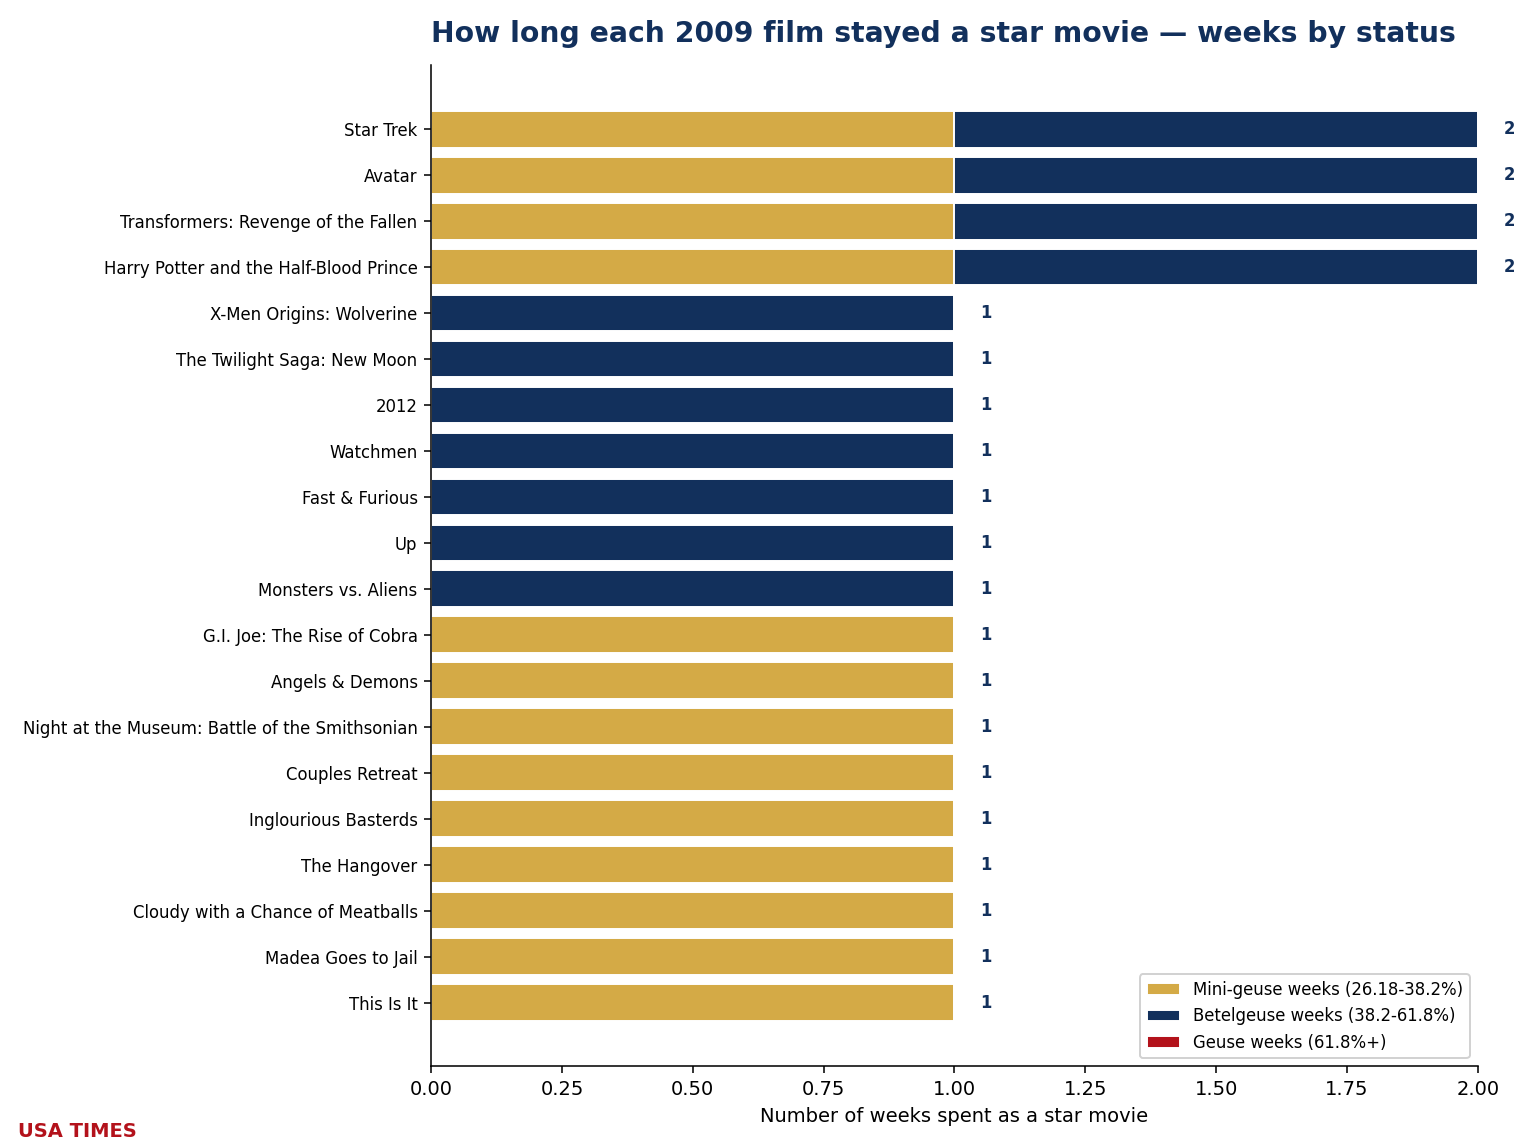
Four films tie for the longest hold at 2 weeks each: Star Trek, Avatar, Transformers: Revenge of the Fallen and Harry Potter and the Half-Blood Prince. Sixteen of the twenty owners (80%) were one-week wonders. Money: 2009 is a clean-sweep year — all 20 owners with a reported budget finished at or above 1× that budget, one of fifteen such years in the twenty. The green arrows carry an asterisk, though: Watchmen (1.43×) and G.I. Joe: The Rise of Cobra (1.73×) sit below the informal ~2× real-world breakeven line that marketing spend imposes. Best return of the year: The Twilight Saga: New Moon at 14.20×. Concentration: the year’s owners took 19.8% of all domestic box office during the weeks they owned.
The 2009 ledger
| Film | Peak share | Tier at peak | Weeks as event | WW gross | Budget* | WW / budget |
|---|---|---|---|---|---|---|
| X-Men Origins: Wolverine | 51.43% (W18) | Betelgeuse | 1 | $373.1M | $150.0M | ▲ 2.49× |
| Star Trek | 51.02% (W19) | Betelgeuse | 2 | $385.7M | $150.0M | ▲ 2.57× |
| Avatar | 50.03% (W51) | Betelgeuse | 2 | $2.744B | $237.0M | ▲ 11.58× |
| The Twilight Saga: New Moon | 48.23% (W47) | Betelgeuse | 1 | $709.8M | $50.0M | ▲ 14.20× |
| 2012 | 46.17% (W46) | Betelgeuse | 1 | $769.7M | $200.0M | ▲ 3.85× |
| Transformers: Revenge of the Fallen | 46.01% (W26) | Betelgeuse | 2 | $836.3M | $200.0M | ▲ 4.18× |
| Watchmen | 45.87% (W10) | Betelgeuse | 1 | $185.4M | $130.0M | ▲ 1.43× |
| Harry Potter and the Half-Blood Prince | 45.55% (W29) | Betelgeuse | 2 | $934.0M | $250.0M | ▲ 3.74× |
| Fast & Furious | 42.71% (W14) | Betelgeuse | 1 | $360.4M | $85.0M | ▲ 4.24× |
| Up | 40.72% (W22) | Betelgeuse | 1 | $735.1M | $175.0M | ▲ 4.20× |
| Monsters vs. Aliens | 39.22% (W13) | Betelgeuse | 1 | $381.5M | $175.0M | ▲ 2.18× |
| G.I. Joe: The Rise of Cobra | 34.40% (W32) | Mini-geuse | 1 | $302.5M | $175.0M | ▲ 1.73× |
| Angels & Demons | 30.92% (W20) | Mini-geuse | 1 | $485.9M | $150.0M | ▲ 3.24× |
| Night at the Museum: Battle of the Smithsonian | 30.56% (W21) | Mini-geuse | 1 | $413.1M | $150.0M | ▲ 2.75× |
| Couples Retreat | 29.90% (W41) | Mini-geuse | 1 | $171.8M | $70.0M | ▲ 2.45× |
| Inglourious Basterds | 29.67% (W34) | Mini-geuse | 1 | $321.5M | $70.0M | ▲ 4.59× |
| The Hangover | 29.36% (W23) | Mini-geuse | 1 | $468.8M | $35.0M | ▲ 13.39× |
| Cloudy with a Chance of Meatballs | 27.29% (W38) | Mini-geuse | 1 | $243.0M | $100.0M | ▲ 2.43× |
| Madea Goes to Jail | 27.14% (W8) | Mini-geuse | 1 | $90.5M | $17.5M | ▲ 5.17× |
| This Is It | 26.23% (W44) | Mini-geuse | 1 | $268.0M | $60.0M | ▲ 4.47× |
*Budgets are reported estimates (Box Office Mojo, The Numbers, trade press) and should be read as such. A green ▲ marks a film that returned at least its reported budget in worldwide gross; a red ▼ marks one that did not. Industry rules of thumb put real breakeven nearer 2–2.5× budget once print and advertising are counted, so a green arrow below that range is not the same as a profit.
2010: Iron Man 2 stands alone at the top tier
At $10.731 billion domestic across 53 chart weeks, 2010 produced nineteen distinct star movies (1 Geuse · 4 Betelgeuse · 14 Mini-geuse). Twenty-seven of the year’s 53 measurable weeks had an owner; twenty-six had none. No week carried two owners at once.
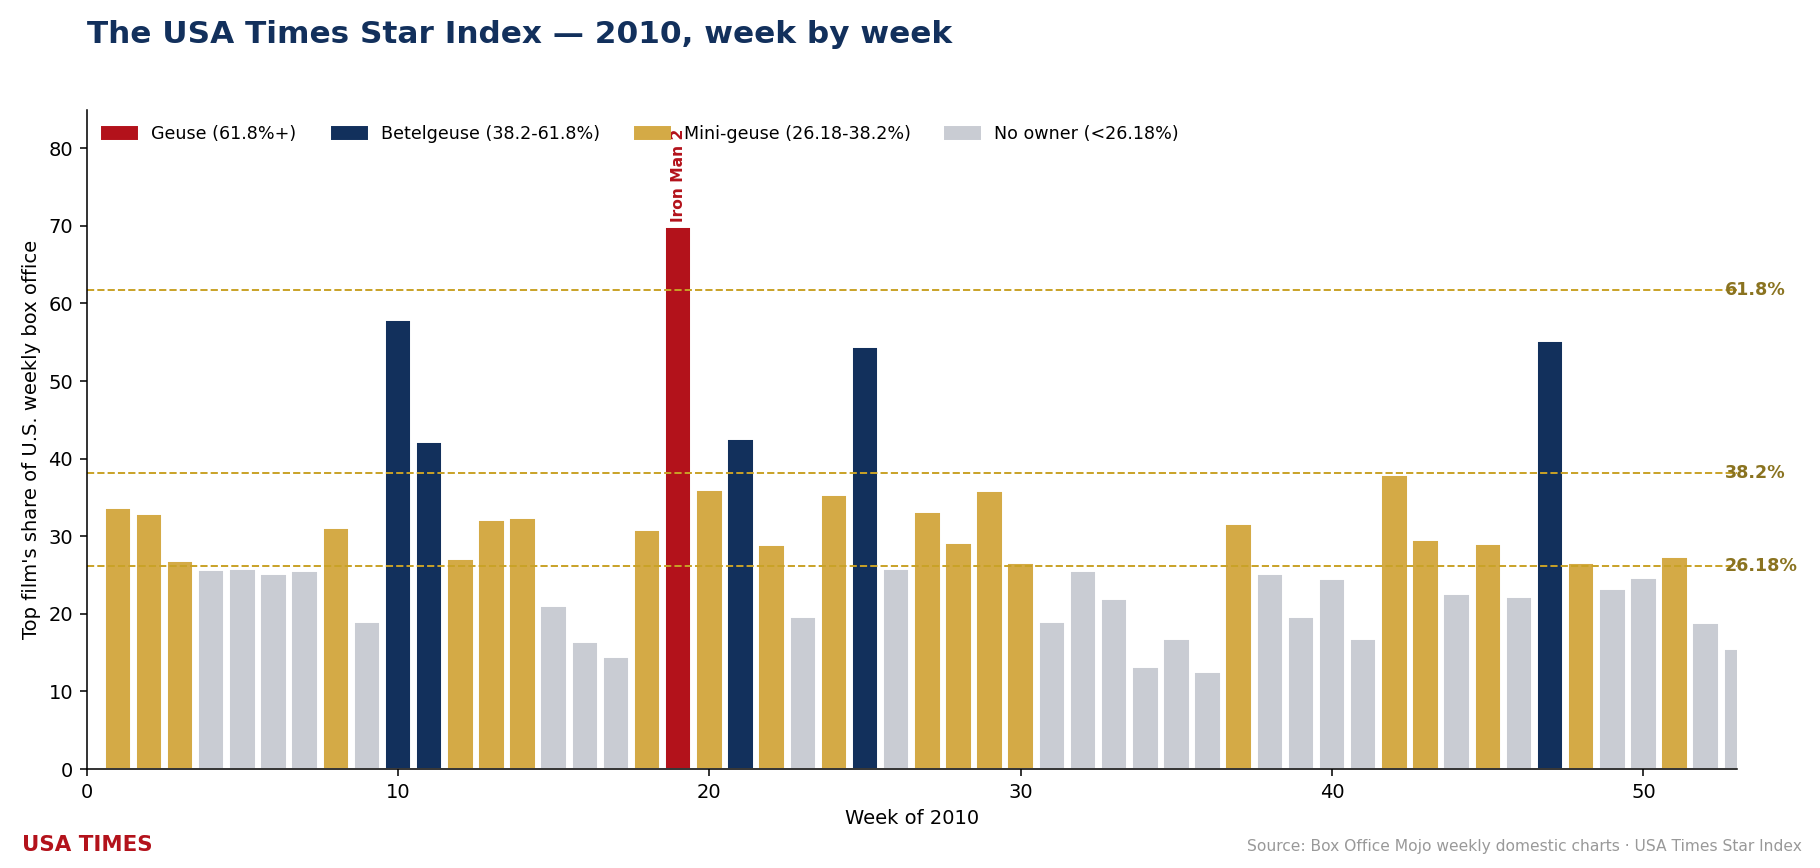
One film cleared the 61.8% Geuse line: Iron Man 2 (69.85%, W19). Four more peaked in Betelgeuse territory (38.2–61.8%): Alice in Wonderland (57.84%, W10), Harry Potter and the Deathly Hallows: Part 1 (55.19%, W47), Toy Story 3 (54.45%, W25) and Shrek Forever After (42.60%, W21). Fourteen finished as Mini-geuse-tier owners, from Jackass 3D (37.90%) down to Tron: Legacy (27.37%, the year’s narrowest clearance of the 26.18% bar).
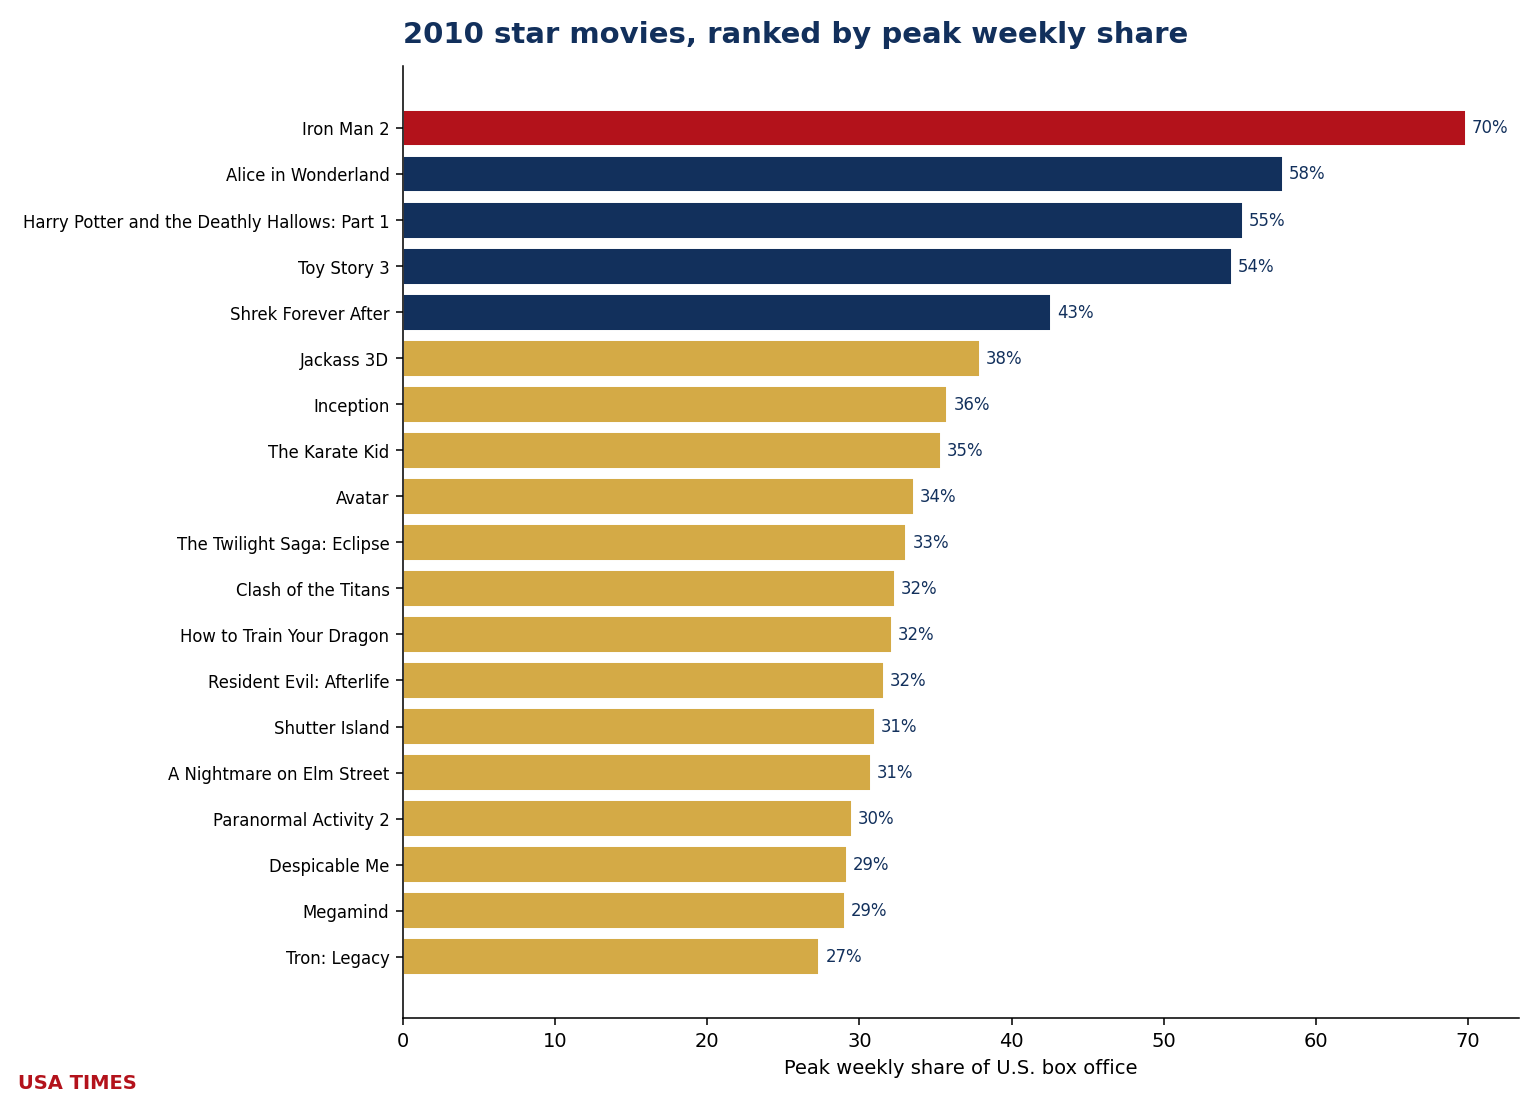
Two films tie for the longest hold at 3 weeks each: Alice in Wonderland and Avatar. Thirteen of the nineteen owners (68%) were one-week wonders. Money: 2010 is a clean-sweep year — all 19 owners with a reported budget finished at or above 1× that budget, one of fifteen such years in the twenty. Every owner cleared even the ~2× real-world breakeven line (floor: Tron: Legacy, 2.35×). Best return of the year: Paranormal Activity 2 at 59.17×, the 1st-best return anywhere in the twenty-year index. Concentration: the year’s owners took 20.9% of all domestic box office during the weeks they owned.
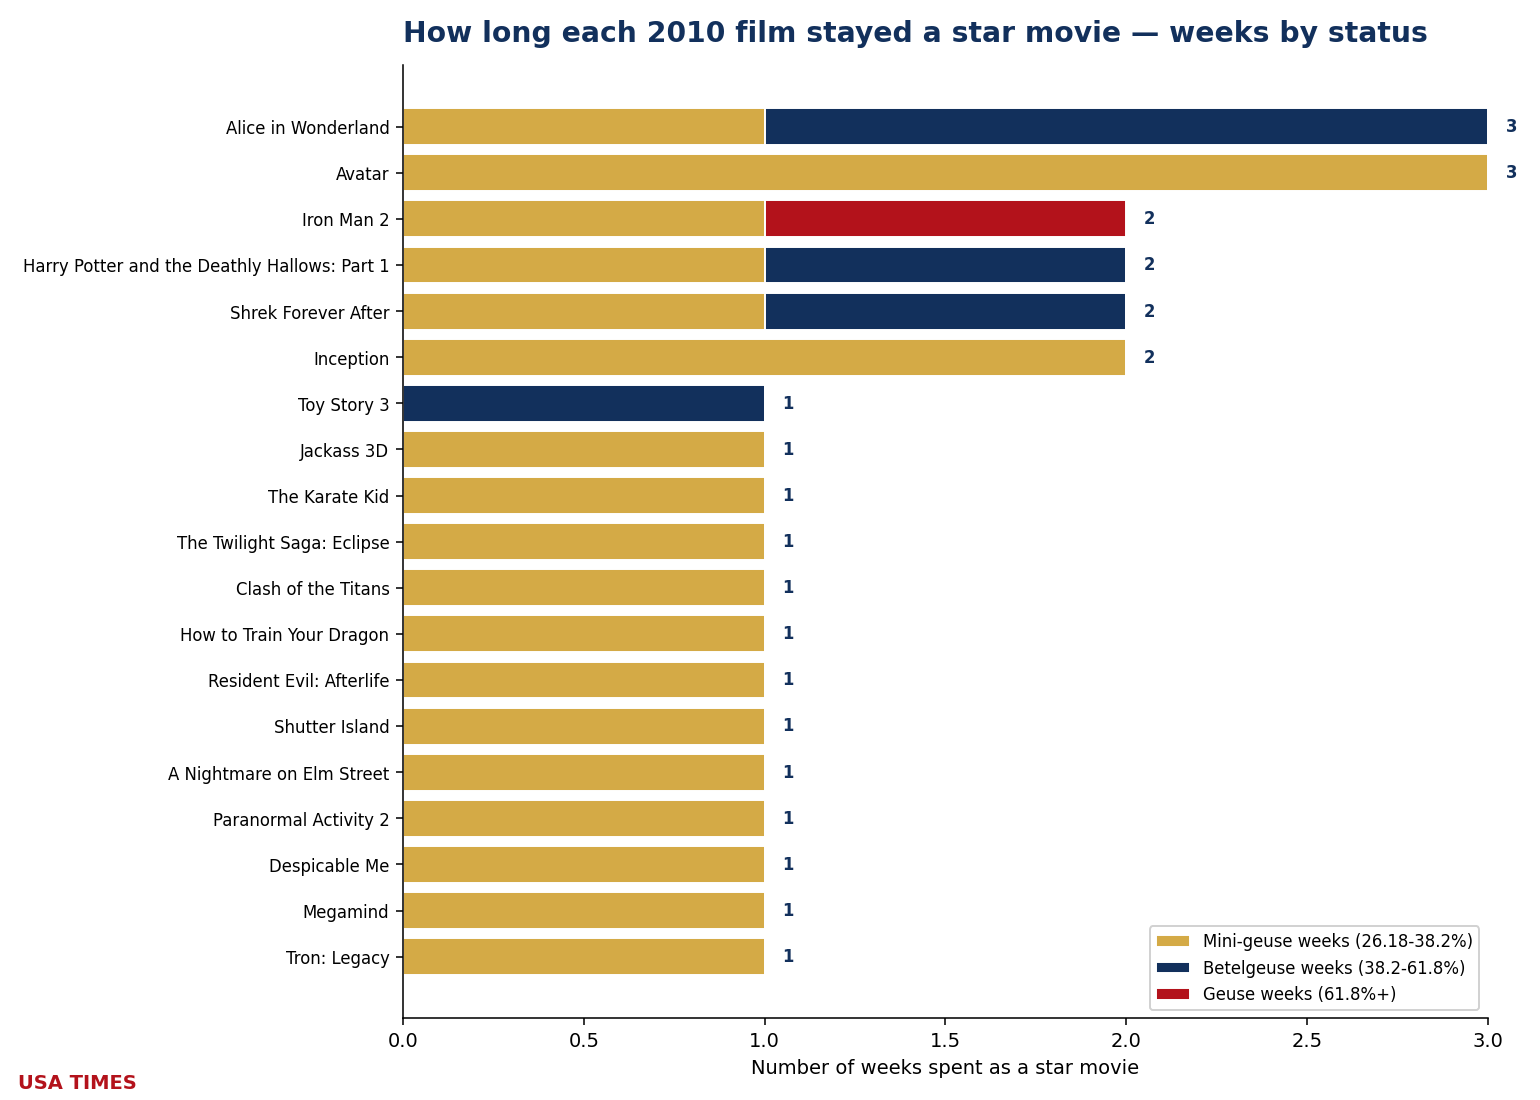
The 2010 ledger
| Film | Peak share | Tier at peak | Weeks as event | WW gross | Budget* | WW / budget |
|---|---|---|---|---|---|---|
| Iron Man 2 | 69.85% (W19) | Geuse | 2 | $623.9M | $200.0M | ▲ 3.12× |
| Alice in Wonderland | 57.84% (W10) | Betelgeuse | 3 | $1.025B | $200.0M | ▲ 5.13× |
| Harry Potter and the Deathly Hallows: Part 1 | 55.19% (W47) | Betelgeuse | 2 | $960.3M | $125.0M | ▲ 7.68× |
| Toy Story 3 | 54.45% (W25) | Betelgeuse | 1 | $1.067B | $200.0M | ▲ 5.33× |
| Shrek Forever After | 42.60% (W21) | Betelgeuse | 2 | $752.6M | $165.0M | ▲ 4.56× |
| Jackass 3D | 37.90% (W42) | Mini-geuse | 1 | $171.7M | $20.0M | ▲ 8.58× |
| Inception | 35.78% (W29) | Mini-geuse | 2 | $828.3M | $160.0M | ▲ 5.18× |
| The Karate Kid | 35.35% (W24) | Mini-geuse | 1 | $359.1M | $40.0M | ▲ 8.98× |
| Avatar | 33.59% (W1) | Mini-geuse | 3 | $2.744B | $237.0M | ▲ 11.58× |
| The Twilight Saga: Eclipse | 33.09% (W27) | Mini-geuse | 1 | $698.5M | $68.0M | ▲ 10.27× |
| Clash of the Titans | 32.33% (W14) | Mini-geuse | 1 | $493.2M | $125.0M | ▲ 3.95× |
| How to Train Your Dragon | 32.13% (W13) | Mini-geuse | 1 | $494.9M | $165.0M | ▲ 3.00× |
| Resident Evil: Afterlife | 31.59% (W37) | Mini-geuse | 1 | $300.2M | $60.0M | ▲ 5.00× |
| Shutter Island | 31.03% (W8) | Mini-geuse | 1 | $294.8M | $80.0M | ▲ 3.69× |
| A Nightmare on Elm Street | 30.75% (W18) | Mini-geuse | 1 | $115.7M | $35.0M | ▲ 3.31× |
| Paranormal Activity 2 | 29.50% (W43) | Mini-geuse | 1 | $177.5M | $3.0M | ▲ 59.17× |
| Despicable Me | 29.16% (W28) | Mini-geuse | 1 | $543.2M | $69.0M | ▲ 7.87× |
| Megamind | 29.02% (W45) | Mini-geuse | 1 | $321.9M | $130.0M | ▲ 2.48× |
| Tron: Legacy | 27.37% (W51) | Mini-geuse | 1 | $400.1M | $170.0M | ▲ 2.35× |
*Budgets are reported estimates (Box Office Mojo, The Numbers, trade press) and should be read as such. A green ▲ marks a film that returned at least its reported budget in worldwide gross; a red ▼ marks one that did not. Industry rules of thumb put real breakeven nearer 2–2.5× budget once print and advertising are counted, so a green arrow below that range is not the same as a profit.
2011: Harry Potter closes an era 0.02 points short of Geuse
At $10.147 billion domestic across 52 chart weeks, 2011 produced twenty-one distinct star movies (0 Geuse · 7 Betelgeuse · 14 Mini-geuse). Twenty-three of the year’s 52 measurable weeks had an owner; twenty-nine had none. No week carried two owners at once.
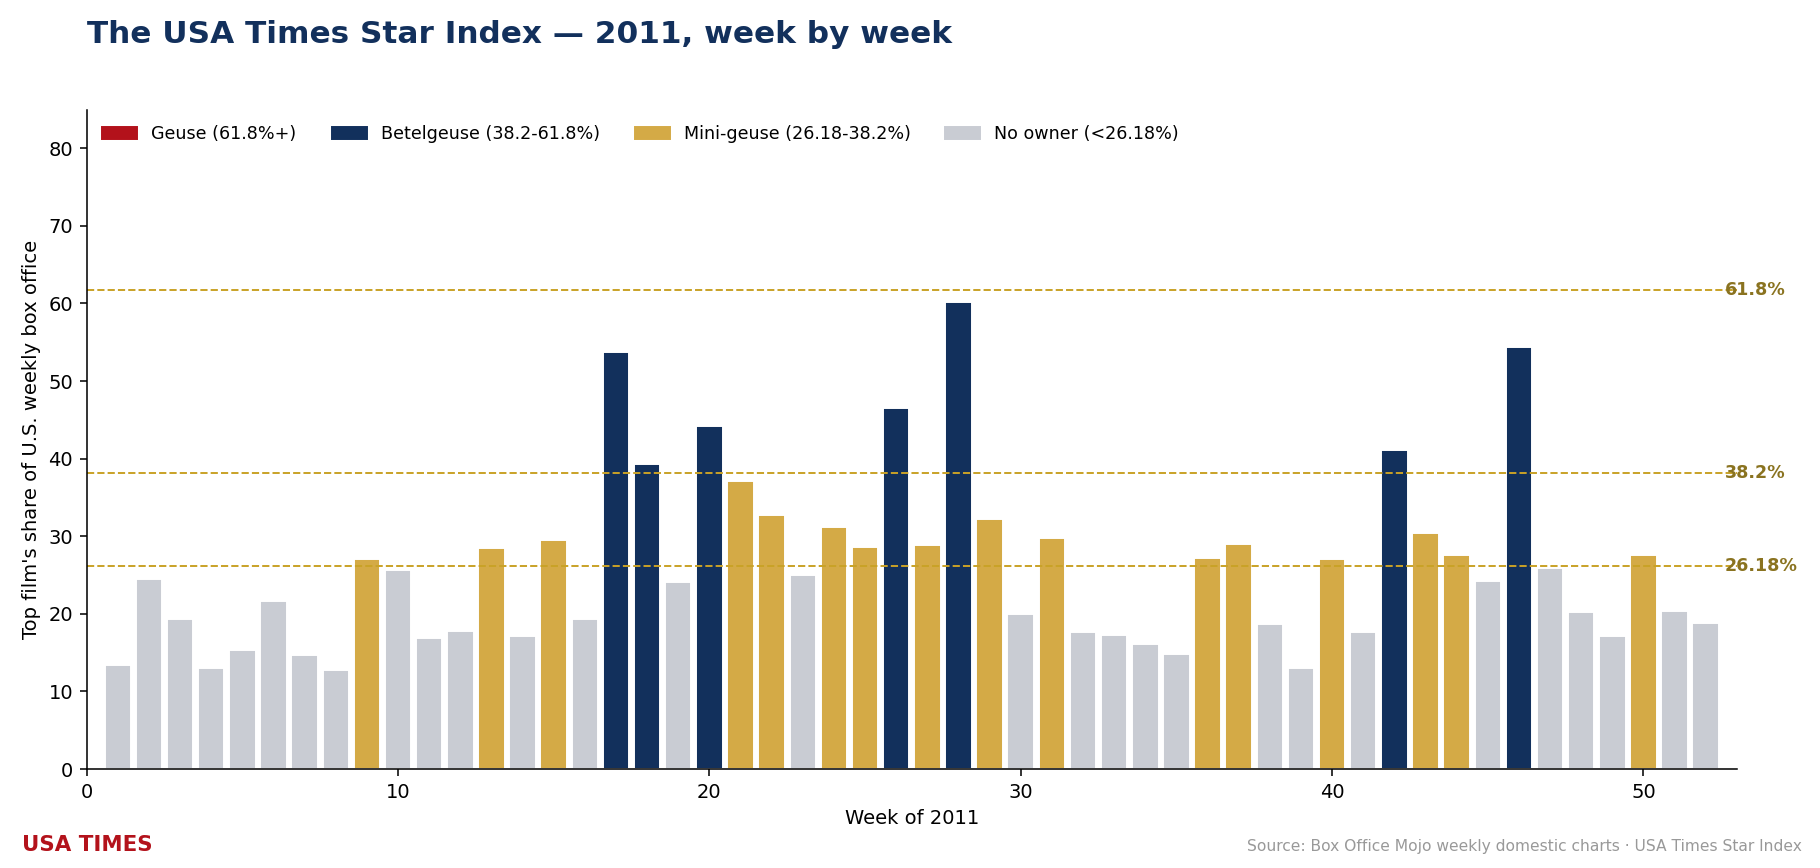
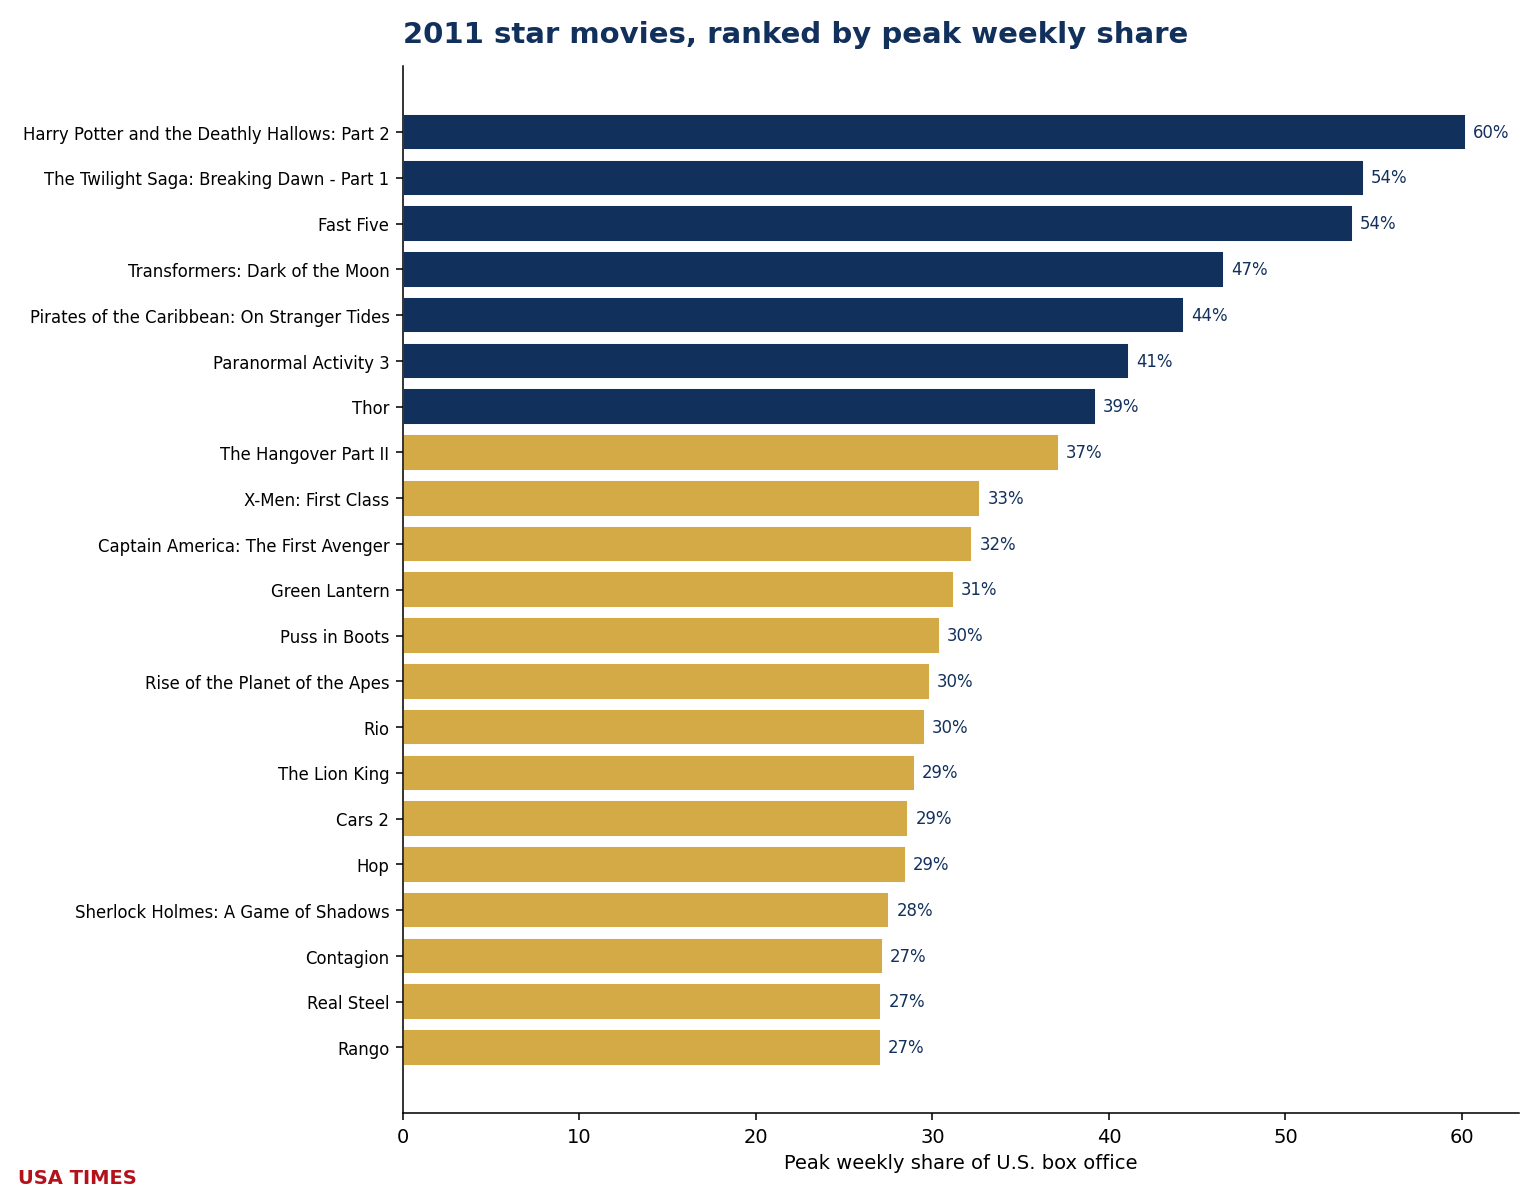
No film reached Geuse. The year’s ceiling is Harry Potter and the Deathly Hallows: Part 2 at 60.22% (W28), the 4th-lowest year-ceiling in the index, and one of five zero-Geuse years (2006, 2008, 2009, 2011, 2014). Six more peaked in Betelgeuse territory (38.2–61.8%): The Twilight Saga: Breaking Dawn – Part 1 (54.43%, W46), Fast Five (53.80%, W17), Transformers: Dark of the Moon (46.53%, W26), Pirates of the Caribbean: On Stranger Tides (44.23%, W20), Paranormal Activity 3 (41.16%, W42) and Thor (39.25%, W18). Fourteen finished as Mini-geuse-tier owners, from The Hangover Part II (37.17%) down to Rango (27.08%, the year’s narrowest clearance of the 26.18% bar).
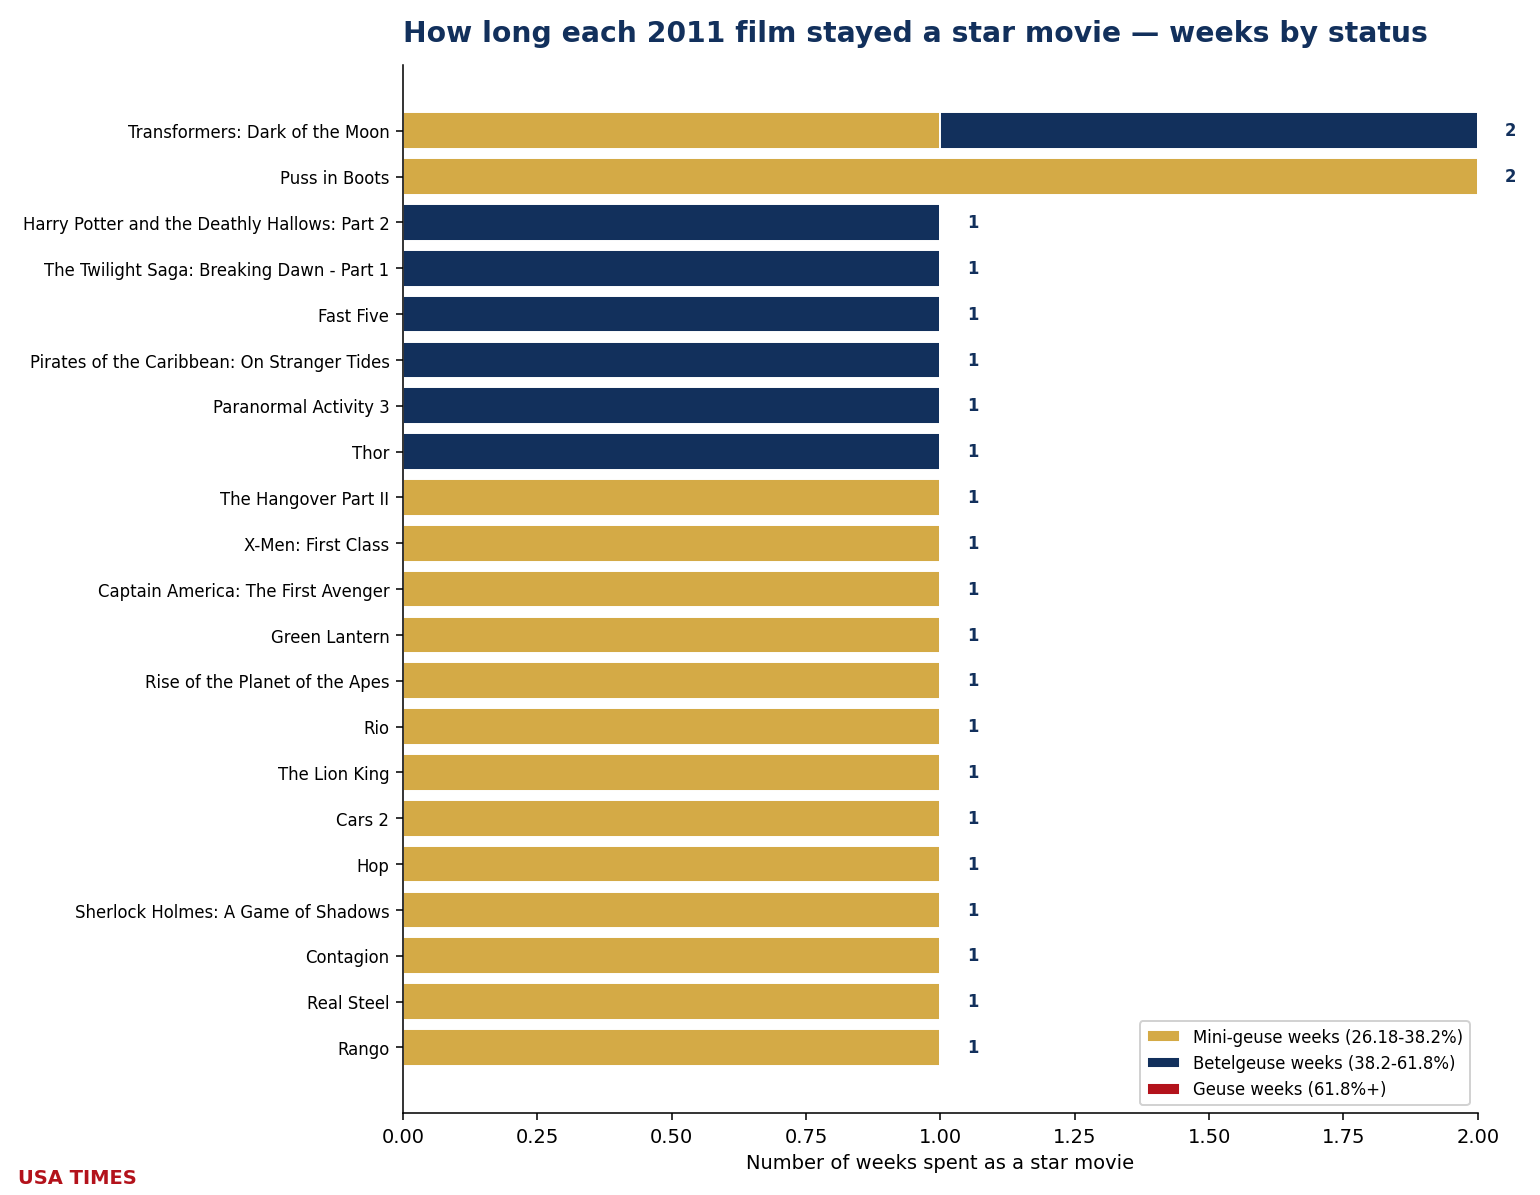
Two films tie for the longest hold at 2 weeks each: Transformers: Dark of the Moon and Puss in Boots. Nineteen of the twenty-one owners (90%) were one-week wonders. Money: 2011 is a clean-sweep year — all 20 owners with a reported budget finished at or above 1× that budget, one of fifteen such years in the twenty. The green arrows carry an asterisk, though: Green Lantern (1.19×) and Rango (1.82×) sit below the informal ~2× real-world breakeven line that marketing spend imposes. Best return of the year: Paranormal Activity 3 at 41.41×, the 3rd-best return anywhere in the twenty-year index. Concentration: the year’s owners took 18.8% of all domestic box office during the weeks they owned — the 3rd-lowest in the index.
The 2011 ledger
| Film | Peak share | Tier at peak | Weeks as event | WW gross | Budget* | WW / budget |
|---|---|---|---|---|---|---|
| Harry Potter and the Deathly Hallows: Part 2 | 60.22% (W28) | Betelgeuse | 1 | $1.342B | $125.0M | ▲ 10.73× |
| The Twilight Saga: Breaking Dawn – Part 1 | 54.43% (W46) | Betelgeuse | 1 | $712.2M | $110.0M | ▲ 6.47× |
| Fast Five | 53.80% (W17) | Betelgeuse | 1 | $626.1M | $125.0M | ▲ 5.01× |
| Transformers: Dark of the Moon | 46.53% (W26) | Betelgeuse | 2 | $1.124B | $195.0M | ▲ 5.76× |
| Pirates of the Caribbean: On Stranger Tides | 44.23% (W20) | Betelgeuse | 1 | $1.046B | $250.0M | ▲ 4.18× |
| Paranormal Activity 3 | 41.16% (W42) | Betelgeuse | 1 | $207.0M | $5.0M | ▲ 41.41× |
| Thor | 39.25% (W18) | Betelgeuse | 1 | $449.3M | $150.0M | ▲ 3.00× |
| The Hangover Part II | 37.17% (W21) | Mini-geuse | 1 | $586.8M | $80.0M | ▲ 7.33× |
| X-Men: First Class | 32.72% (W22) | Mini-geuse | 1 | $352.6M | $160.0M | ▲ 2.20× |
| Captain America: The First Avenger | 32.26% (W29) | Mini-geuse | 1 | $370.6M | $140.0M | ▲ 2.65× |
| Green Lantern | 31.23% (W24) | Mini-geuse | 1 | $237.2M | $200.0M | ▲ 1.19× |
| Puss in Boots | 30.42% (W43) | Mini-geuse | 2 | $555.0M | $130.0M | ▲ 4.27× |
| Rise of the Planet of the Apes | 29.84% (W31) | Mini-geuse | 1 | $481.8M | $93.0M | ▲ 5.18× |
| Rio | 29.55% (W15) | Mini-geuse | 1 | $483.9M | $90.0M | ▲ 5.38× |
| The Lion King | 28.99% (W37) | Mini-geuse | 1 | $186.0M | — | — |
| Cars 2 | 28.63% (W25) | Mini-geuse | 1 | $559.9M | $200.0M | ▲ 2.80× |
| Hop | 28.51% (W13) | Mini-geuse | 1 | $183.9M | $63.0M | ▲ 2.92× |
| Sherlock Holmes: A Game of Shadows | 27.55% (W50) | Mini-geuse | 1 | $543.9M | $125.0M | ▲ 4.35× |
| Contagion | 27.17% (W36) | Mini-geuse | 1 | $136.5M | $60.0M | ▲ 2.28× |
| Real Steel | 27.11% (W40) | Mini-geuse | 1 | $299.3M | $110.0M | ▲ 2.72× |
| Rango | 27.08% (W9) | Mini-geuse | 1 | $245.7M | $135.0M | ▲ 1.82× |
*Budgets are reported estimates (Box Office Mojo, The Numbers, trade press) and should be read as such. A green ▲ marks a film that returned at least its reported budget in worldwide gross; a red ▼ marks one that did not. Industry rules of thumb put real breakeven nearer 2–2.5× budget once print and advertising are counted, so a green arrow below that range is not the same as a profit.
2012: The Avengers tops the index’s first three-Geuse year
At $10.772 billion domestic across 52 chart weeks, 2012 produced eighteen distinct star movies (3 Geuse · 5 Betelgeuse · 10 Mini-geuse). Twenty-four of the year’s 52 measurable weeks had an owner; twenty-eight had none. One week carried two owners at once (W23).
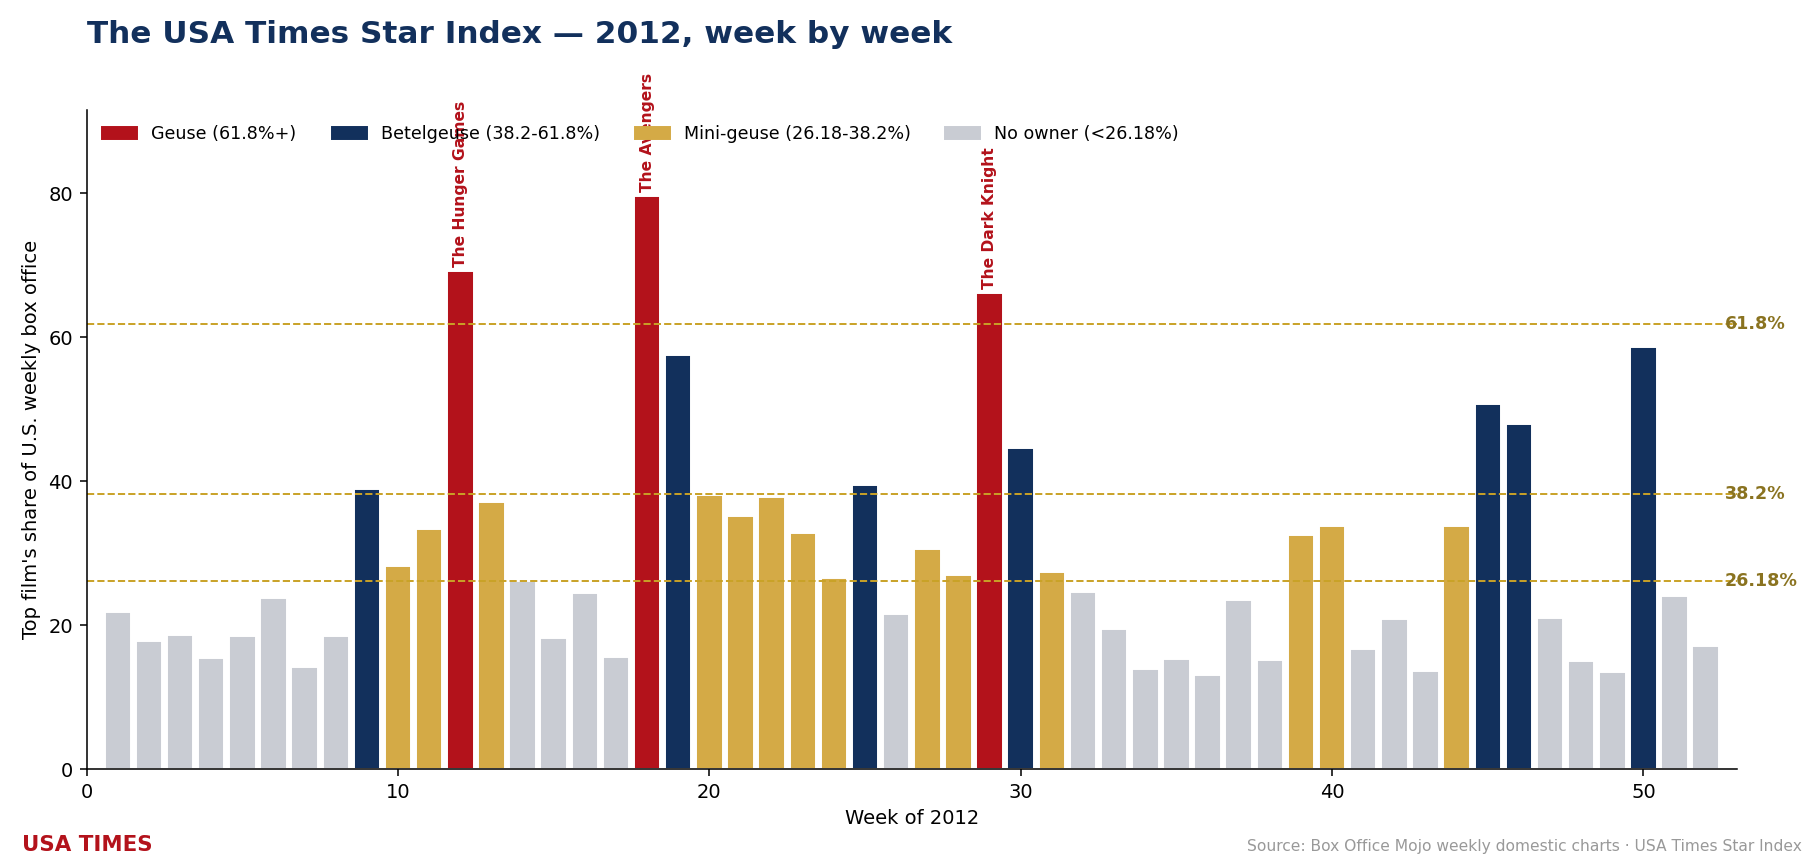
Three films cleared the 61.8% Geuse line: The Avengers (79.67%, W18), The Hunger Games (69.20%, W12) and The Dark Knight Rises (66.18%, W29). Five more peaked in Betelgeuse territory (38.2–61.8%): The Hobbit: An Unexpected Journey (58.65%, W50), Skyfall (50.71%, W45), The Twilight Saga: Breaking Dawn – Part 2 (47.97%, W46), Brave (39.52%, W25) and The Lorax (38.93%, W9). Ten finished as Mini-geuse-tier owners, from Snow White and the Huntsman (37.76%) down to Prometheus (26.50%, the year’s narrowest clearance of the 26.18% bar).
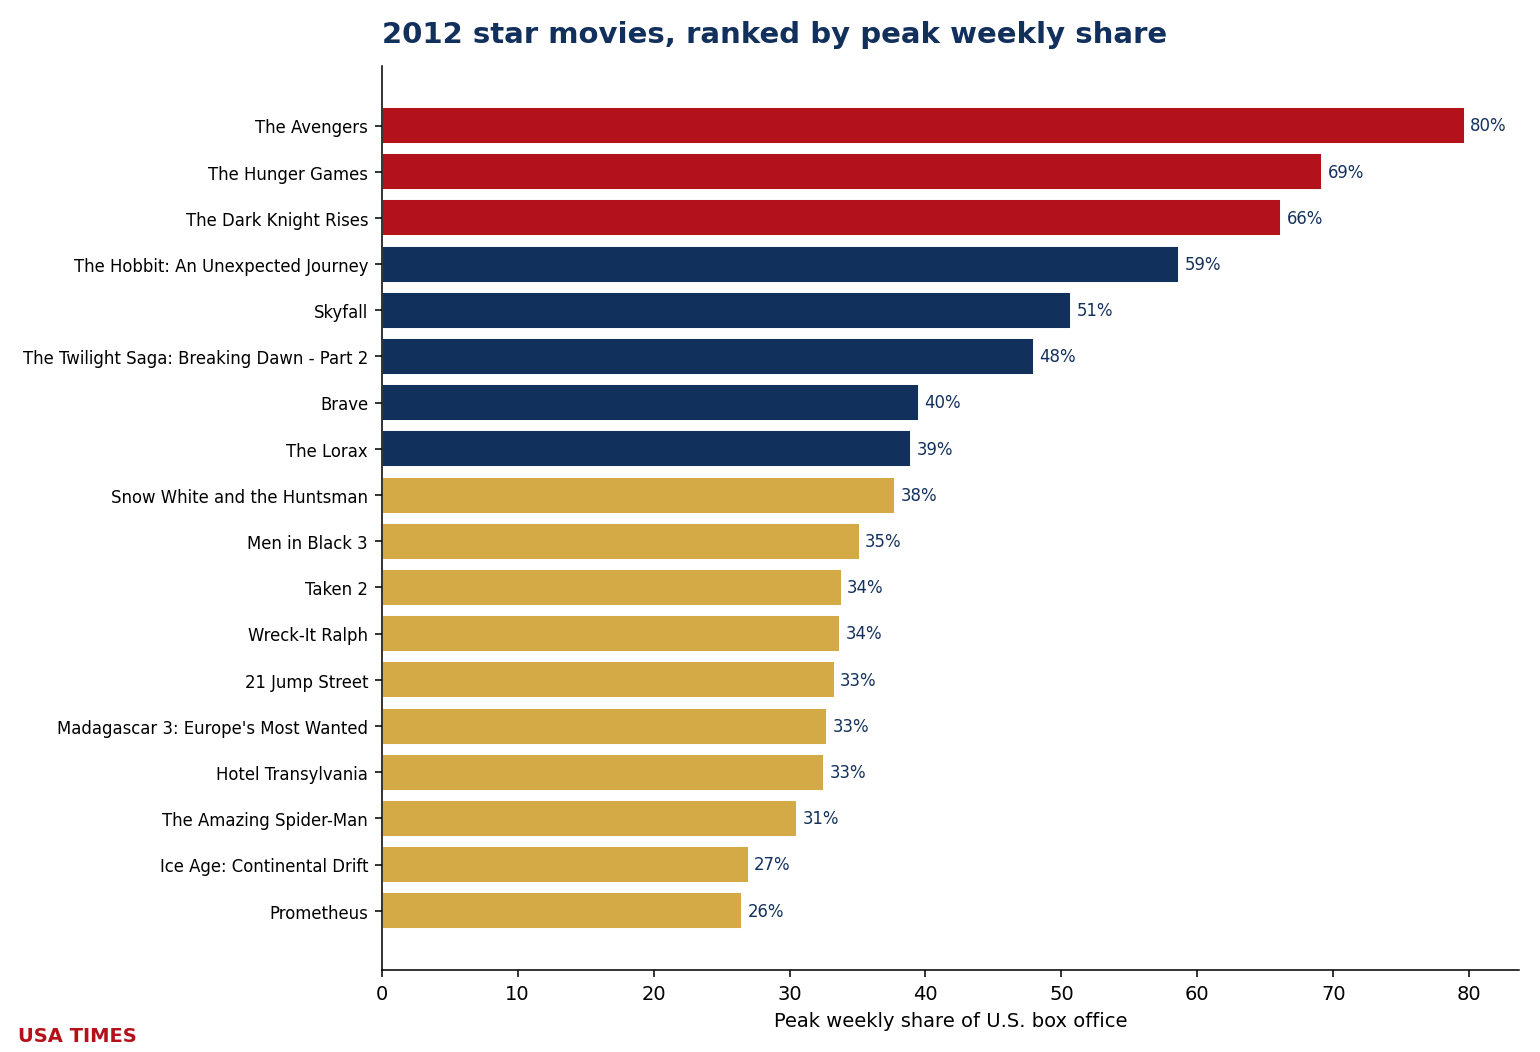
Two films tie for the longest hold at 3 weeks each: The Avengers and The Dark Knight Rises. Thirteen of the eighteen owners (72%) were one-week wonders. Money: 2012 is a clean-sweep year — all 18 owners with a reported budget finished at or above 1× that budget, one of fifteen such years in the twenty. Every owner cleared even the ~2× real-world breakeven line (floor: Snow White and the Huntsman, 2.33×). Best return of the year: Ice Age: Continental Drift at 9.23×. Concentration: the year’s owners took 23.3% of all domestic box office during the weeks they owned.
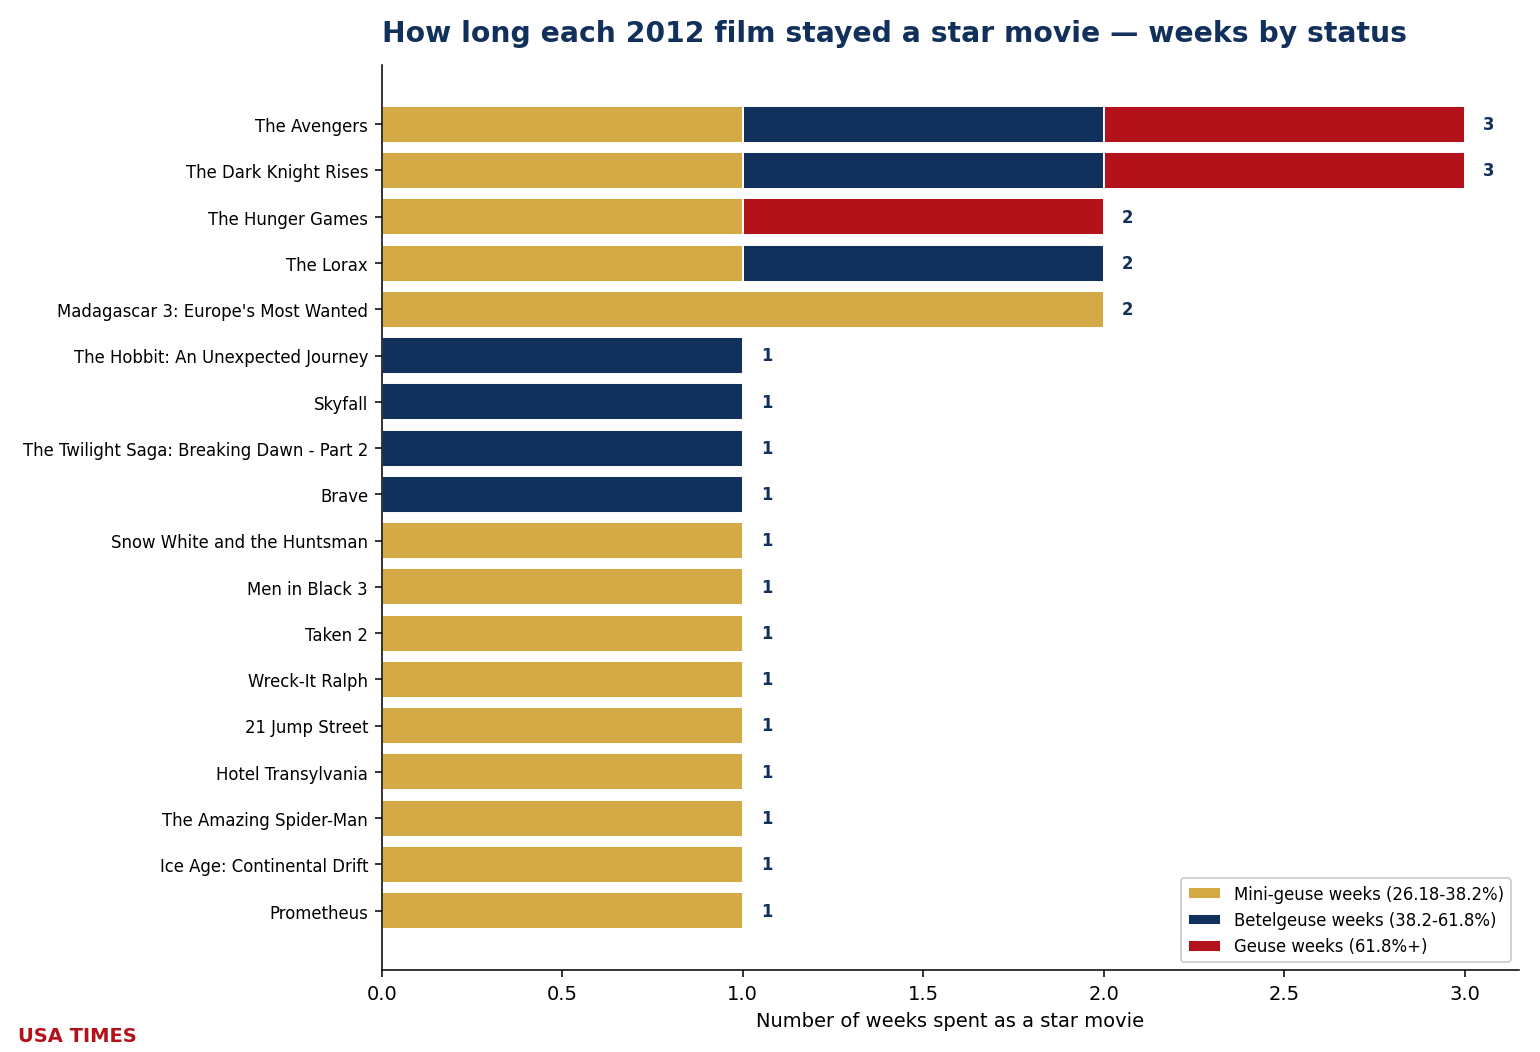
The 2012 ledger
| Film | Peak share | Tier at peak | Weeks as event | WW gross | Budget* | WW / budget |
|---|---|---|---|---|---|---|
| The Avengers | 79.67% (W18) | Geuse | 3 | $1.519B | $220.0M | ▲ 6.90× |
| The Hunger Games | 69.20% (W12) | Geuse | 2 | $694.4M | $78.0M | ▲ 8.90× |
| The Dark Knight Rises | 66.18% (W29) | Geuse | 3 | $1.085B | $250.0M | ▲ 4.34× |
| The Hobbit: An Unexpected Journey | 58.65% (W50) | Betelgeuse | 1 | $1.017B | $180.0M | ▲ 5.65× |
| Skyfall | 50.71% (W45) | Betelgeuse | 1 | $1.109B | $200.0M | ▲ 5.54× |
| The Twilight Saga: Breaking Dawn – Part 2 | 47.97% (W46) | Betelgeuse | 1 | $829.8M | $120.0M | ▲ 6.91× |
| Brave | 39.52% (W25) | Betelgeuse | 1 | $539.0M | $185.0M | ▲ 2.91× |
| The Lorax | 38.93% (W9) | Betelgeuse | 2 | $349.0M | $70.0M | ▲ 4.99× |
| Snow White and the Huntsman | 37.76% (W22) | Mini-geuse | 1 | $396.6M | $170.0M | ▲ 2.33× |
| Men in Black 3 | 35.16% (W21) | Mini-geuse | 1 | $654.2M | $225.0M | ▲ 2.91× |
| Taken 2 | 33.84% (W40) | Mini-geuse | 1 | $376.1M | $45.0M | ▲ 8.36× |
| Wreck-It Ralph | 33.73% (W44) | Mini-geuse | 1 | $471.2M | $165.0M | ▲ 2.86× |
| 21 Jump Street | 33.32% (W11) | Mini-geuse | 1 | $201.6M | $42.0M | ▲ 4.80× |
| Madagascar 3: Europe’s Most Wanted | 32.78% (W23) | Mini-geuse | 2 | $746.9M | $145.0M | ▲ 5.15× |
| Hotel Transylvania | 32.57% (W39) | Mini-geuse | 1 | $358.4M | $85.0M | ▲ 4.22× |
| The Amazing Spider-Man | 30.55% (W27) | Mini-geuse | 1 | $758.7M | $230.0M | ▲ 3.30× |
| Ice Age: Continental Drift | 27.00% (W28) | Mini-geuse | 1 | $877.2M | $95.0M | ▲ 9.23× |
| Prometheus | 26.50% (W23) | Mini-geuse | 1 | $403.4M | $130.0M | ▲ 3.10× |
*Budgets are reported estimates (Box Office Mojo, The Numbers, trade press) and should be read as such. A green ▲ marks a film that returned at least its reported budget in worldwide gross; a red ▼ marks one that did not. Industry rules of thumb put real breakeven nearer 2–2.5× budget once print and advertising are counted, so a green arrow below that range is not the same as a profit.
2013: Iron Man 3 and Catching Fire own the year
At $10.898 billion domestic across 52 chart weeks, 2013 produced twenty-one distinct star movies (2 Geuse · 6 Betelgeuse · 13 Mini-geuse). Twenty-five of the year’s 52 measurable weeks had an owner; twenty-seven had none. Four weeks carried two owners at once (W19, W25, W48, W49).
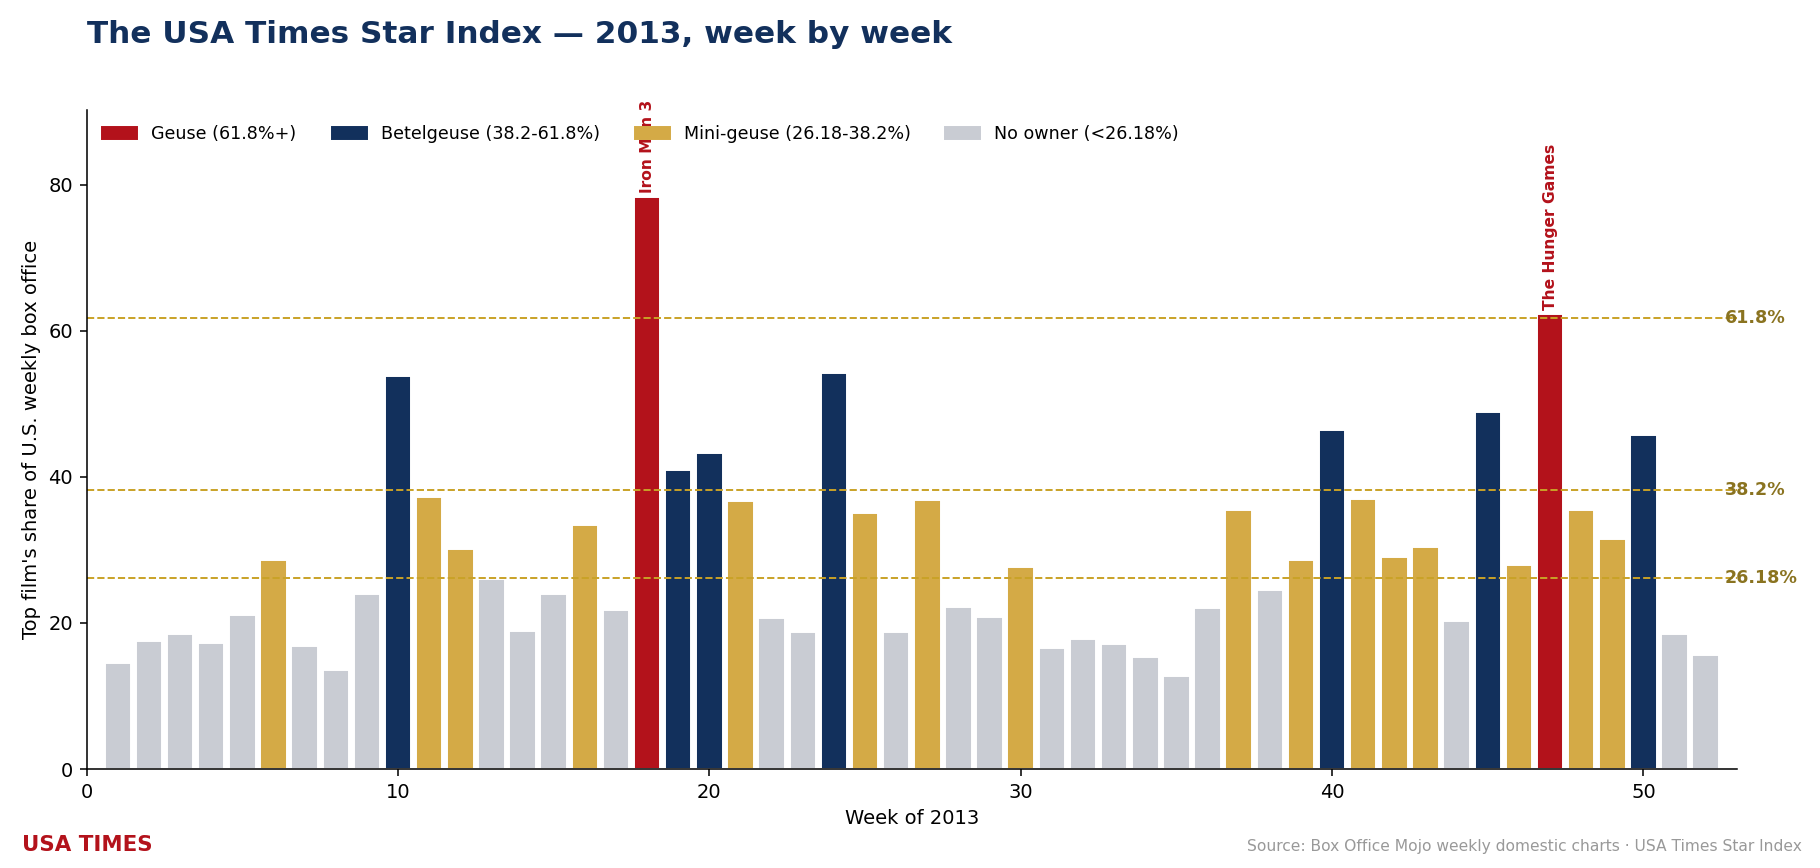
Two films cleared the 61.8% Geuse line: Iron Man 3 (78.31%, W18) and The Hunger Games: Catching Fire (62.31%, W47). Six more peaked in Betelgeuse territory (38.2–61.8%): Man of Steel (54.23%, W24), Oz the Great and Powerful (53.83%, W10), Thor: The Dark World (48.95%, W45), Gravity (46.41%, W40), The Hobbit: The Desolation of Smaug (45.71%, W50) and Star Trek Into Darkness (43.27%, W20). Thirteen finished as Mini-geuse-tier owners, from Despicable Me 2 (36.83%) down to World War Z (26.35%, the year’s narrowest clearance of the 26.18% bar).
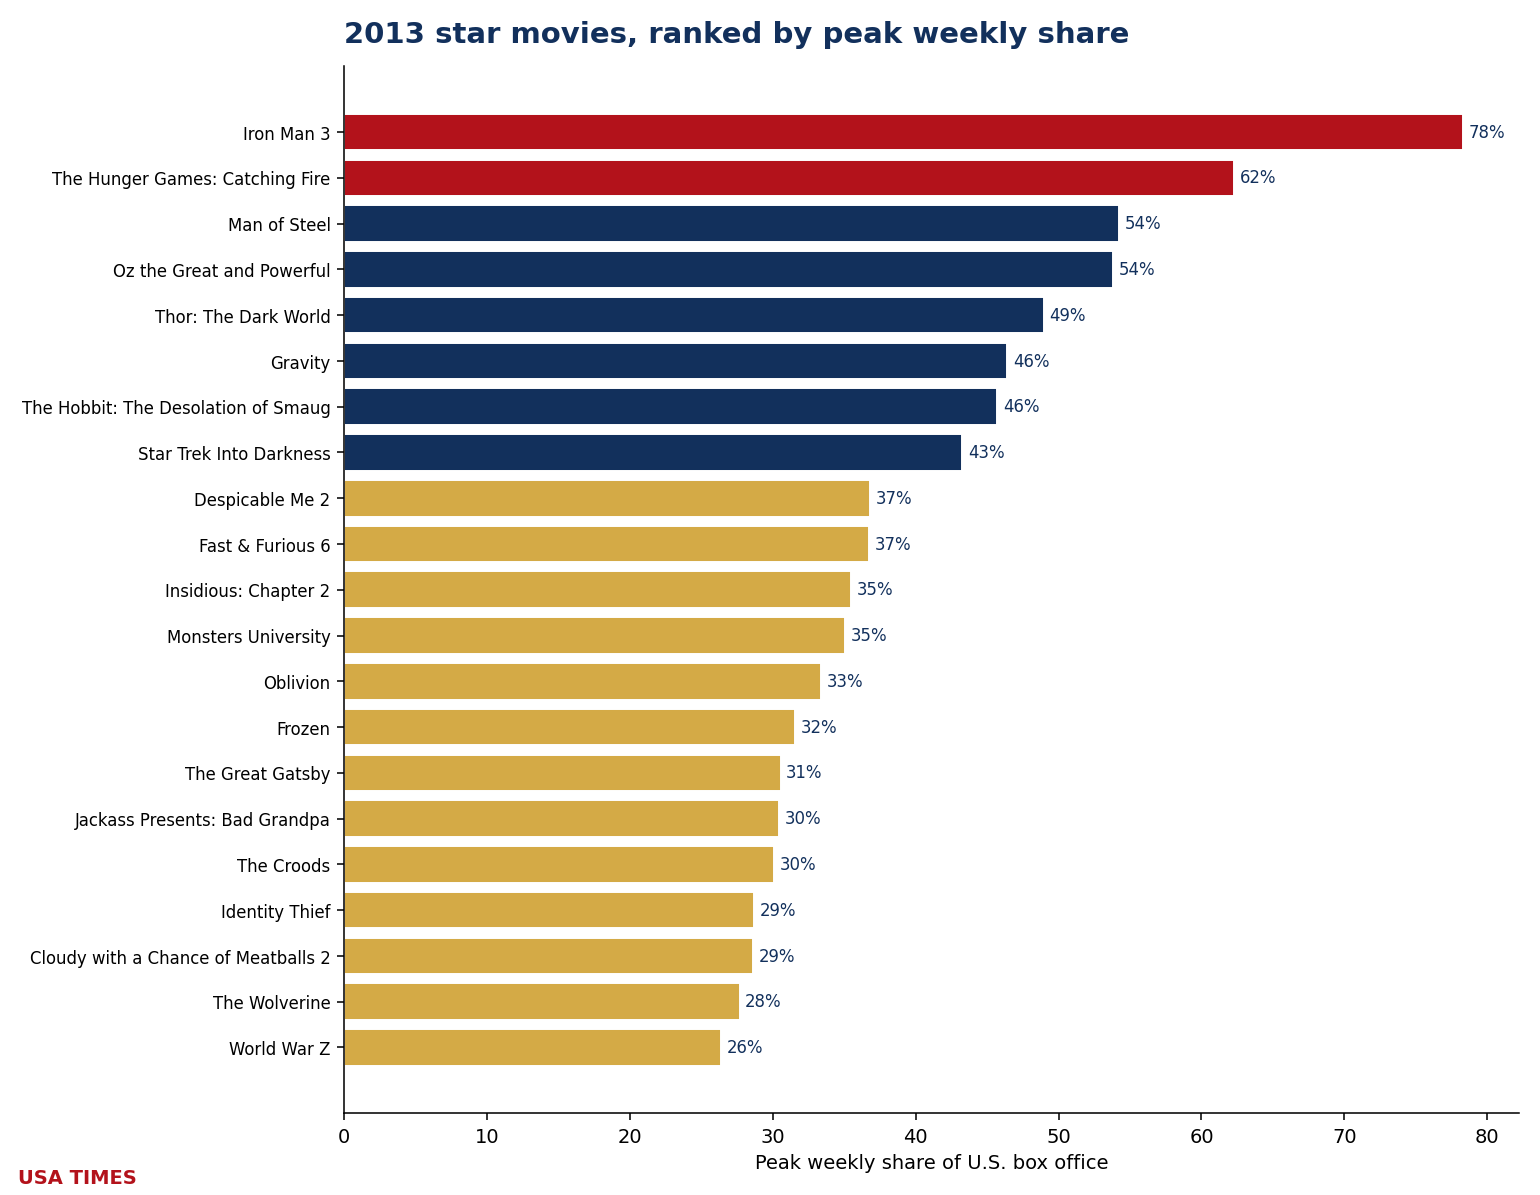
Two films tie for the longest hold at 3 weeks each: The Hunger Games: Catching Fire and Gravity. Fifteen of the twenty-one owners (71%) were one-week wonders. Money: 2013 is a clean-sweep year — all 21 owners with a reported budget finished at or above 1× that budget, one of fifteen such years in the twenty. Every owner cleared even the ~2× real-world breakeven line (floor: Oz the Great and Powerful, 2.29×). Best return of the year: Insidious: Chapter 2 at 32.38×, the 5th-best return anywhere in the twenty-year index. Concentration: the year’s owners took 22.9% of all domestic box office during the weeks they owned.
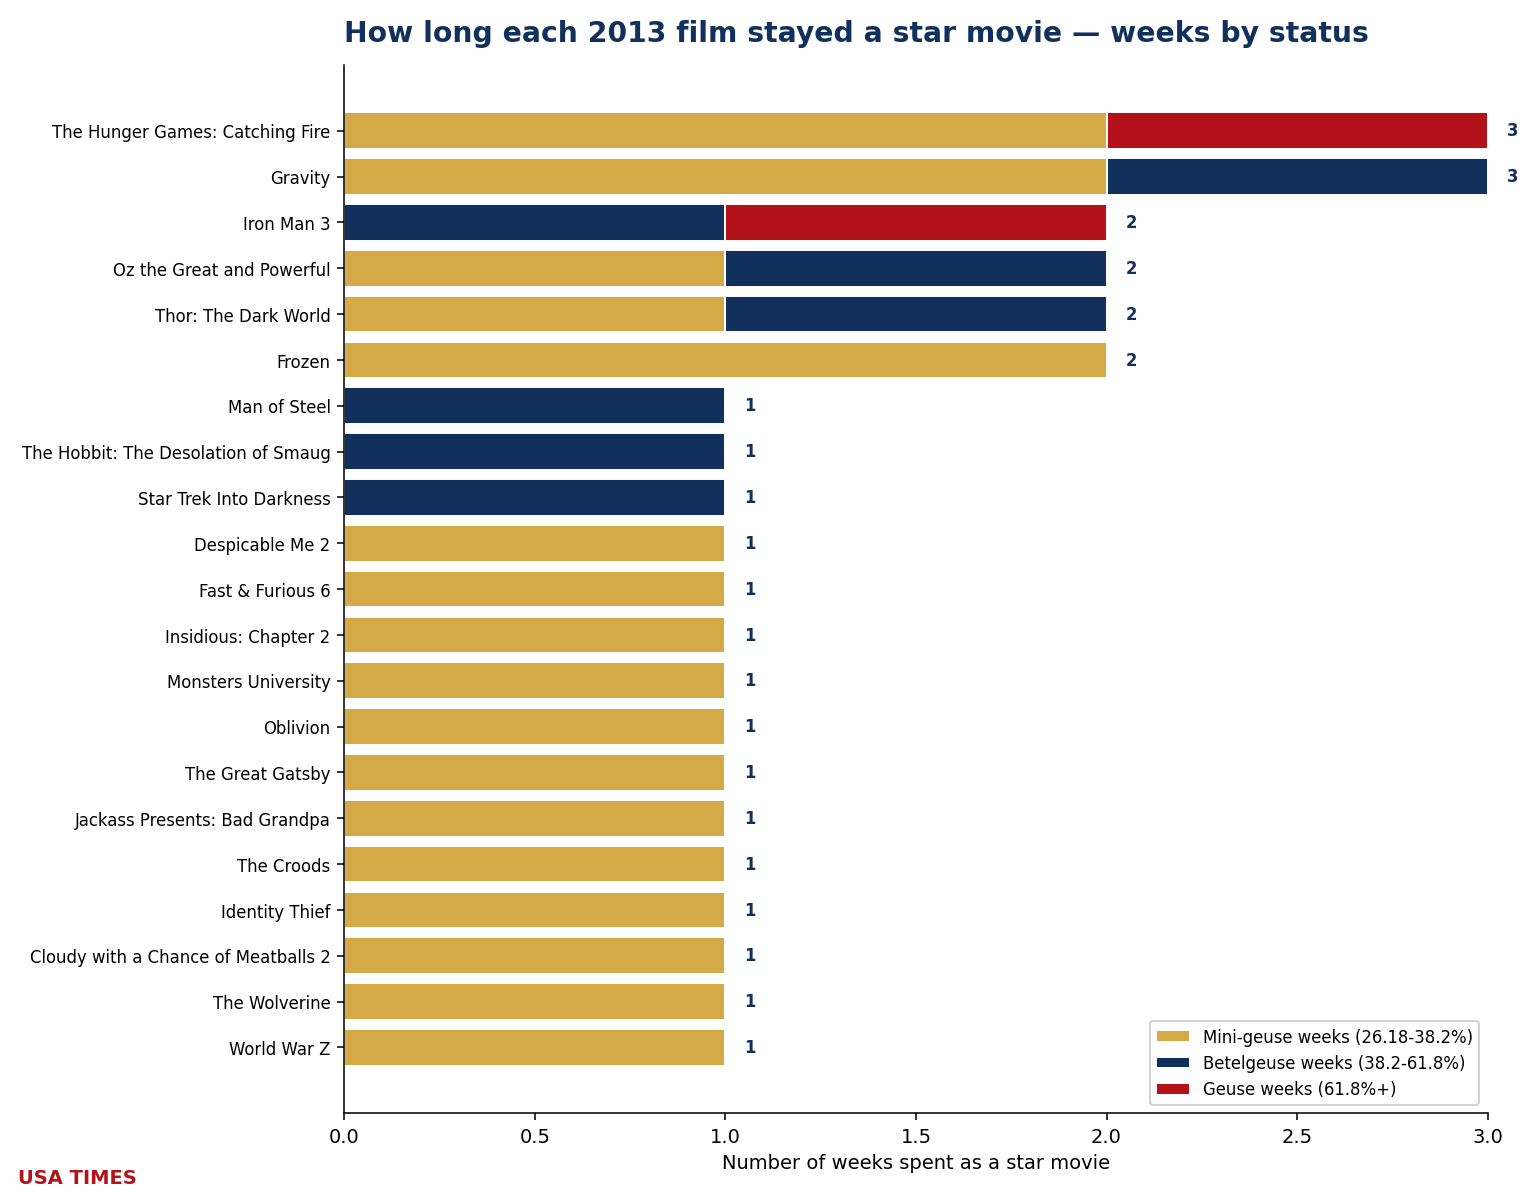
The 2013 ledger
| Film | Peak share | Tier at peak | Weeks as event | WW gross | Budget* | WW / budget |
|---|---|---|---|---|---|---|
| Iron Man 3 | 78.31% (W18) | Geuse | 2 | $1.216B | $200.0M | ▲ 6.08× |
| The Hunger Games: Catching Fire | 62.31% (W47) | Geuse | 3 | $865.0M | $130.0M | ▲ 6.65× |
| Man of Steel | 54.23% (W24) | Betelgeuse | 1 | $670.1M | $225.0M | ▲ 2.98× |
| Oz the Great and Powerful | 53.83% (W10) | Betelgeuse | 2 | $493.3M | $215.0M | ▲ 2.29× |
| Thor: The Dark World | 48.95% (W45) | Betelgeuse | 2 | $644.8M | $170.0M | ▲ 3.79× |
| Gravity | 46.41% (W40) | Betelgeuse | 3 | $723.8M | $100.0M | ▲ 7.24× |
| The Hobbit: The Desolation of Smaug | 45.71% (W50) | Betelgeuse | 1 | $960.4M | $225.0M | ▲ 4.27× |
| Star Trek Into Darkness | 43.27% (W20) | Betelgeuse | 1 | $467.4M | $190.0M | ▲ 2.46× |
| Despicable Me 2 | 36.83% (W27) | Mini-geuse | 1 | $970.8M | $76.0M | ▲ 12.77× |
| Fast & Furious 6 | 36.75% (W21) | Mini-geuse | 1 | $788.7M | $160.0M | ▲ 4.93× |
| Insidious: Chapter 2 | 35.46% (W37) | Mini-geuse | 1 | $161.9M | $5.0M | ▲ 32.38× |
| Monsters University | 35.02% (W25) | Mini-geuse | 1 | $743.6M | $200.0M | ▲ 3.72× |
| Oblivion | 33.39% (W16) | Mini-geuse | 1 | $286.2M | $120.0M | ▲ 2.38× |
| Frozen | 31.55% (W49) | Mini-geuse | 2 | $1.285B | $150.0M | ▲ 8.57× |
| The Great Gatsby | 30.54% (W19) | Mini-geuse | 1 | $353.6M | $105.0M | ▲ 3.37× |
| Jackass Presents: Bad Grandpa | 30.41% (W43) | Mini-geuse | 1 | $151.8M | $15.0M | ▲ 10.12× |
| The Croods | 30.08% (W12) | Mini-geuse | 1 | $587.2M | $135.0M | ▲ 4.35× |
| Identity Thief | 28.68% (W6) | Mini-geuse | 1 | $174.0M | $35.0M | ▲ 4.97× |
| Cloudy with a Chance of Meatballs 2 | 28.64% (W39) | Mini-geuse | 1 | $274.3M | $78.0M | ▲ 3.52× |
| The Wolverine | 27.67% (W30) | Mini-geuse | 1 | $414.8M | $120.0M | ▲ 3.46× |
| World War Z | 26.35% (W25) | Mini-geuse | 1 | $540.0M | $190.0M | ▲ 2.84× |
*Budgets are reported estimates (Box Office Mojo, The Numbers, trade press) and should be read as such. A green ▲ marks a film that returned at least its reported budget in worldwide gross; a red ▼ marks one that did not. Industry rules of thumb put real breakeven nearer 2–2.5× budget once print and advertising are counted, so a green arrow below that range is not the same as a profit.
2014: a wide, flat year with nothing at the top
At $10.324 billion domestic across 52 chart weeks, 2014 produced twenty-five distinct star movies (0 Geuse · 10 Betelgeuse · 15 Mini-geuse). Twenty-nine of the year’s 52 measurable weeks had an owner; twenty-three had none. One week carried two owners at once (W45).
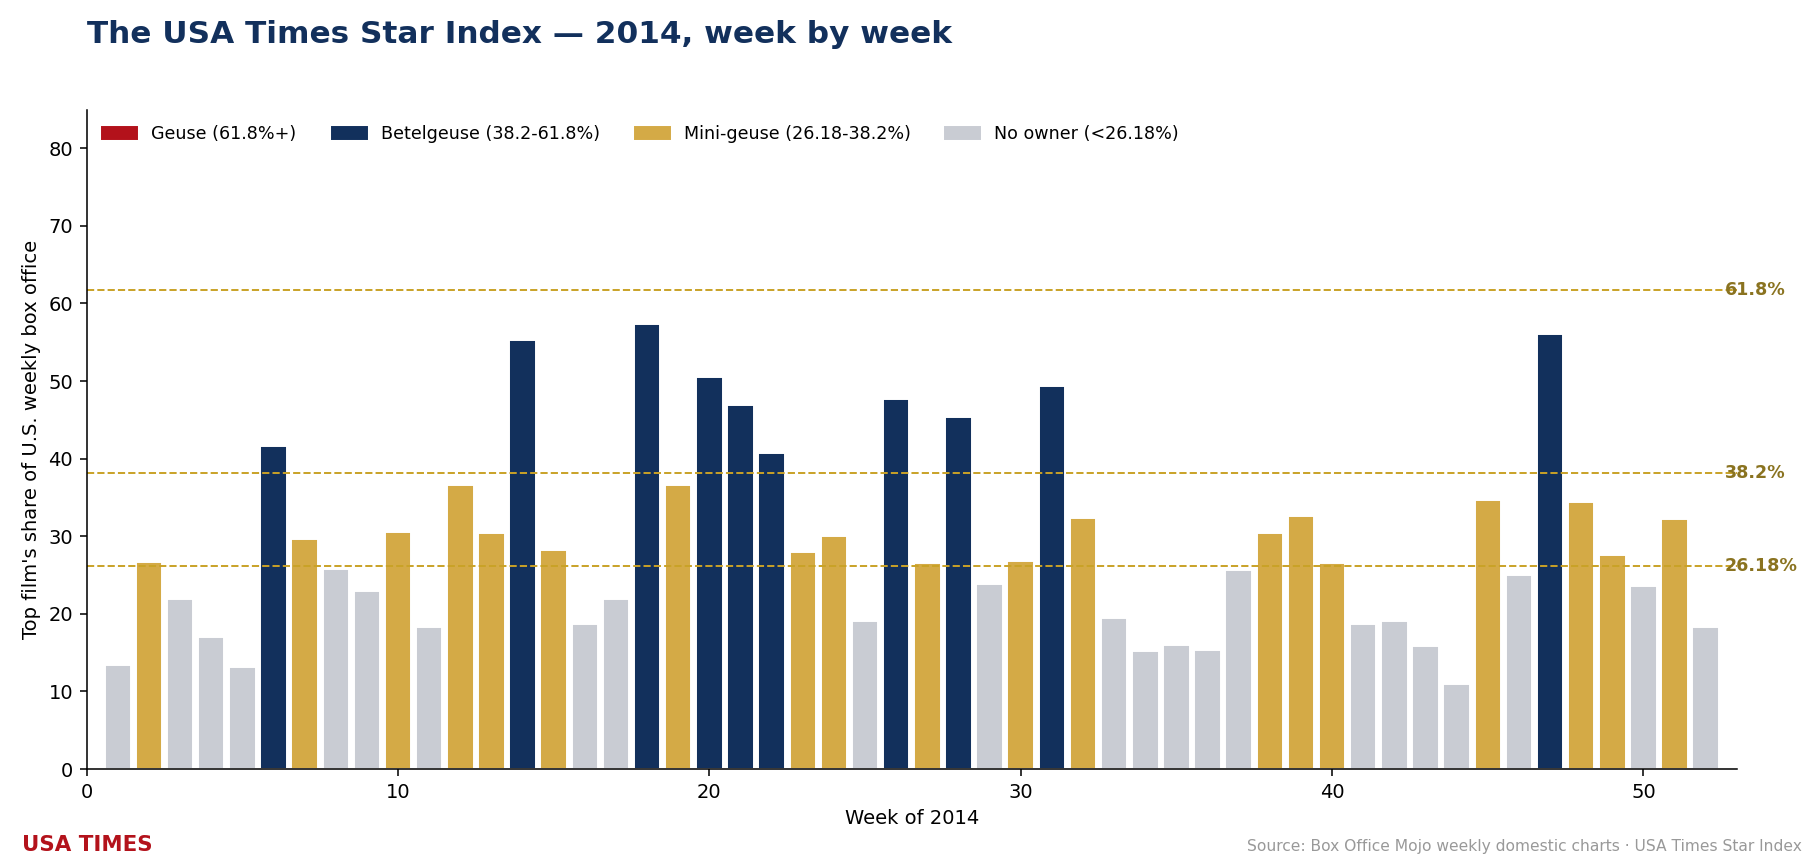
No film reached Geuse. The year’s ceiling is The Amazing Spider-Man 2 at 57.30% (W18), the 2nd-lowest year-ceiling in the index, and one of five zero-Geuse years (2006, 2008, 2009, 2011, 2014). Nine more peaked in Betelgeuse territory (38.2–61.8%): The Hunger Games: Mockingjay – Part 1 (56.04%, W47), Captain America: The Winter Soldier (55.32%, W14), Godzilla (50.50%, W20), Guardians of the Galaxy (49.41%, W31), Transformers: Age of Extinction (47.72%, W26) and X-Men: Days of Future Past (46.87%, W21), plus three more. Fifteen finished as Mini-geuse-tier owners, from Neighbors (36.60%) down to Gone Girl (26.57%, the year’s narrowest clearance of the 26.18% bar).
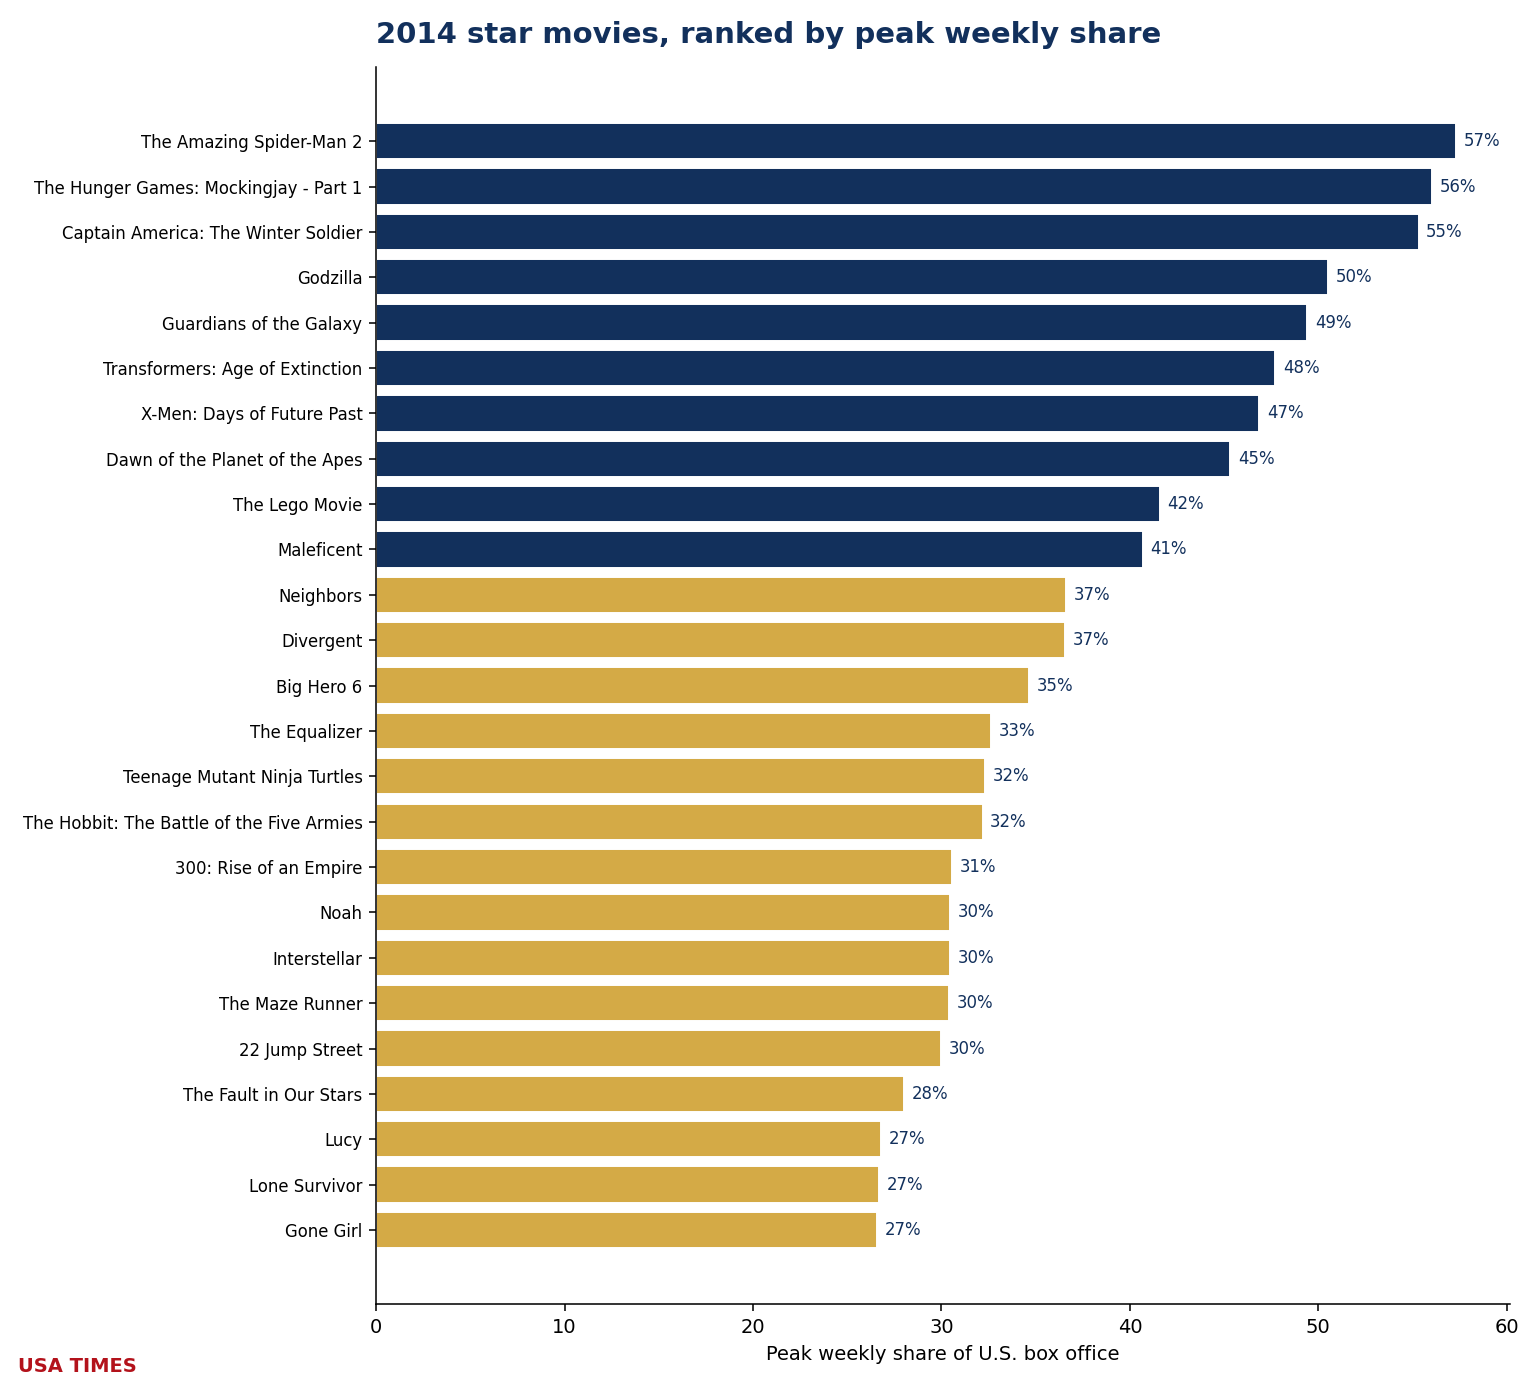
Longest hold: The Hunger Games: Mockingjay – Part 1 at 3 weeks as a star movie. Twenty-one of the twenty-five owners (84%) were one-week wonders. Money: 2014 is a clean-sweep year — all 25 owners with a reported budget finished at or above 1× that budget, one of fifteen such years in the twenty. Every owner cleared even the ~2× real-world breakeven line (floor: Noah, 2.87×). Best return of the year: The Fault in Our Stars at 25.60×, the 8th-best return anywhere in the twenty-year index. Concentration: the year’s owners took 23.7% of all domestic box office during the weeks they owned.
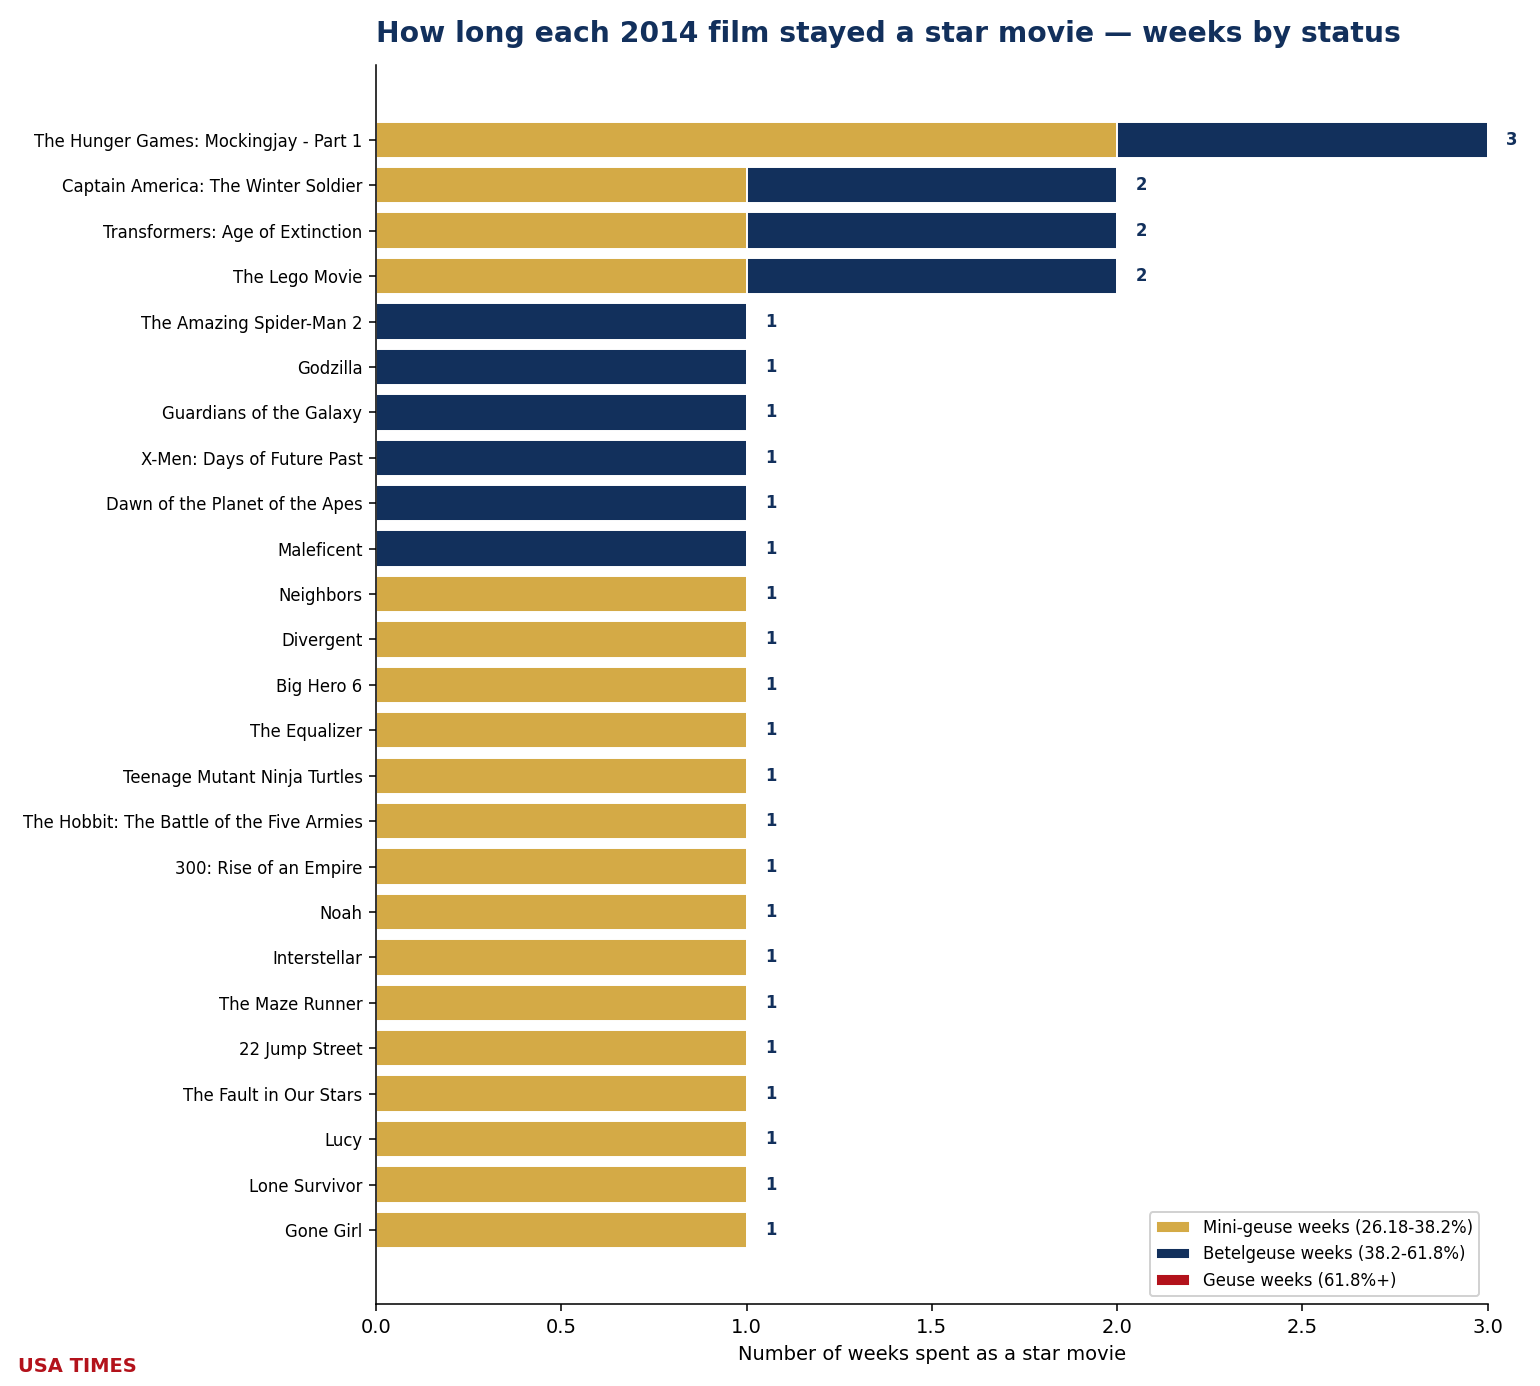
The 2014 ledger
| Film | Peak share | Tier at peak | Weeks as event | WW gross | Budget* | WW / budget |
|---|---|---|---|---|---|---|
| The Amazing Spider-Man 2 | 57.30% (W18) | Betelgeuse | 1 | $709.0M | $200.0M | ▲ 3.54× |
| The Hunger Games: Mockingjay – Part 1 | 56.04% (W47) | Betelgeuse | 3 | $758.8M | $125.0M | ▲ 6.07× |
| Captain America: The Winter Soldier | 55.32% (W14) | Betelgeuse | 2 | $714.4M | $170.0M | ▲ 4.20× |
| Godzilla | 50.50% (W20) | Betelgeuse | 1 | $525.0M | $160.0M | ▲ 3.28× |
| Guardians of the Galaxy | 49.41% (W31) | Betelgeuse | 1 | $772.8M | $170.0M | ▲ 4.55× |
| Transformers: Age of Extinction | 47.72% (W26) | Betelgeuse | 2 | $1.105B | $210.0M | ▲ 5.26× |
| X-Men: Days of Future Past | 46.87% (W21) | Betelgeuse | 1 | $746.0M | $200.0M | ▲ 3.73× |
| Dawn of the Planet of the Apes | 45.33% (W28) | Betelgeuse | 1 | $710.6M | $170.0M | ▲ 4.18× |
| The Lego Movie | 41.59% (W6) | Betelgeuse | 2 | $468.1M | $60.0M | ▲ 7.80× |
| Maleficent | 40.70% (W22) | Betelgeuse | 1 | $758.4M | $180.0M | ▲ 4.21× |
| Neighbors | 36.60% (W19) | Mini-geuse | 1 | $270.7M | $18.0M | ▲ 15.04× |
| Divergent | 36.55% (W12) | Mini-geuse | 1 | $288.9M | $85.0M | ▲ 3.40× |
| Big Hero 6 | 34.66% (W45) | Mini-geuse | 1 | $672.1M | $165.0M | ▲ 4.07× |
| The Equalizer | 32.64% (W39) | Mini-geuse | 1 | $192.3M | $55.0M | ▲ 3.50× |
| Teenage Mutant Ninja Turtles | 32.31% (W32) | Mini-geuse | 1 | $485.0M | $125.0M | ▲ 3.88× |
| The Hobbit: The Battle of the Five Armies | 32.18% (W51) | Mini-geuse | 1 | $956.0M | $250.0M | ▲ 3.82× |
| 300: Rise of an Empire | 30.56% (W10) | Mini-geuse | 1 | $337.6M | $110.0M | ▲ 3.07× |
| Noah | 30.45% (W13) | Mini-geuse | 1 | $359.2M | $125.0M | ▲ 2.87× |
| Interstellar | 30.45% (W45) | Mini-geuse | 1 | $764.3M | $165.0M | ▲ 4.63× |
| The Maze Runner | 30.41% (W38) | Mini-geuse | 1 | $348.3M | $34.0M | ▲ 10.24× |
| 22 Jump Street | 29.98% (W24) | Mini-geuse | 1 | $331.3M | $50.0M | ▲ 6.63× |
| The Fault in Our Stars | 28.00% (W23) | Mini-geuse | 1 | $307.2M | $12.0M | ▲ 25.60× |
| Lucy | 26.81% (W30) | Mini-geuse | 1 | $469.1M | $40.0M | ▲ 11.73× |
| Lone Survivor | 26.70% (W2) | Mini-geuse | 1 | $154.8M | $40.0M | ▲ 3.87× |
| Gone Girl | 26.57% (W40) | Mini-geuse | 1 | $370.9M | $61.0M | ▲ 6.08× |
*Budgets are reported estimates (Box Office Mojo, The Numbers, trade press) and should be read as such. A green ▲ marks a film that returned at least its reported budget in worldwide gross; a red ▼ marks one that did not. Industry rules of thumb put real breakeven nearer 2–2.5× budget once print and advertising are counted, so a green arrow below that range is not the same as a profit.
2015: four Geuse blockbusters and a concentration jump
At $11.046 billion domestic across 52 chart weeks, 2015 produced twenty-four distinct star movies (4 Geuse · 6 Betelgeuse · 14 Mini-geuse). Thirty-one of the year’s 52 measurable weeks had an owner; twenty-one had none. Five weeks carried two owners at once (W12, W20, W25, W26, W45).
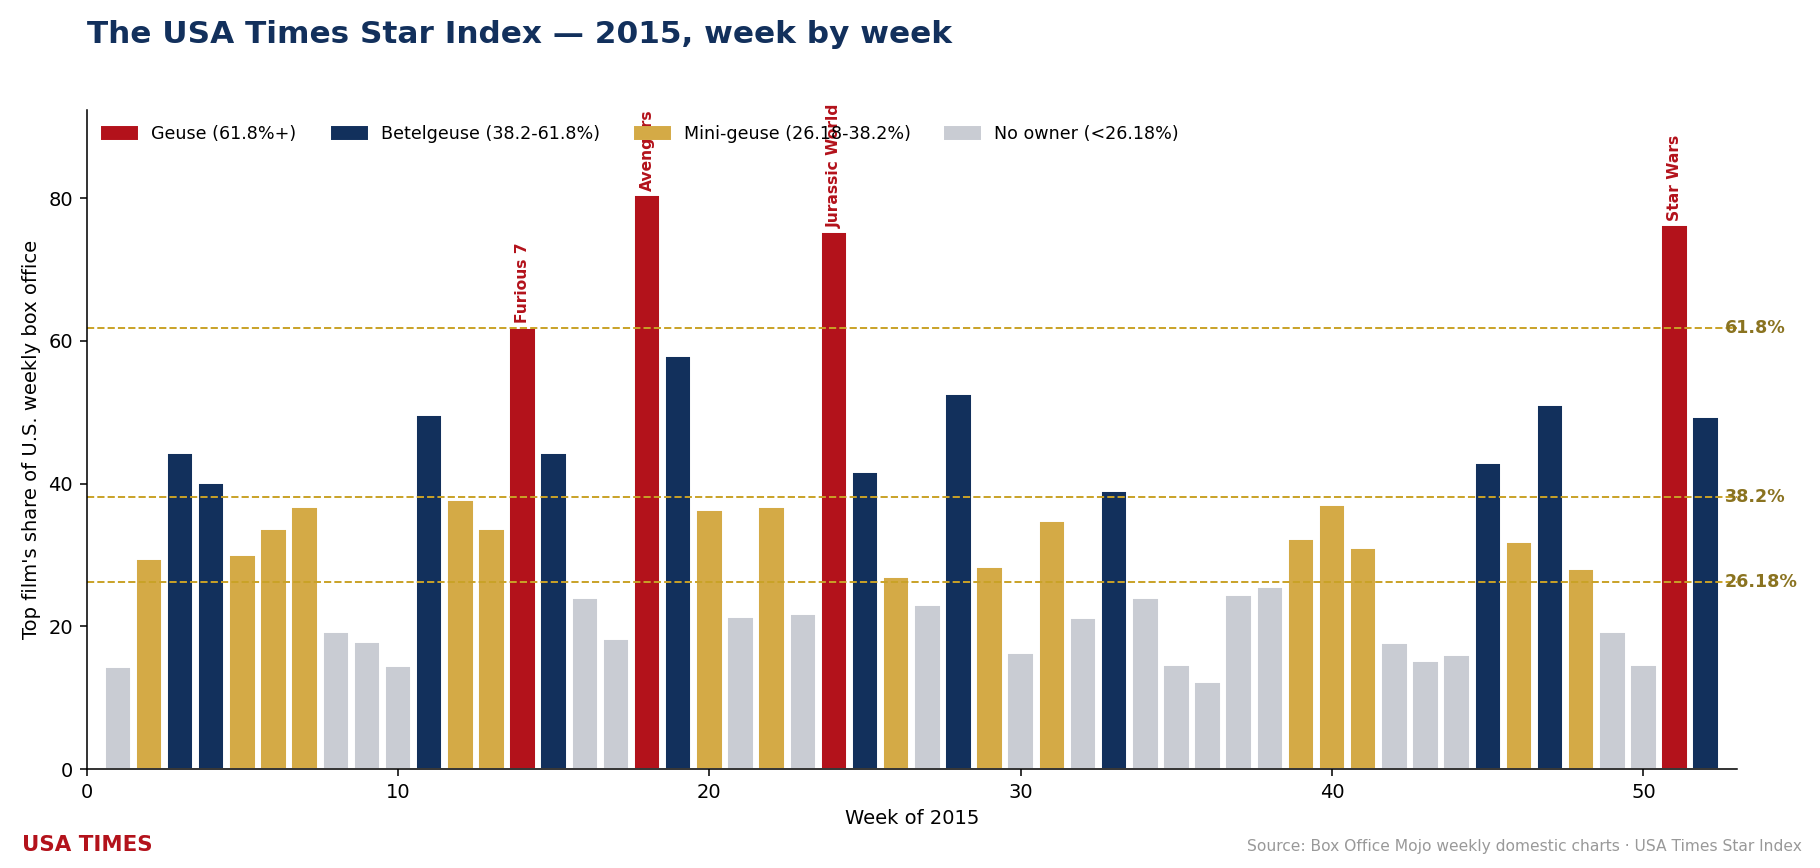
Four films cleared the 61.8% Geuse line: Avengers: Age of Ultron (80.44%, W18), Star Wars: Episode VII – The Force Awakens (76.25%, W51), Jurassic World (75.24%, W24) and Furious 7 (61.88%, W14). Six more peaked in Betelgeuse territory (38.2–61.8%): Minions (52.50%, W28), The Hunger Games: Mockingjay – Part 2 (50.98%, W47), Cinderella (49.61%, W11), American Sniper (44.26%, W3), Spectre (42.86%, W45) and Straight Outta Compton (39.00%, W33). Fourteen finished as Mini-geuse-tier owners, from The Divergent Series: Insurgent (37.76%) down to The Peanuts Movie (26.22%, the year’s narrowest clearance of the 26.18% bar).
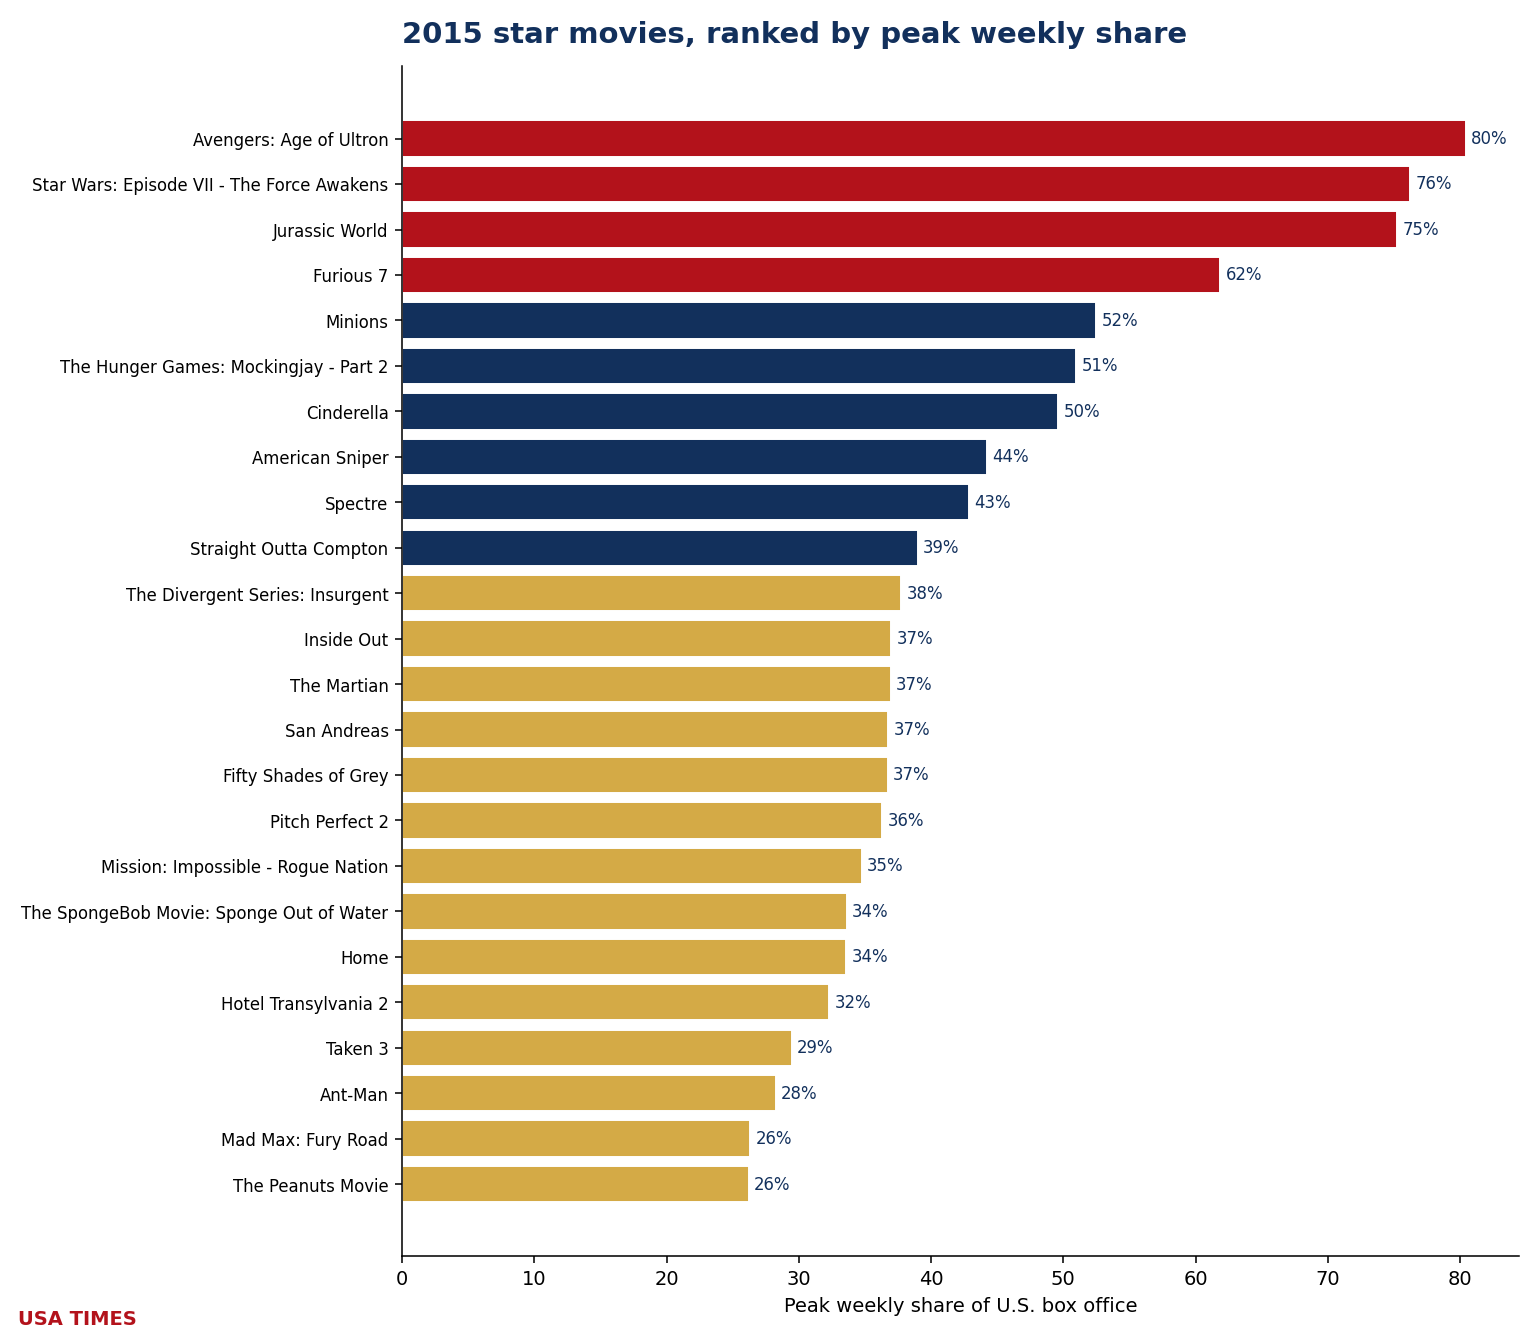
Two films tie for the longest hold at 3 weeks each: Jurassic World and American Sniper. Fourteen of the twenty-four owners (58%) were one-week wonders. Money: 2015 is a clean-sweep year — all 24 owners with a reported budget finished at or above 1× that budget, one of fifteen such years in the twenty. Every owner cleared even the ~2× real-world breakeven line (floor: The Peanuts Movie, 2.49×). Best return of the year: Minions at 15.67×. Concentration: the year’s owners took 35.8% of all domestic box office during the weeks they owned.
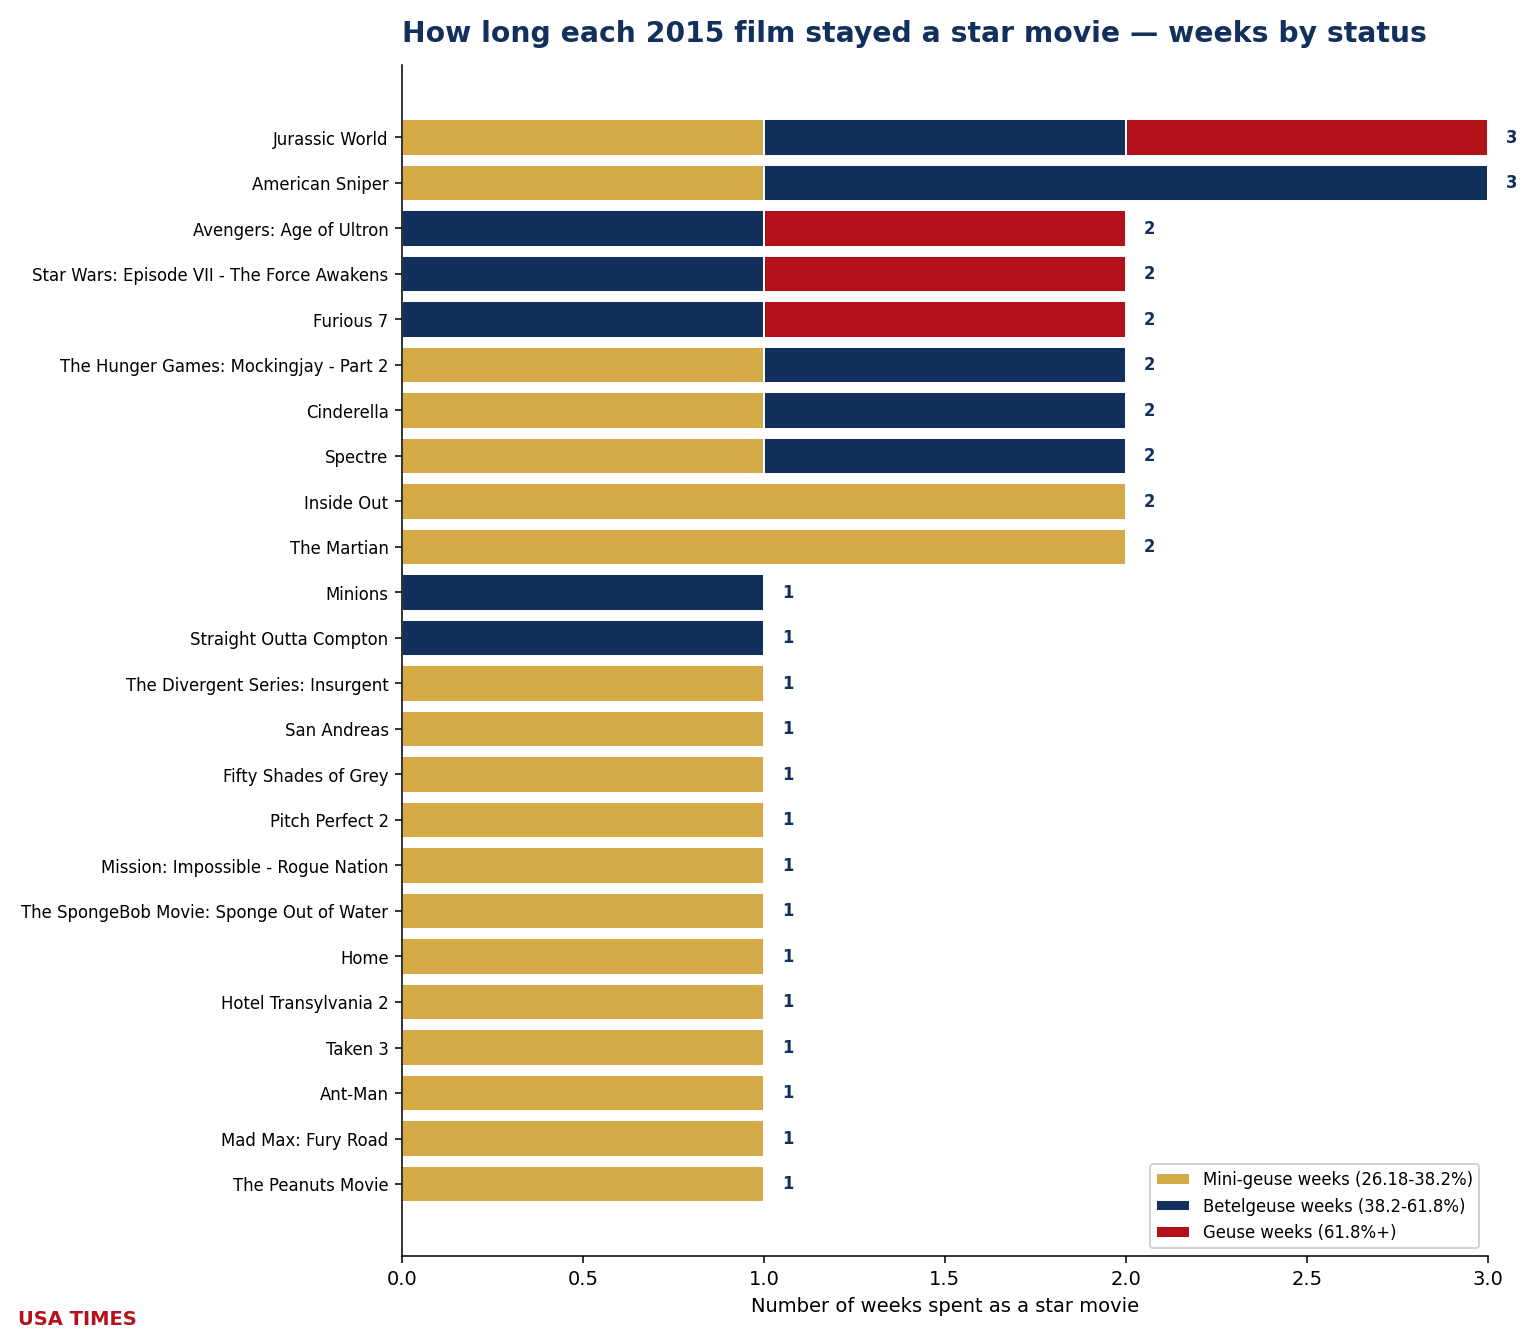
The 2015 ledger
| Film | Peak share | Tier at peak | Weeks as event | WW gross | Budget* | WW / budget |
|---|---|---|---|---|---|---|
| Avengers: Age of Ultron | 80.44% (W18) | Geuse | 2 | $1.403B | $250.0M | ▲ 5.61× |
| Star Wars: Episode VII – The Force Awakens | 76.25% (W51) | Geuse | 2 | $2.068B | $245.0M | ▲ 8.44× |
| Jurassic World | 75.24% (W24) | Geuse | 3 | $1.670B | $150.0M | ▲ 11.14× |
| Furious 7 | 61.88% (W14) | Geuse | 2 | $1.515B | $190.0M | ▲ 7.97× |
| Minions | 52.50% (W28) | Betelgeuse | 1 | $1.159B | $74.0M | ▲ 15.67× |
| The Hunger Games: Mockingjay – Part 2 | 50.98% (W47) | Betelgeuse | 2 | $653.4M | $160.0M | ▲ 4.08× |
| Cinderella | 49.61% (W11) | Betelgeuse | 2 | $542.4M | $95.0M | ▲ 5.71× |
| American Sniper | 44.26% (W3) | Betelgeuse | 3 | $547.6M | $58.8M | ▲ 9.31× |
| Spectre | 42.86% (W45) | Betelgeuse | 2 | $880.7M | $245.0M | ▲ 3.59× |
| Straight Outta Compton | 39.00% (W33) | Betelgeuse | 1 | $201.6M | $28.0M | ▲ 7.20× |
| The Divergent Series: Insurgent | 37.76% (W12) | Mini-geuse | 1 | $297.0M | $110.0M | ▲ 2.70× |
| Inside Out | 36.99% (W25) | Mini-geuse | 2 | $858.3M | $175.0M | ▲ 4.90× |
| The Martian | 36.95% (W40) | Mini-geuse | 2 | $630.2M | $108.0M | ▲ 5.84× |
| San Andreas | 36.76% (W22) | Mini-geuse | 1 | $474.6M | $110.0M | ▲ 4.31× |
| Fifty Shades of Grey | 36.72% (W7) | Mini-geuse | 1 | $569.7M | $40.0M | ▲ 14.24× |
| Pitch Perfect 2 | 36.31% (W20) | Mini-geuse | 1 | $287.1M | $29.0M | ▲ 9.90× |
| Mission: Impossible – Rogue Nation | 34.76% (W31) | Mini-geuse | 1 | $682.7M | $150.0M | ▲ 4.55× |
| The SpongeBob Movie: Sponge Out of Water | 33.63% (W6) | Mini-geuse | 1 | $325.2M | $74.0M | ▲ 4.39× |
| Home | 33.59% (W13) | Mini-geuse | 1 | $386.0M | $135.0M | ▲ 2.86× |
| Hotel Transylvania 2 | 32.31% (W39) | Mini-geuse | 1 | $474.8M | $80.0M | ▲ 5.94× |
| Taken 3 | 29.46% (W2) | Mini-geuse | 1 | $326.5M | $48.0M | ▲ 6.80× |
| Ant-Man | 28.26% (W29) | Mini-geuse | 1 | $519.3M | $130.0M | ▲ 3.99× |
| Mad Max: Fury Road | 26.33% (W20) | Mini-geuse | 1 | $379.4M | $150.0M | ▲ 2.53× |
| The Peanuts Movie | 26.22% (W45) | Mini-geuse | 1 | $246.2M | $99.0M | ▲ 2.49× |
*Budgets are reported estimates (Box Office Mojo, The Numbers, trade press) and should be read as such. A green ▲ marks a film that returned at least its reported budget in worldwide gross; a red ▼ marks one that did not. Industry rules of thumb put real breakeven nearer 2–2.5× budget once print and advertising are counted, so a green arrow below that range is not the same as a profit.
2016: the busiest pre-pandemic year the index has measured
At $11.561 billion domestic across 53 chart weeks, 2016 produced twenty-two distinct star movies (2 Geuse · 10 Betelgeuse · 10 Mini-geuse). Thirty-four of the year’s 53 measurable weeks had an owner; nineteen had none. One week carried two owners at once (W29).
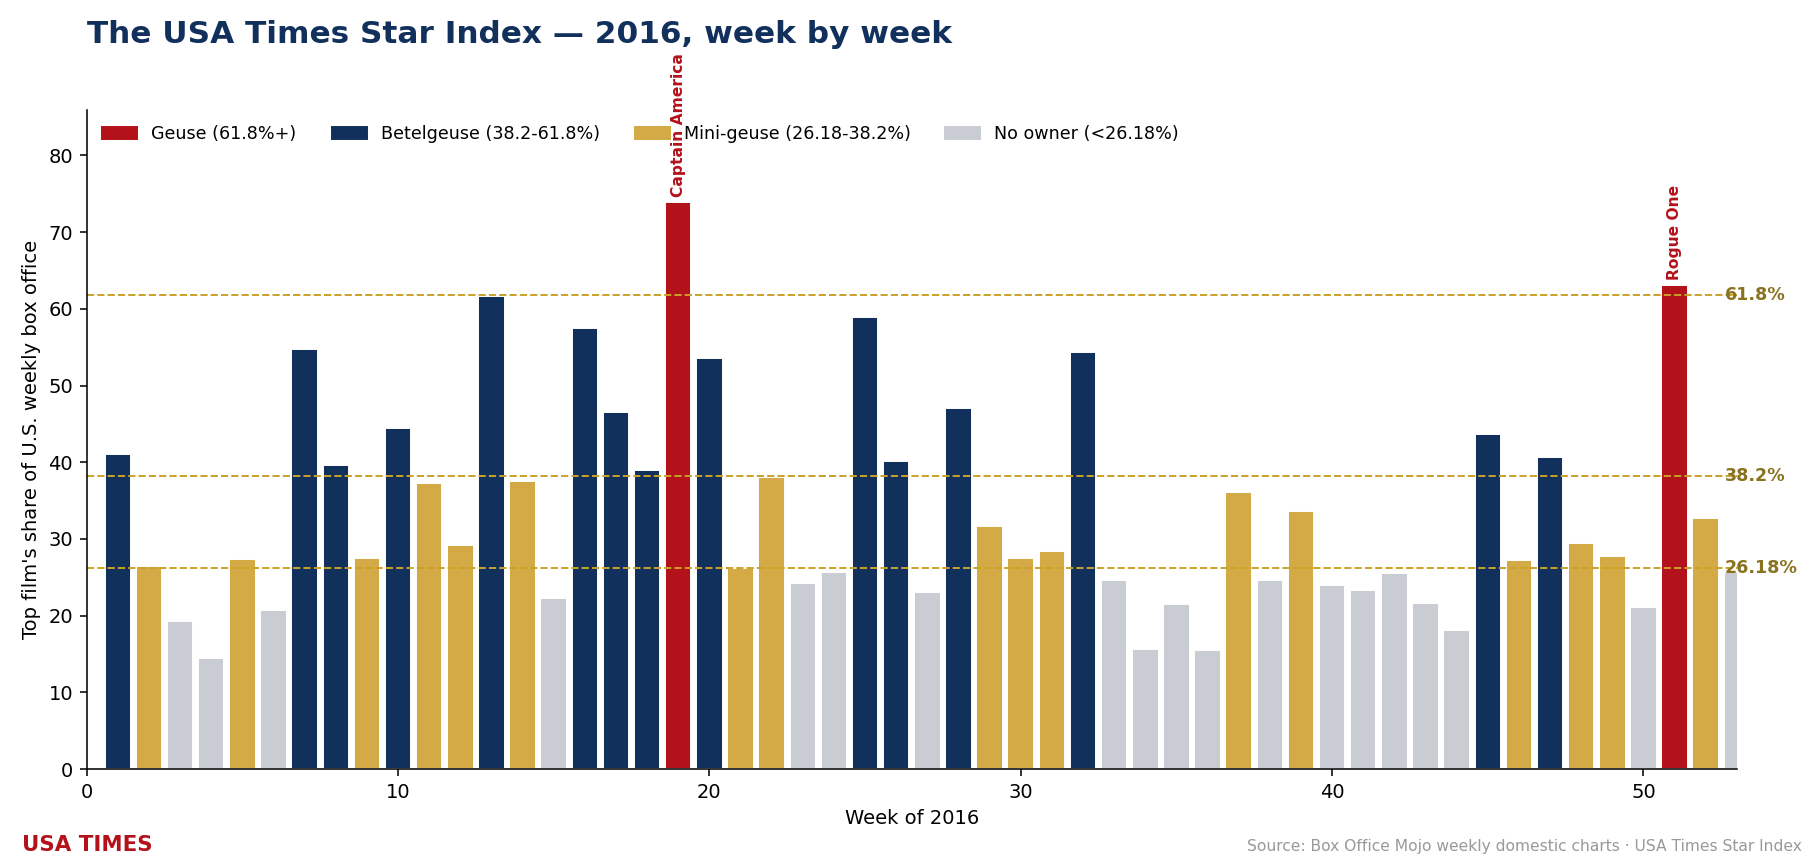
Two films cleared the 61.8% Geuse line: Captain America: Civil War (73.98%, W19) and Rogue One: A Star Wars Story (63.10%, W51). Ten more peaked in Betelgeuse territory (38.2–61.8%): Batman v Superman: Dawn of Justice (61.62%, W13), Finding Dory (58.96%, W25), The Jungle Book (57.48%, W16), Deadpool (54.70%, W7), Suicide Squad (54.31%, W32) and The Secret Life of Pets (47.11%, W28), plus four more. Ten finished as Mini-geuse-tier owners, from X-Men: Apocalypse (38.03%) down to Ghostbusters (26.26%, the year’s narrowest clearance of the 26.18% bar).
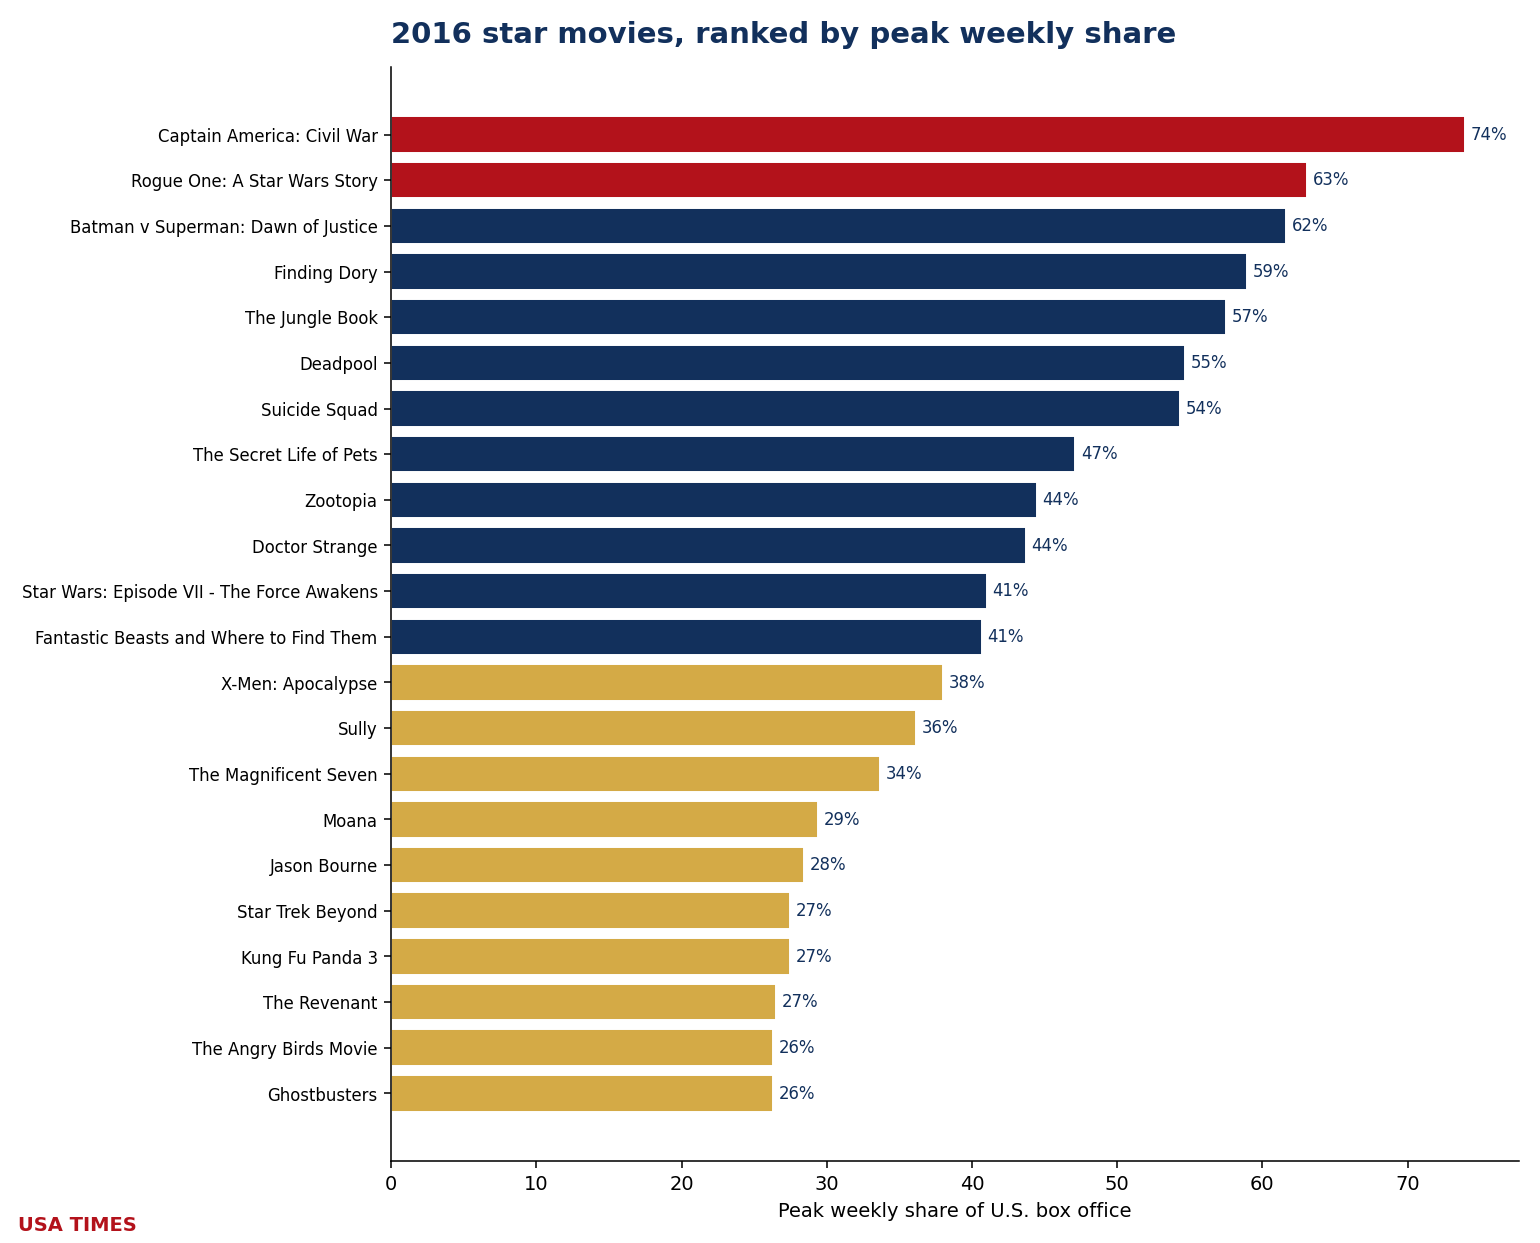
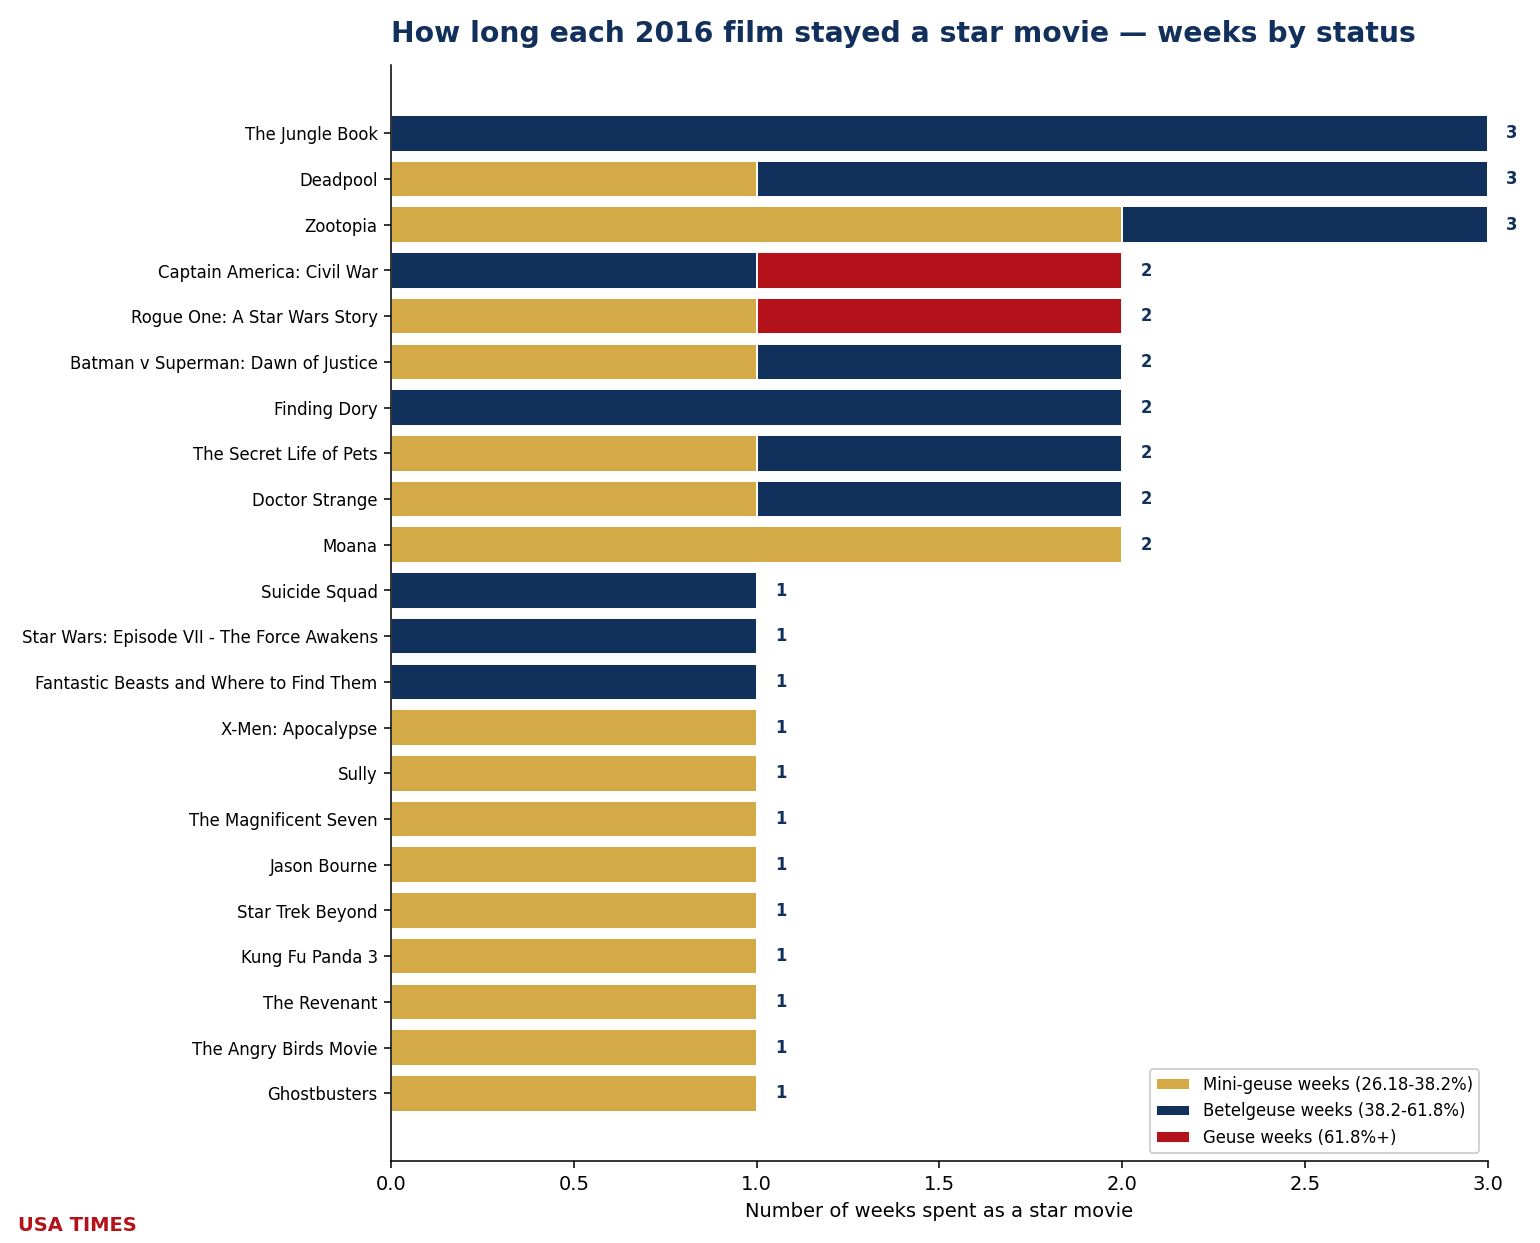
Three films tie for the longest hold at 3 weeks each: The Jungle Book, Deadpool and Zootopia. Twelve of the twenty-two owners (55%) were one-week wonders. Money: 2016 is a clean-sweep year — all 22 owners with a reported budget finished at or above 1× that budget, one of fifteen such years in the twenty. The green arrows carry an asterisk, though: Ghostbusters (1.59×), The Magnificent Seven (1.80×) and Star Trek Beyond (1.86×) sit below the informal ~2× real-world breakeven line that marketing spend imposes. Best return of the year: Deadpool at 13.50×. Concentration: the year’s owners took 30.6% of all domestic box office during the weeks they owned.
The 2016 ledger
| Film | Peak share | Tier at peak | Weeks as event | WW gross | Budget* | WW / budget |
|---|---|---|---|---|---|---|
| Captain America: Civil War | 73.98% (W19) | Geuse | 2 | $1.153B | $250.0M | ▲ 4.61× |
| Rogue One: A Star Wars Story | 63.10% (W51) | Geuse | 2 | $1.055B | $200.0M | ▲ 5.28× |
| Batman v Superman: Dawn of Justice | 61.62% (W13) | Betelgeuse | 2 | $874.4M | $250.0M | ▲ 3.50× |
| Finding Dory | 58.96% (W25) | Betelgeuse | 2 | $1.029B | $200.0M | ▲ 5.14× |
| The Jungle Book | 57.48% (W16) | Betelgeuse | 3 | $967.7M | $175.0M | ▲ 5.53× |
| Deadpool | 54.70% (W7) | Betelgeuse | 3 | $782.8M | $58.0M | ▲ 13.50× |
| Suicide Squad | 54.31% (W32) | Betelgeuse | 1 | $749.2M | $175.0M | ▲ 4.28× |
| The Secret Life of Pets | 47.11% (W28) | Betelgeuse | 2 | $875.7M | $75.0M | ▲ 11.68× |
| Zootopia | 44.46% (W10) | Betelgeuse | 3 | $1.024B | $150.0M | ▲ 6.83× |
| Doctor Strange | 43.70% (W45) | Betelgeuse | 2 | $677.8M | $165.0M | ▲ 4.11× |
| Star Wars: Episode VII – The Force Awakens | 41.02% (W1) | Betelgeuse | 1 | $2.068B | $245.0M | ▲ 8.44× |
| Fantastic Beasts and Where to Find Them | 40.66% (W47) | Betelgeuse | 1 | $816.0M | $180.0M | ▲ 4.53× |
| X-Men: Apocalypse | 38.03% (W22) | Mini-geuse | 1 | $543.9M | $178.0M | ▲ 3.06× |
| Sully | 36.11% (W37) | Mini-geuse | 1 | $240.8M | $60.0M | ▲ 4.01× |
| The Magnificent Seven | 33.66% (W39) | Mini-geuse | 1 | $162.4M | $90.0M | ▲ 1.80× |
| Moana | 29.41% (W48) | Mini-geuse | 2 | $643.3M | $150.0M | ▲ 4.29× |
| Jason Bourne | 28.42% (W31) | Mini-geuse | 1 | $415.5M | $120.0M | ▲ 3.46× |
| Star Trek Beyond | 27.47% (W30) | Mini-geuse | 1 | $343.5M | $185.0M | ▲ 1.86× |
| Kung Fu Panda 3 | 27.44% (W5) | Mini-geuse | 1 | $521.2M | $145.0M | ▲ 3.59× |
| The Revenant | 26.51% (W2) | Mini-geuse | 1 | $533.0M | $135.0M | ▲ 3.95× |
| The Angry Birds Movie | 26.26% (W21) | Mini-geuse | 1 | $352.3M | $73.0M | ▲ 4.83× |
| Ghostbusters | 26.26% (W29) | Mini-geuse | 1 | $229.1M | $144.0M | ▲ 1.59× |
*Budgets are reported estimates (Box Office Mojo, The Numbers, trade press) and should be read as such. A green ▲ marks a film that returned at least its reported budget in worldwide gross; a red ▼ marks one that did not. Industry rules of thumb put real breakeven nearer 2–2.5× budget once print and advertising are counted, so a green arrow below that range is not the same as a profit.
2017: five phenomena and the deepest bench of the old world
At $11.022 billion domestic across 52 chart weeks, 2017 produced twenty-five distinct star movies (5 Geuse · 7 Betelgeuse · 13 Mini-geuse). Thirty-two of the year’s 52 measurable weeks had an owner; twenty had none. Three weeks carried two owners at once (W13, W20, W28).
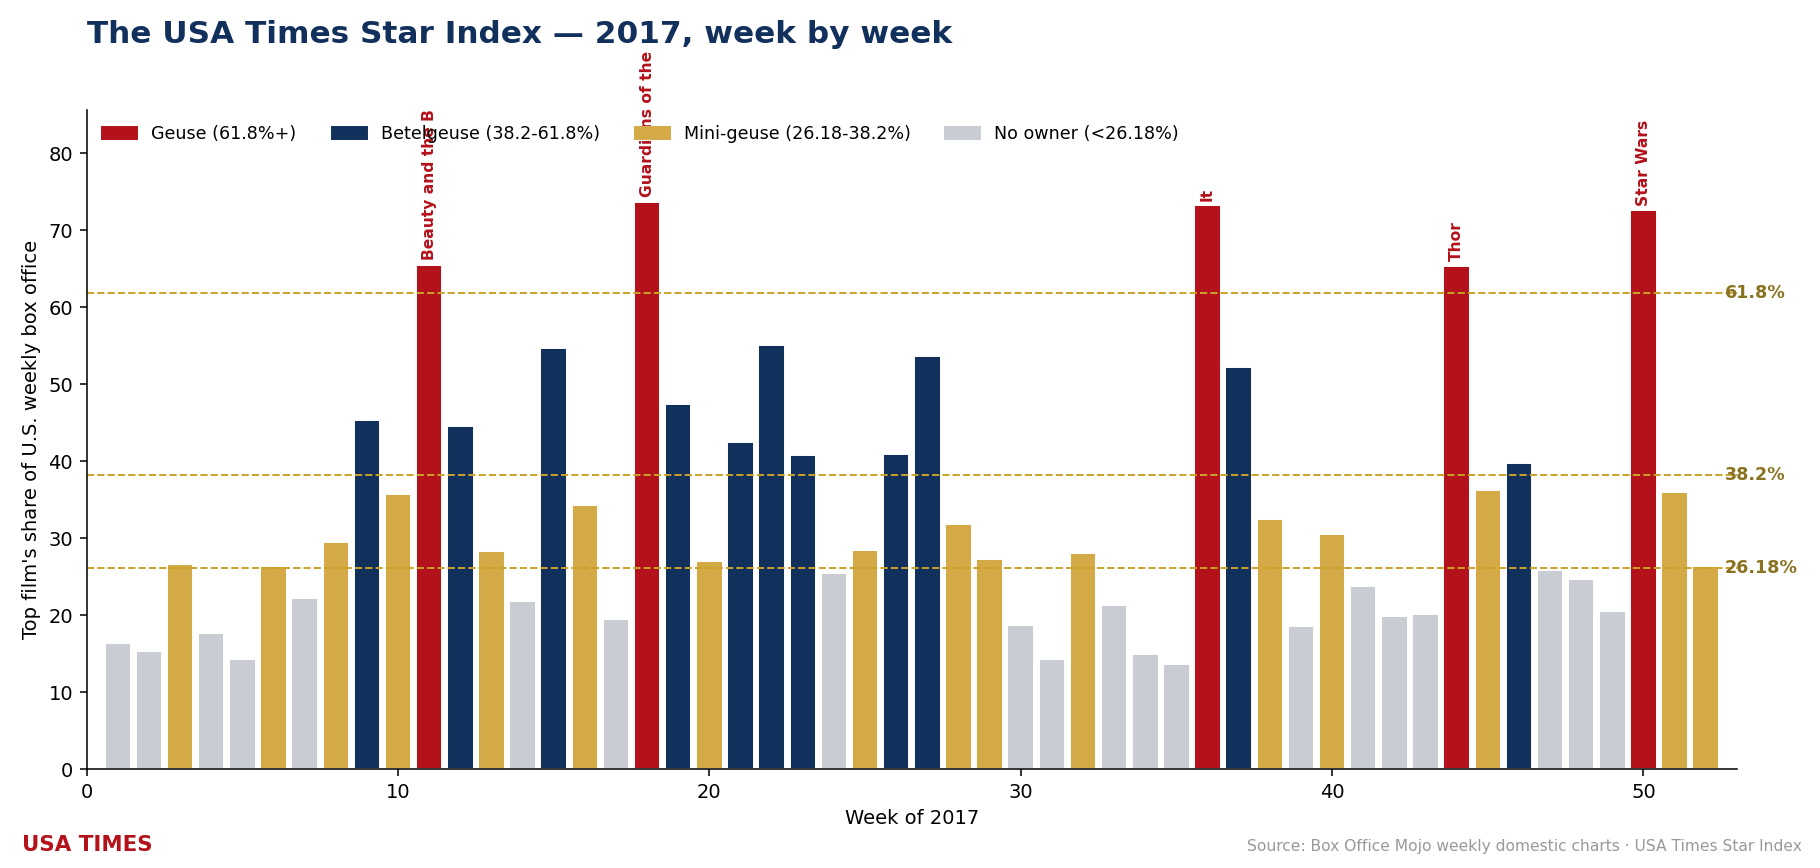
Five films cleared the 61.8% Geuse line: Guardians of the Galaxy Vol. 2 (73.71%, W18), It (73.26%, W36), Star Wars: Episode VIII – The Last Jedi (72.59%, W50), Beauty and the Beast (65.50%, W11) and Thor: Ragnarok (65.43%, W44). Seven more peaked in Betelgeuse territory (38.2–61.8%): Wonder Woman (55.08%, W22), The Fate of the Furious (54.66%, W15), Spider-Man: Homecoming (53.69%, W27), Logan (45.39%, W9), Pirates of the Caribbean: Dead Men Tell No Tales (42.56%, W21) and Despicable Me 3 (40.97%, W26), plus one more. Thirteen finished as Mini-geuse-tier owners, from Kong: Skull Island (35.71%) down to Fifty Shades Darker (26.36%, the year’s narrowest clearance of the 26.18% bar).
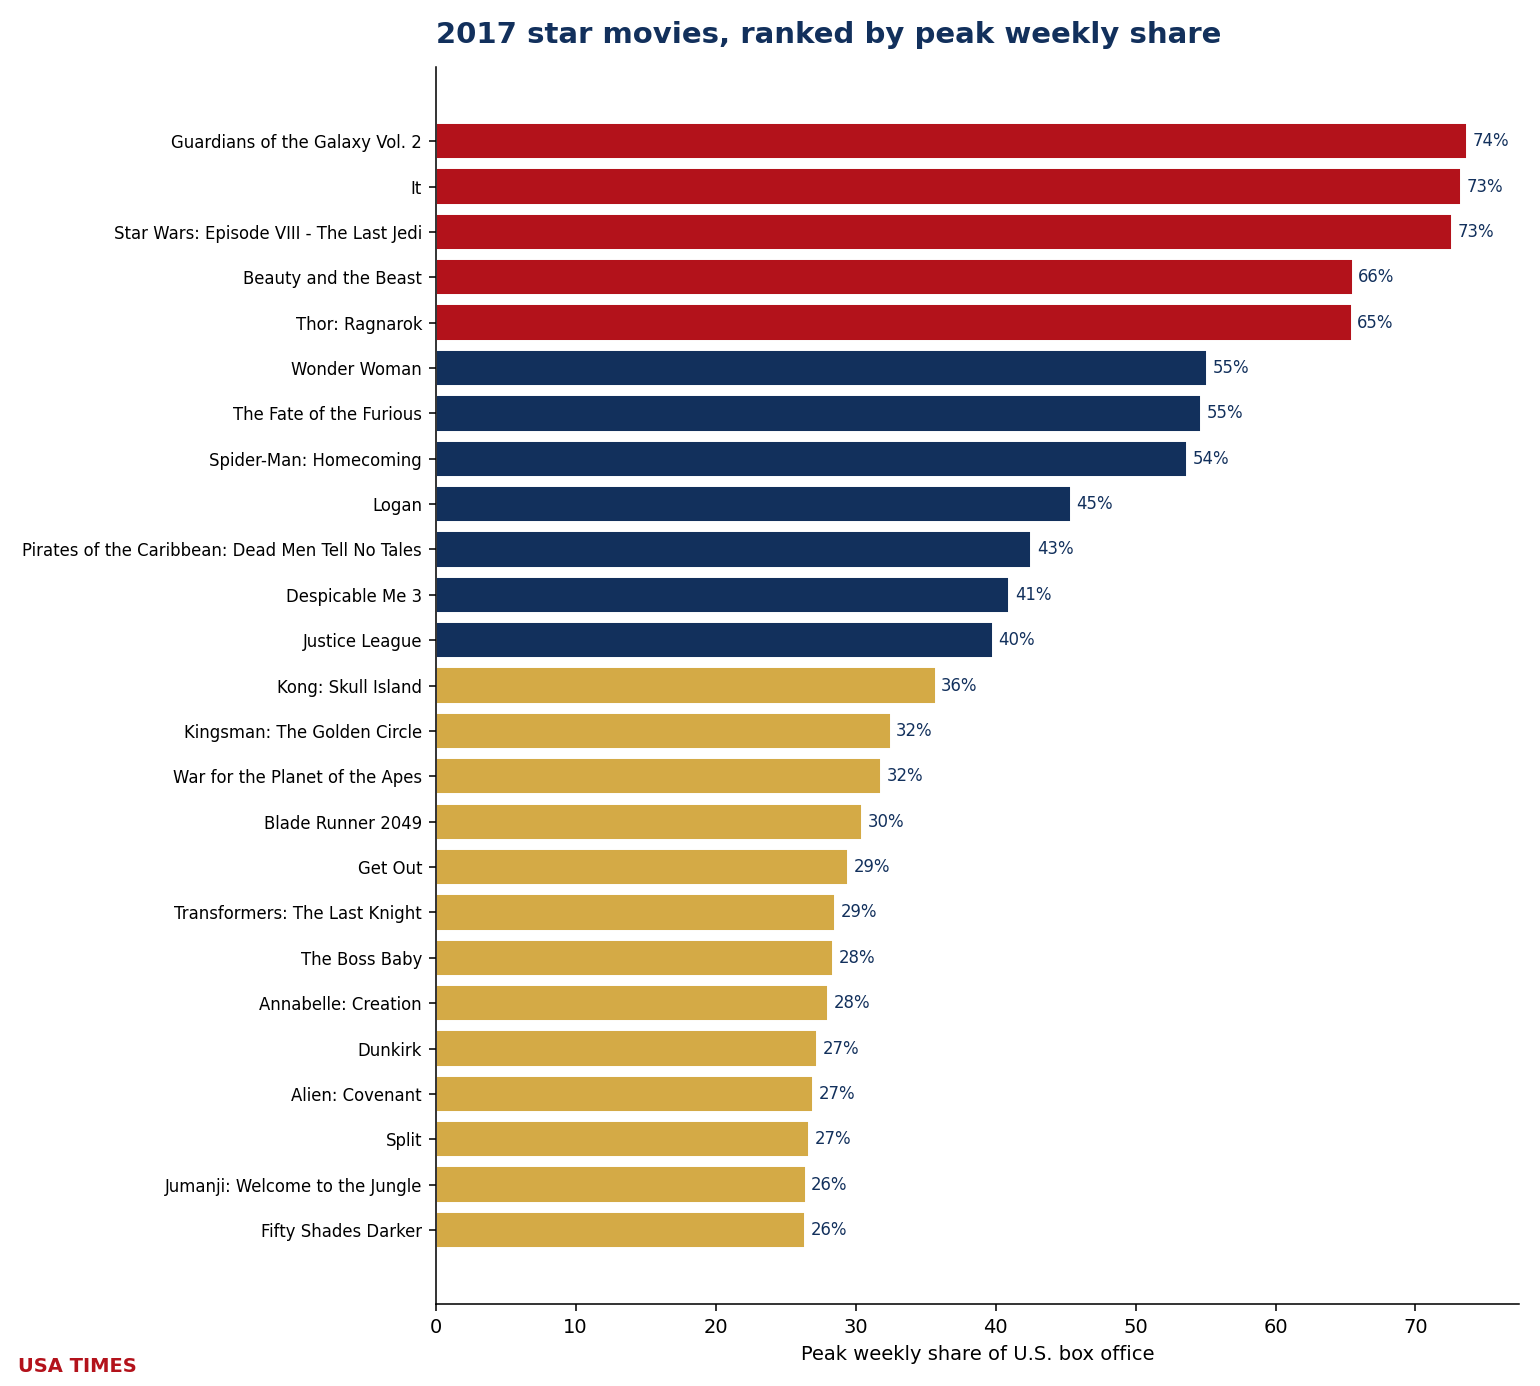
Two films tie for the longest hold at 3 weeks each: Guardians of the Galaxy Vol. 2 and Beauty and the Beast. Seventeen of the twenty-five owners (68%) were one-week wonders. Money: 2017 is a clean-sweep year — all 25 owners with a reported budget finished at or above 1× that budget, one of fifteen such years in the twenty. The green arrows carry an asterisk, though: Blade Runner 2049 (1.45×) sits below the informal ~2× real-world breakeven line that marketing spend imposes. Best return of the year: Get Out at 51.96×, the 2nd-best return anywhere in the twenty-year index. Concentration: the year’s owners took 32.2% of all domestic box office during the weeks they owned.
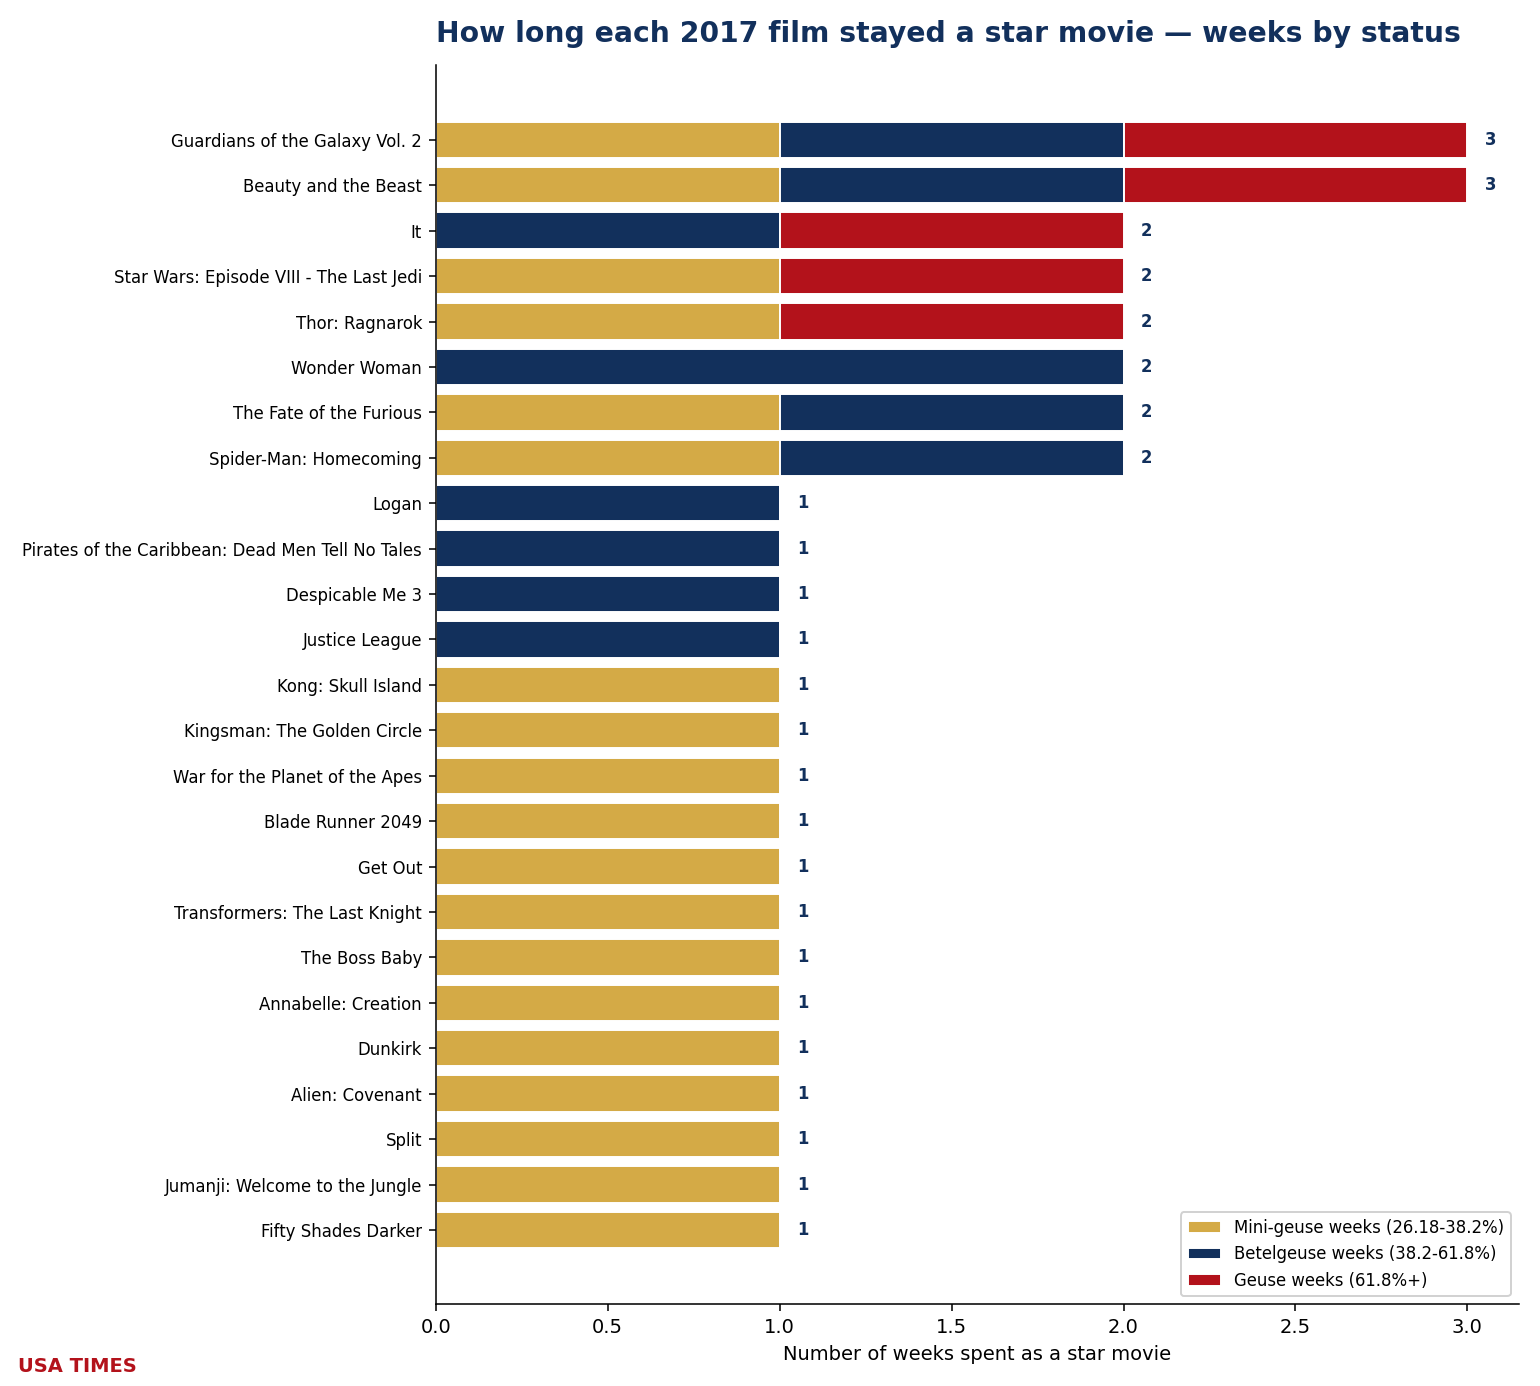
The 2017 ledger
| Film | Peak share | Tier at peak | Weeks as event | WW gross | Budget* | WW / budget |
|---|---|---|---|---|---|---|
| Guardians of the Galaxy Vol. 2 | 73.71% (W18) | Geuse | 3 | $863.8M | $200.0M | ▲ 4.32× |
| It | 73.26% (W36) | Geuse | 2 | $704.2M | $35.0M | ▲ 20.12× |
| Star Wars: Episode VIII – The Last Jedi | 72.59% (W50) | Geuse | 2 | $1.334B | $317.0M | ▲ 4.21× |
| Beauty and the Beast | 65.50% (W11) | Geuse | 3 | $1.266B | $160.0M | ▲ 7.91× |
| Thor: Ragnarok | 65.43% (W44) | Geuse | 2 | $855.3M | $180.0M | ▲ 4.75× |
| Wonder Woman | 55.08% (W22) | Betelgeuse | 2 | $824.0M | $149.0M | ▲ 5.53× |
| The Fate of the Furious | 54.66% (W15) | Betelgeuse | 2 | $1.236B | $250.0M | ▲ 4.94× |
| Spider-Man: Homecoming | 53.69% (W27) | Betelgeuse | 2 | $880.2M | $175.0M | ▲ 5.03× |
| Logan | 45.39% (W9) | Betelgeuse | 1 | $619.2M | $97.0M | ▲ 6.38× |
| Pirates of the Caribbean: Dead Men Tell No Tales | 42.56% (W21) | Betelgeuse | 1 | $795.9M | $230.0M | ▲ 3.46× |
| Despicable Me 3 | 40.97% (W26) | Betelgeuse | 1 | $1.035B | $80.0M | ▲ 12.94× |
| Justice League | 39.79% (W46) | Betelgeuse | 1 | $661.3M | $300.0M | ▲ 2.20× |
| Kong: Skull Island | 35.71% (W10) | Mini-geuse | 1 | $568.7M | $185.0M | ▲ 3.07× |
| Kingsman: The Golden Circle | 32.50% (W38) | Mini-geuse | 1 | $410.9M | $104.0M | ▲ 3.95× |
| War for the Planet of the Apes | 31.82% (W28) | Mini-geuse | 1 | $490.7M | $152.0M | ▲ 3.23× |
| Blade Runner 2049 | 30.49% (W40) | Mini-geuse | 1 | $267.5M | $185.0M | ▲ 1.45× |
| Get Out | 29.47% (W8) | Mini-geuse | 1 | $259.8M | $5.0M | ▲ 51.96× |
| Transformers: The Last Knight | 28.53% (W25) | Mini-geuse | 1 | $605.4M | $217.0M | ▲ 2.79× |
| The Boss Baby | 28.37% (W13) | Mini-geuse | 1 | $528.0M | $125.0M | ▲ 4.22× |
| Annabelle: Creation | 28.04% (W32) | Mini-geuse | 1 | $307.0M | $15.0M | ▲ 20.47× |
| Dunkirk | 27.27% (W29) | Mini-geuse | 1 | $549.1M | $100.0M | ▲ 5.49× |
| Alien: Covenant | 26.98% (W20) | Mini-geuse | 1 | $240.9M | $97.0M | ▲ 2.48× |
| Split | 26.67% (W3) | Mini-geuse | 1 | $278.5M | $9.0M | ▲ 30.94× |
| Jumanji: Welcome to the Jungle | 26.42% (W52) | Mini-geuse | 1 | $962.5M | $90.0M | ▲ 10.69× |
| Fifty Shades Darker | 26.36% (W6) | Mini-geuse | 1 | $381.1M | $55.0M | ▲ 6.93× |
*Budgets are reported estimates (Box Office Mojo, The Numbers, trade press) and should be read as such. A green ▲ marks a film that returned at least its reported budget in worldwide gross; a red ▼ marks one that did not. Industry rules of thumb put real breakeven nearer 2–2.5× budget once print and advertising are counted, so a green arrow below that range is not the same as a profit.
2018: the record year that three phenomena built
At $11.844 billion domestic across 52 chart weeks, 2018 produced twenty-one distinct star movies (3 Geuse · 7 Betelgeuse · 11 Mini-geuse). Twenty-nine of the year’s 52 measurable weeks had an owner; twenty-three had none. One week carried two owners at once (W25).
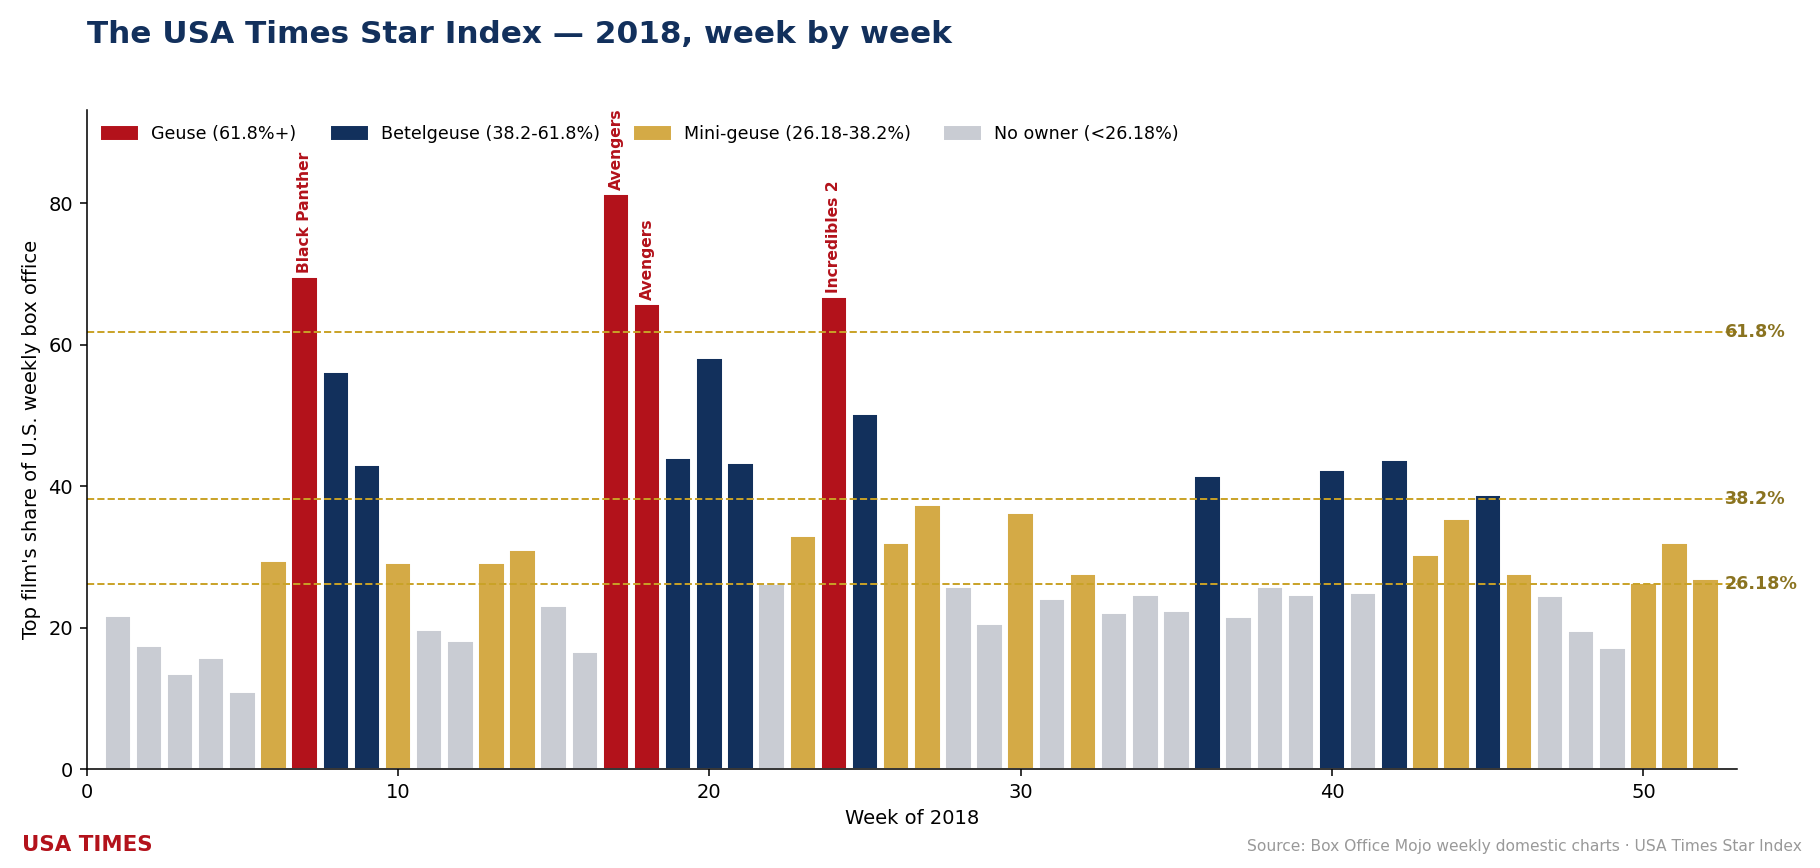
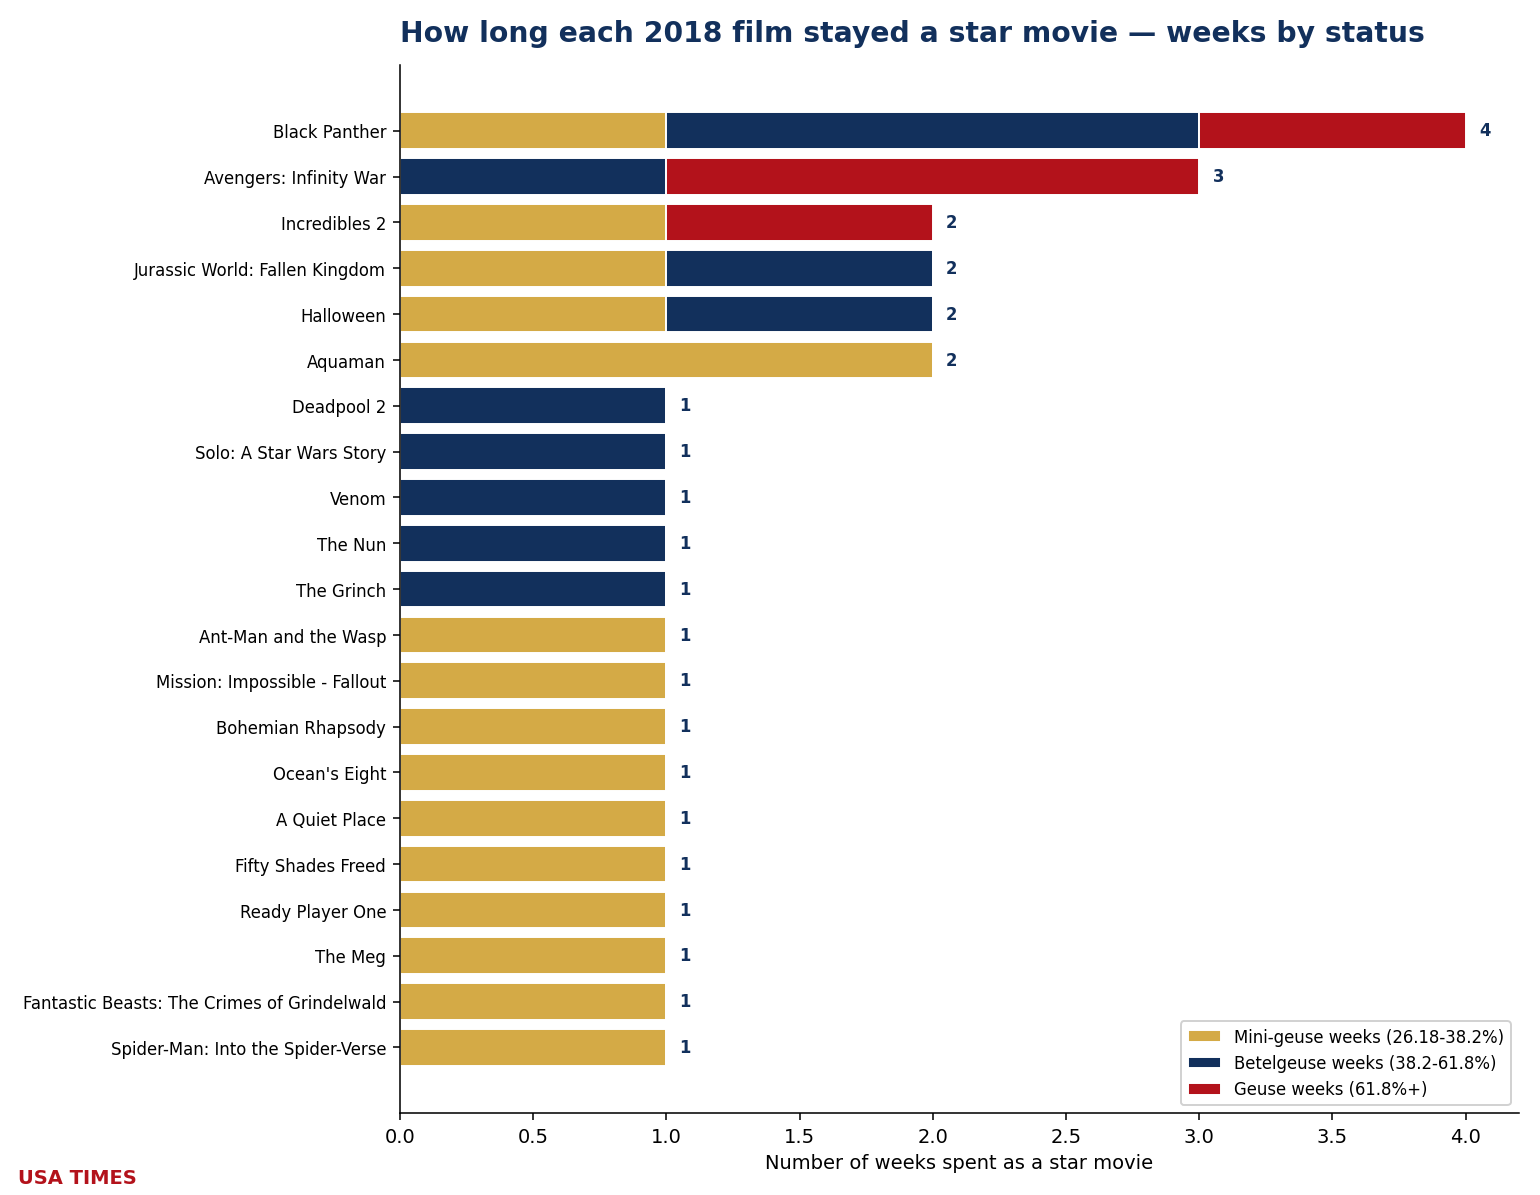
Three films cleared the 61.8% Geuse line: Avengers: Infinity War (81.27%, W17), Black Panther (69.56%, W7) and Incredibles 2 (66.76%, W24). Seven more peaked in Betelgeuse territory (38.2–61.8%): Deadpool 2 (58.10%, W20), Jurassic World: Fallen Kingdom (50.19%, W25), Halloween (43.65%, W42), Solo: A Star Wars Story (43.27%, W21), Venom (42.23%, W40) and The Nun (41.47%, W36), plus one more. Eleven finished as Mini-geuse-tier owners, from Ant-Man and the Wasp (37.28%) down to Spider-Man: Into the Spider-Verse (26.30%, the year’s narrowest clearance of the 26.18% bar).
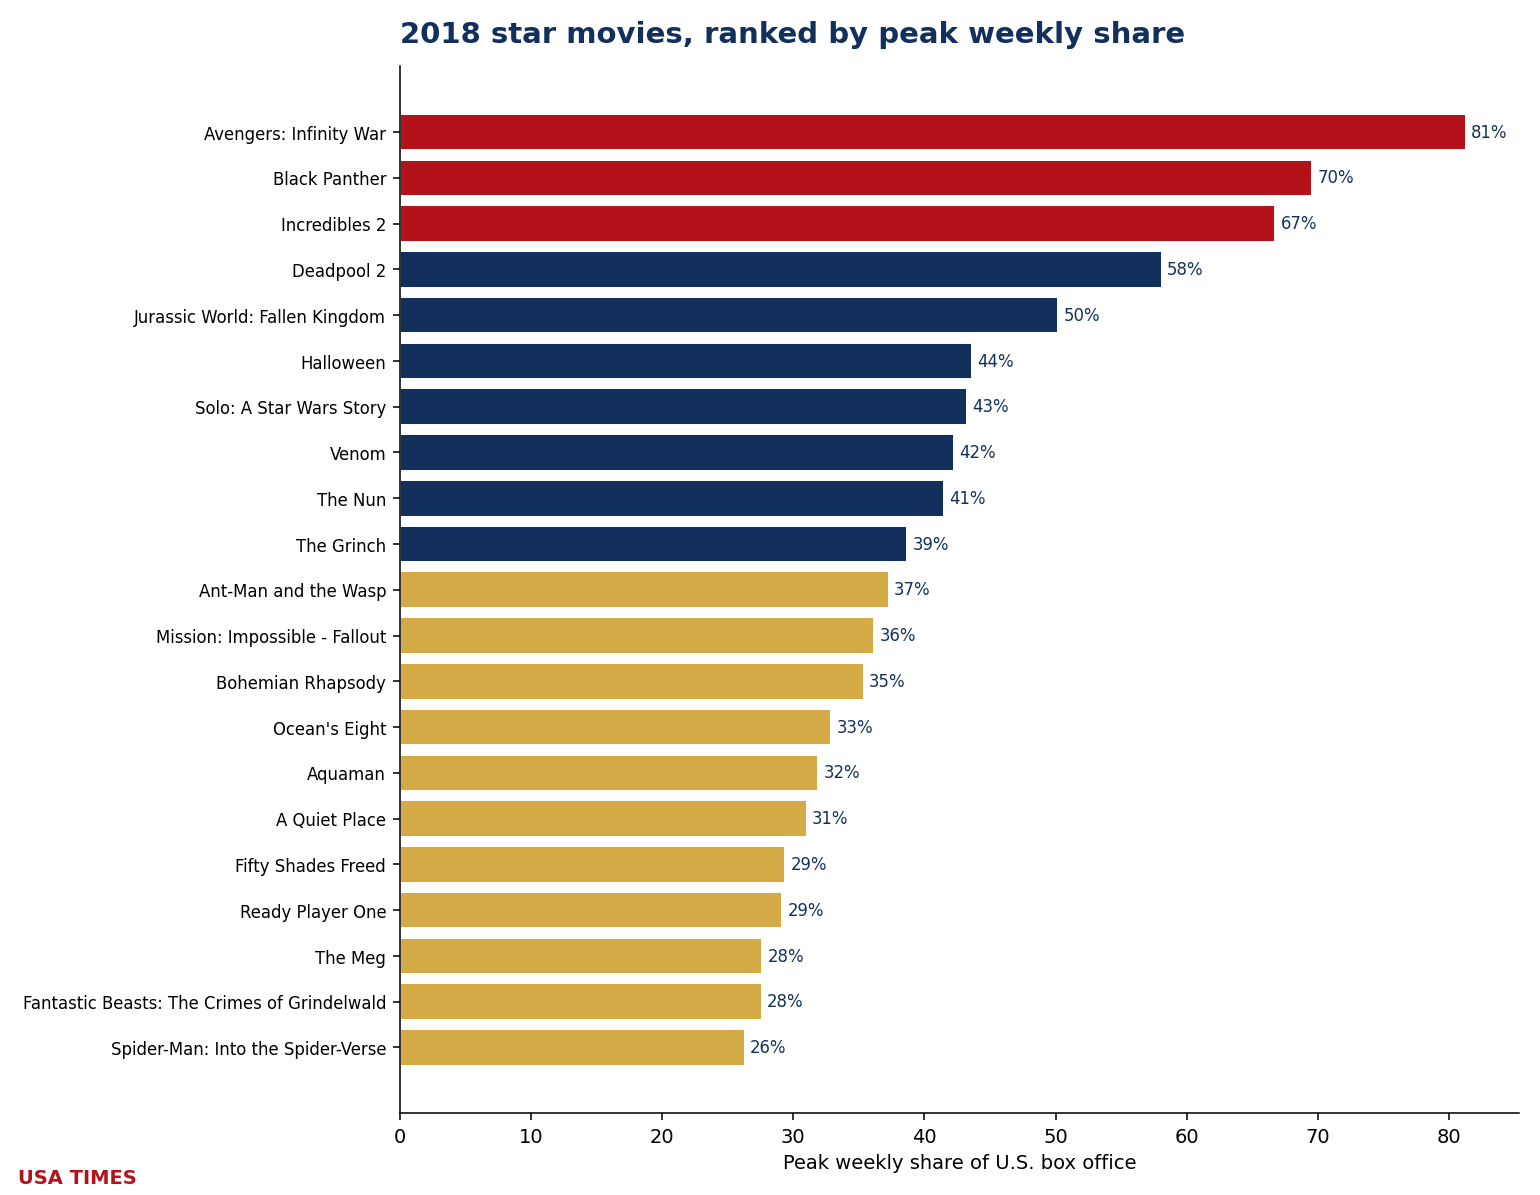
Longest hold: Black Panther at 4 weeks as a star movie. Fifteen of the twenty-one owners (71%) were one-week wonders. Money: 2018 is a clean-sweep year — all 21 owners with a reported budget finished at or above 1× that budget, one of fifteen such years in the twenty. The green arrows carry an asterisk, though: Solo: A Star Wars Story (1.43×) sits below the informal ~2× real-world breakeven line that marketing spend imposes. Best return of the year: Halloween at 25.55×, the 9th-best return anywhere in the twenty-year index. Concentration: the year’s owners took 29.2% of all domestic box office during the weeks they owned.
The 2018 ledger
| Film | Peak share | Tier at peak | Weeks as event | WW gross | Budget* | WW / budget |
|---|---|---|---|---|---|---|
| Avengers: Infinity War | 81.27% (W17) | Geuse | 3 | $2.048B | $321.0M | ▲ 6.38× |
| Black Panther | 69.56% (W7) | Geuse | 4 | $1.347B | $200.0M | ▲ 6.73× |
| Incredibles 2 | 66.76% (W24) | Geuse | 2 | $1.243B | $200.0M | ▲ 6.21× |
| Deadpool 2 | 58.10% (W20) | Betelgeuse | 1 | $734.5M | $110.0M | ▲ 6.68× |
| Jurassic World: Fallen Kingdom | 50.19% (W25) | Betelgeuse | 2 | $1.308B | $170.0M | ▲ 7.70× |
| Halloween | 43.65% (W42) | Betelgeuse | 2 | $255.5M | $10.0M | ▲ 25.55× |
| Solo: A Star Wars Story | 43.27% (W21) | Betelgeuse | 1 | $392.9M | $275.0M | ▲ 1.43× |
| Venom | 42.23% (W40) | Betelgeuse | 1 | $856.1M | $100.0M | ▲ 8.56× |
| The Nun | 41.47% (W36) | Betelgeuse | 1 | $366.1M | $22.0M | ▲ 16.64× |
| The Grinch | 38.69% (W45) | Betelgeuse | 1 | $512.7M | $75.0M | ▲ 6.84× |
| Ant-Man and the Wasp | 37.28% (W27) | Mini-geuse | 1 | $622.7M | $162.0M | ▲ 3.84× |
| Mission: Impossible – Fallout | 36.17% (W30) | Mini-geuse | 1 | $791.1M | $178.0M | ▲ 4.44× |
| Bohemian Rhapsody | 35.36% (W44) | Mini-geuse | 1 | $903.7M | $52.0M | ▲ 17.38× |
| Ocean’s Eight | 32.91% (W23) | Mini-geuse | 1 | $297.7M | $70.0M | ▲ 4.25× |
| Aquaman | 31.90% (W51) | Mini-geuse | 2 | $1.152B | $160.0M | ▲ 7.20× |
| A Quiet Place | 31.04% (W14) | Mini-geuse | 1 | $340.9M | $17.0M | ▲ 20.06× |
| Fifty Shades Freed | 29.39% (W6) | Mini-geuse | 1 | $372.0M | $55.0M | ▲ 6.76× |
| Ready Player One | 29.16% (W13) | Mini-geuse | 1 | $583.5M | $175.0M | ▲ 3.33× |
| The Meg | 27.65% (W32) | Mini-geuse | 1 | $529.2M | $130.0M | ▲ 4.07× |
| Fantastic Beasts: The Crimes of Grindelwald | 27.59% (W46) | Mini-geuse | 1 | $655.8M | $200.0M | ▲ 3.28× |
| Spider-Man: Into the Spider-Verse | 26.30% (W50) | Mini-geuse | 1 | $375.6M | $90.0M | ▲ 4.17× |
*Budgets are reported estimates (Box Office Mojo, The Numbers, trade press) and should be read as such. A green ▲ marks a film that returned at least its reported budget in worldwide gross; a red ▼ marks one that did not. Industry rules of thumb put real breakeven nearer 2–2.5× budget once print and advertising are counted, so a green arrow below that range is not the same as a profit.
2019: the last normal year — and the biggest single week the index has ever seen
At $11.291 billion domestic across 52 chart weeks, 2019 produced twenty-two distinct star movies (5 Geuse · 8 Betelgeuse · 9 Mini-geuse). Thirty-one of the year’s 52 measurable weeks had an owner; twenty-one had none. Four weeks carried two owners at once (W19, W26, W31, W37).
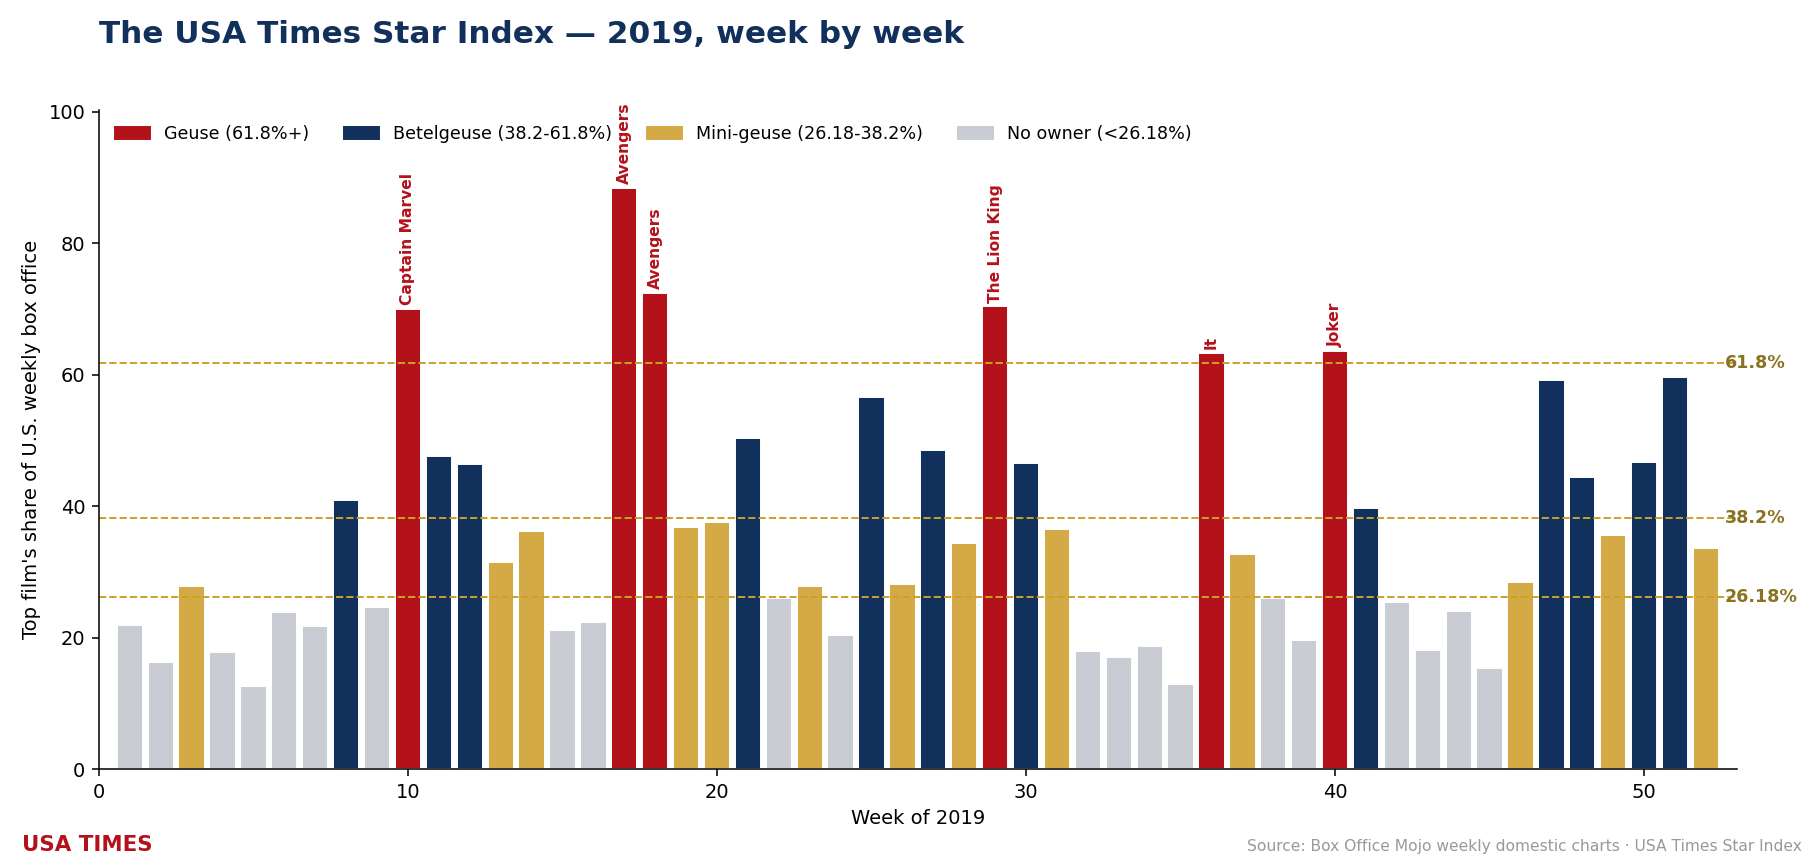
Five films cleared the 61.8% Geuse line: Avengers: Endgame (88.35%, W17), The Lion King (70.38%, W29), Captain Marvel (70.04%, W10), Joker (63.57%, W40) and It: Chapter Two (63.37%, W36). Eight more peaked in Betelgeuse territory (38.2–61.8%): Star Wars: Episode IX – The Rise of Skywalker (59.68%, W51), Frozen II (59.26%, W47), Toy Story 4 (56.55%, W25), Aladdin (50.31%, W21), Spider-Man: Far from Home (48.56%, W27) and Jumanji: The Next Level (46.73%, W50), plus two more. Nine finished as Mini-geuse-tier owners, from John Wick: Chapter 3 – Parabellum (37.66%) down to Glass (27.80%, the year’s narrowest clearance of the 26.18% bar).
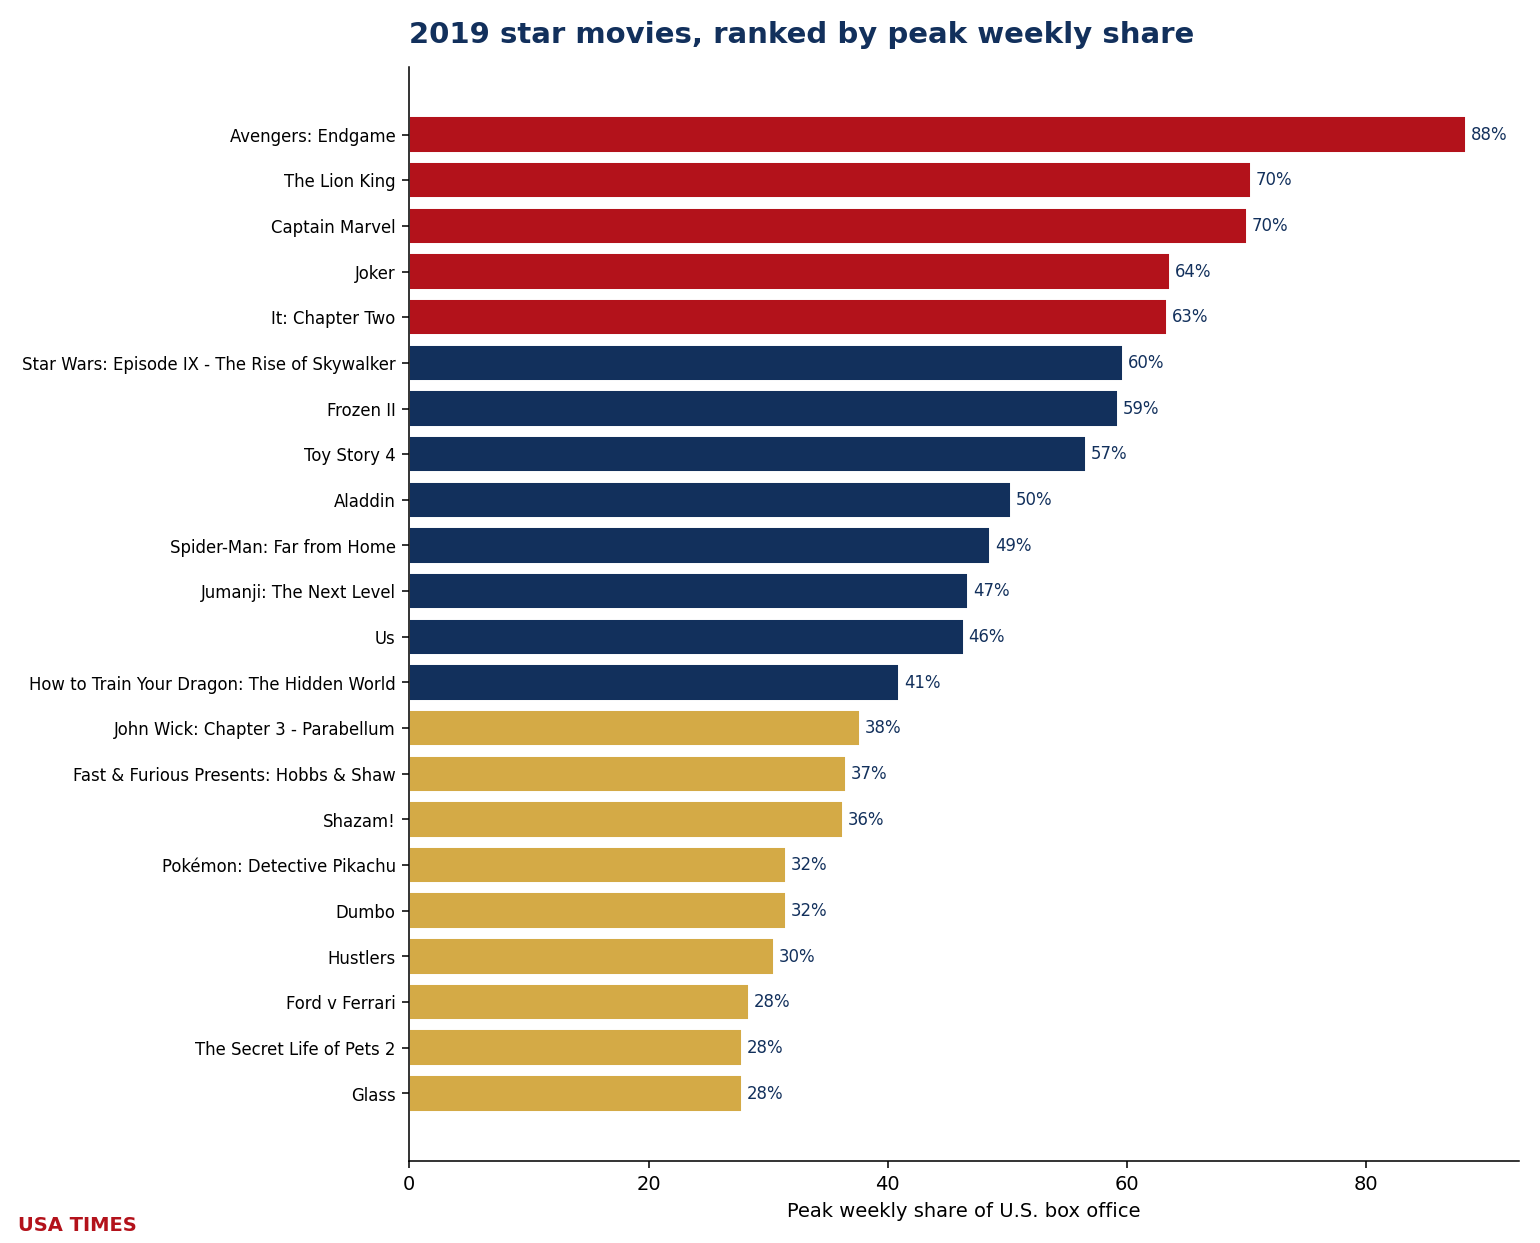
Four films tie for the longest hold at 3 weeks each: Avengers: Endgame, The Lion King, Frozen II and Spider-Man: Far from Home. Thirteen of the twenty-two owners (59%) were one-week wonders. Money: 2019 is a clean-sweep year — all 22 owners with a reported budget finished at or above 1× that budget, one of fifteen such years in the twenty. Every owner cleared even the ~2× real-world breakeven line (floor: Dumbo, 2.08×). Best return of the year: Joker at 19.62×. Concentration: the year’s owners took 36.7% of all domestic box office during the weeks they owned.
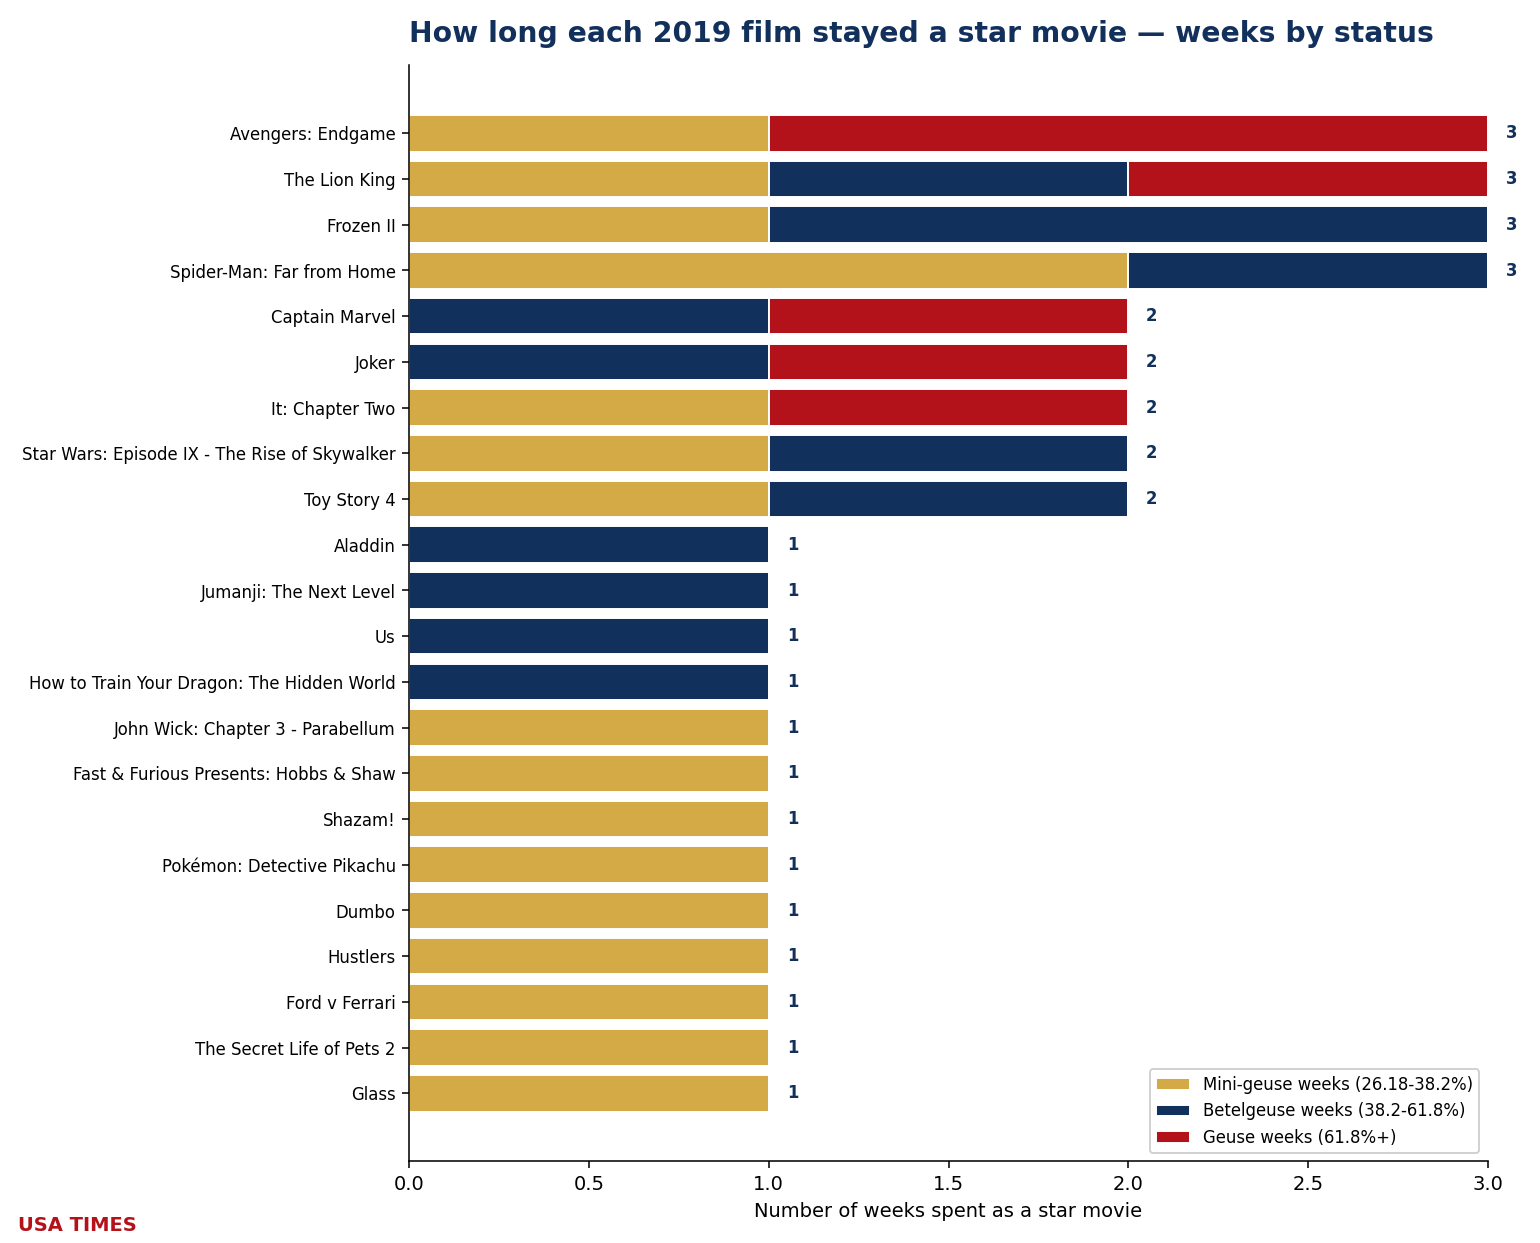
The 2019 ledger
| Film | Peak share | Tier at peak | Weeks as event | WW gross | Budget* | WW / budget |
|---|---|---|---|---|---|---|
| Avengers: Endgame | 88.35% (W17) | Geuse | 3 | $2.799B | $356.0M | ▲ 7.86× |
| The Lion King | 70.38% (W29) | Geuse | 3 | $1.662B | $260.0M | ▲ 6.39× |
| Captain Marvel | 70.04% (W10) | Geuse | 2 | $1.131B | $160.0M | ▲ 7.07× |
| Joker | 63.57% (W40) | Geuse | 2 | $1.079B | $55.0M | ▲ 19.62× |
| It: Chapter Two | 63.37% (W36) | Geuse | 2 | $473.1M | $79.0M | ▲ 5.99× |
| Star Wars: Episode IX – The Rise of Skywalker | 59.68% (W51) | Betelgeuse | 2 | $1.077B | $275.0M | ▲ 3.92× |
| Frozen II | 59.26% (W47) | Betelgeuse | 3 | $1.450B | $150.0M | ▲ 9.67× |
| Toy Story 4 | 56.55% (W25) | Betelgeuse | 2 | $1.073B | $200.0M | ▲ 5.37× |
| Aladdin | 50.31% (W21) | Betelgeuse | 1 | $1.051B | $183.0M | ▲ 5.74× |
| Spider-Man: Far from Home | 48.56% (W27) | Betelgeuse | 3 | $1.132B | $160.0M | ▲ 7.07× |
| Jumanji: The Next Level | 46.73% (W50) | Betelgeuse | 1 | $800.1M | $125.0M | ▲ 6.40× |
| Us | 46.35% (W12) | Betelgeuse | 1 | $256.1M | $20.0M | ▲ 12.81× |
| How to Train Your Dragon: The Hidden World | 40.96% (W8) | Betelgeuse | 1 | $521.8M | $129.0M | ▲ 4.04× |
| John Wick: Chapter 3 – Parabellum | 37.66% (W20) | Mini-geuse | 1 | $327.8M | $75.0M | ▲ 4.37× |
| Fast & Furious Presents: Hobbs & Shaw | 36.53% (W31) | Mini-geuse | 1 | $760.7M | $200.0M | ▲ 3.80× |
| Shazam! | 36.24% (W14) | Mini-geuse | 1 | $367.8M | $100.0M | ▲ 3.68× |
| Pokémon: Detective Pikachu | 31.52% (W19) | Mini-geuse | 1 | $433.3M | $150.0M | ▲ 2.89× |
| Dumbo | 31.51% (W13) | Mini-geuse | 1 | $353.3M | $170.0M | ▲ 2.08× |
| Hustlers | 30.46% (W37) | Mini-geuse | 1 | $157.6M | $20.0M | ▲ 7.88× |
| Ford v Ferrari | 28.41% (W46) | Mini-geuse | 1 | $226.3M | $97.6M | ▲ 2.32× |
| The Secret Life of Pets 2 | 27.84% (W23) | Mini-geuse | 1 | $431.2M | $80.0M | ▲ 5.39× |
| Glass | 27.80% (W3) | Mini-geuse | 1 | $247.0M | $20.0M | ▲ 12.35× |
*Budgets are reported estimates (Box Office Mojo, The Numbers, trade press) and should be read as such. A green ▲ marks a film that returned at least its reported budget in worldwide gross; a red ▼ marks one that did not. Industry rules of thumb put real breakeven nearer 2–2.5× budget once print and advertising are counted, so a green arrow below that range is not the same as a profit.
2020: the asterisk year — owners in an emptying room
At $2.002 billion domestic across 52 chart weeks, of which 22 fell below the $5 million dark-market line and are excluded from star-movie status, 2020 produced seventeen distinct star movies (3 Geuse · 1 Betelgeuse · 13 Mini-geuse). That is the 2nd-smallest crop in the twenty-year index. Twenty-five of the year’s 30 measurable weeks had an owner; five had none. Two weeks carried two owners at once (W35, W51).
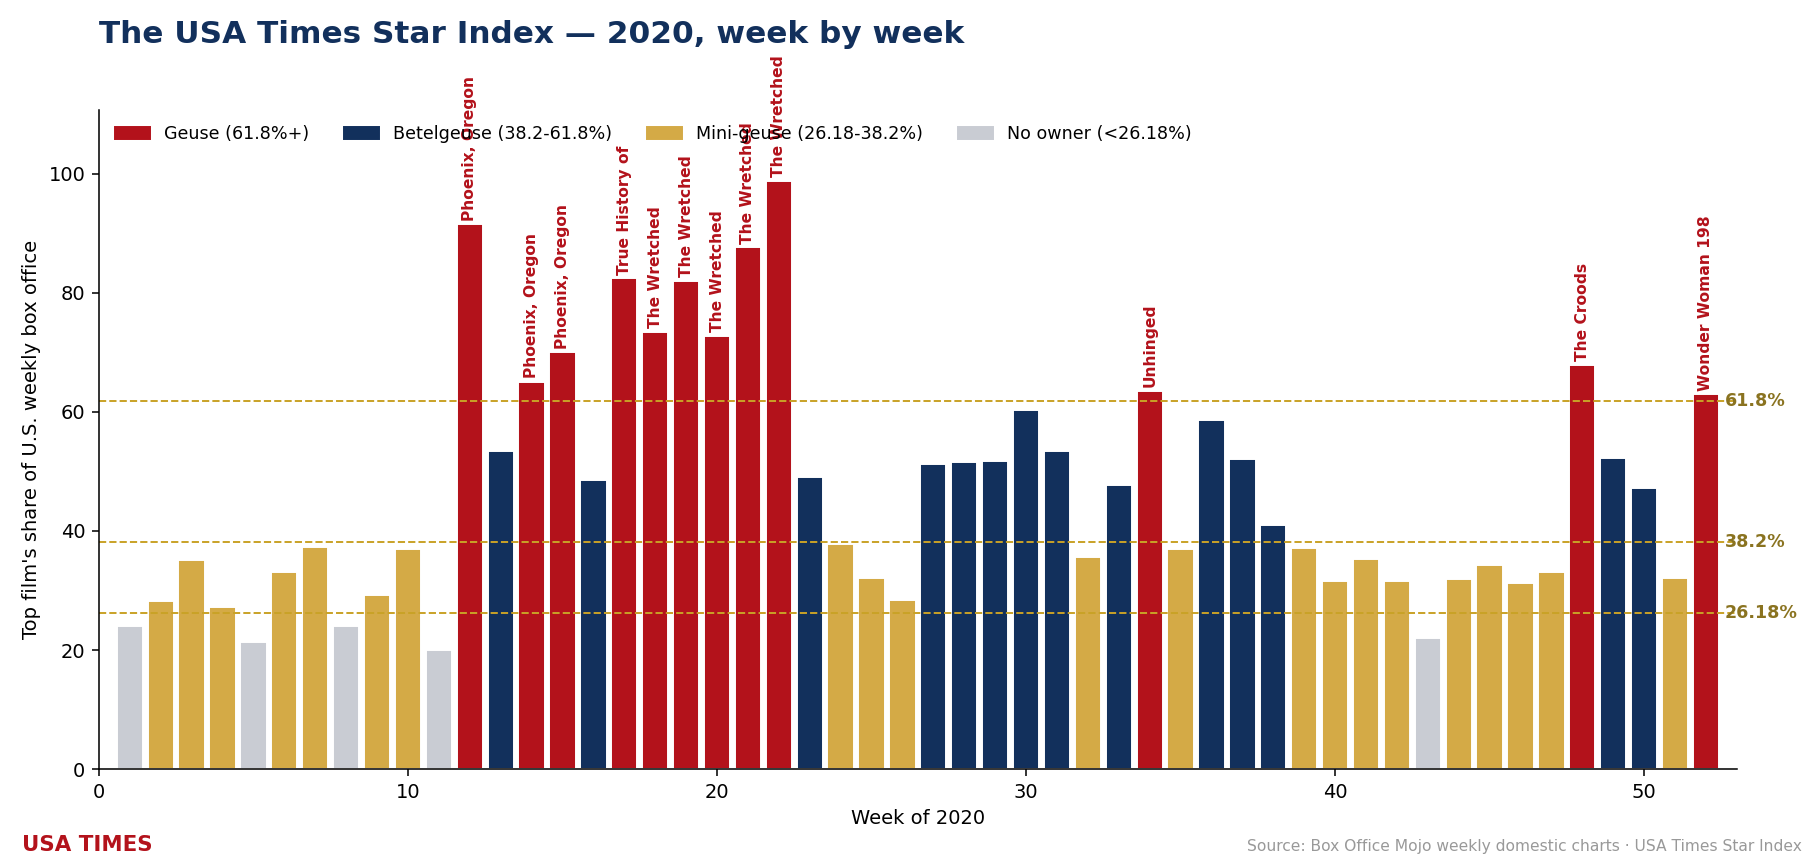
Three films cleared the 61.8% Geuse line: The Croods: A New Age (67.93%, W48), Unhinged (63.59%, W34) and Wonder Woman 1984 (63.00%, W52). One more peaked in Betelgeuse territory (38.2–61.8%): Tenet (58.57%, W36). Thirteen finished as Mini-geuse-tier owners, from Sonic the Hedgehog (37.33%) down to Monster Hunter (27.71%, the year’s narrowest clearance of the 26.18% bar).
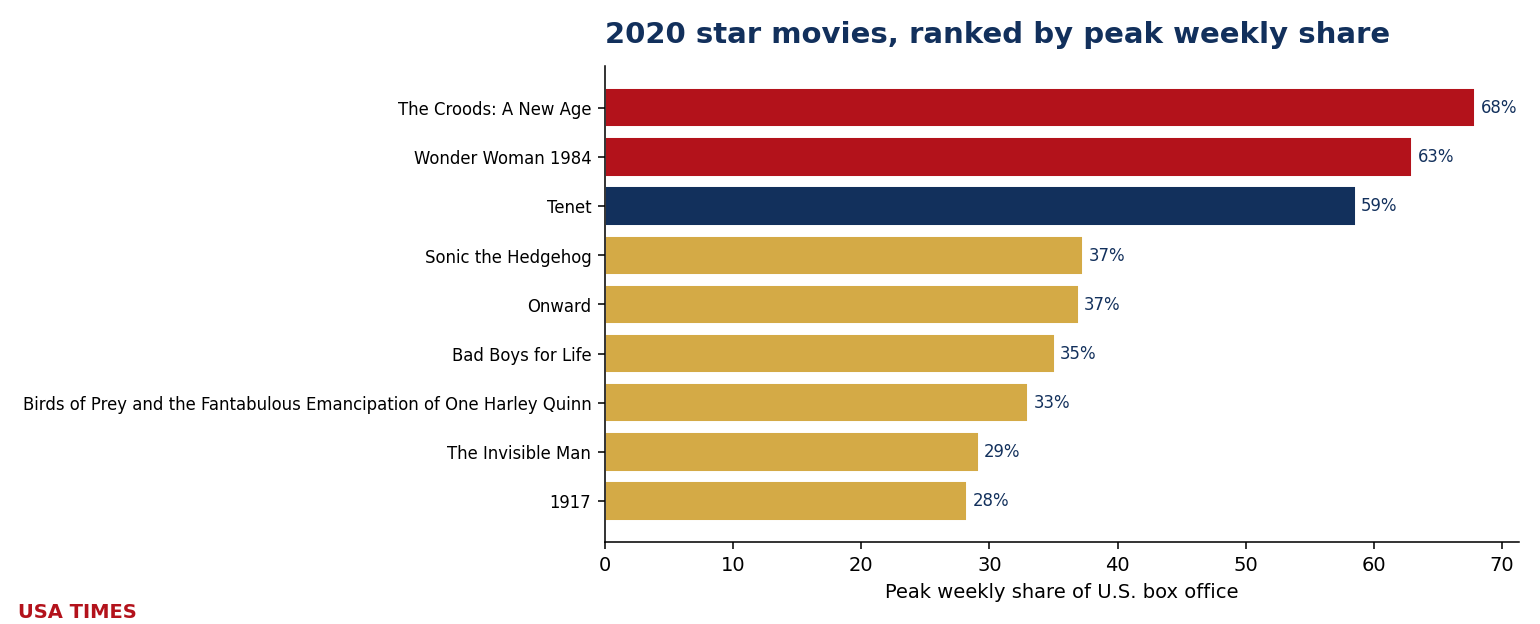
Longest hold: Tenet at 6 weeks as a star movie. Fourteen of the seventeen owners (82%) were one-week wonders. Money: 2020 is not a clean sweep — five owners finished below 1× budget: Let Him Go (0.55×), The New Mutants (0.73×), Monster Hunter (0.80×), Onward (0.81×) and Wonder Woman 1984 (0.85×). Best return of the year: The Invisible Man at 20.64×, the 11th-best return anywhere in the twenty-year index. Concentration: the year’s owners took 26.4% of all domestic box office during the weeks they owned.
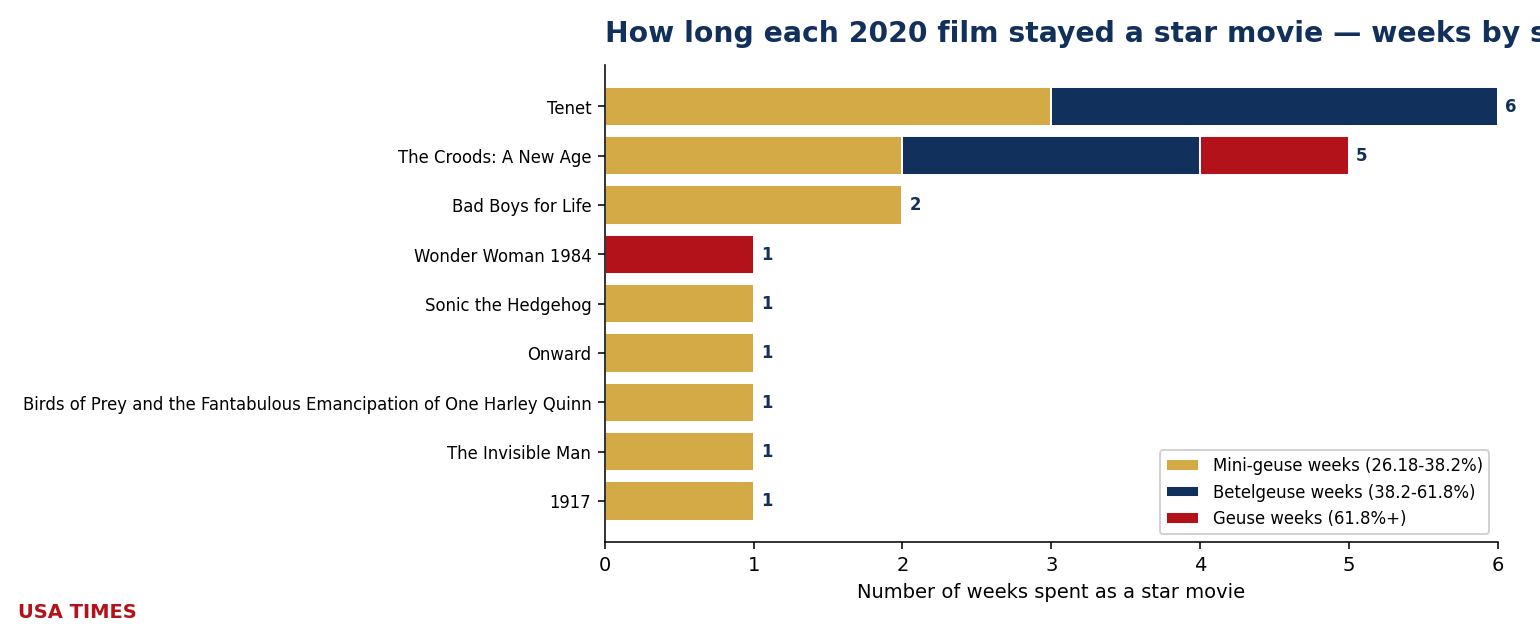
The 2020 ledger
| Film | Peak share | Tier at peak | Weeks as event | WW gross | Budget* | WW / budget |
|---|---|---|---|---|---|---|
| The Croods: A New Age | 67.93%† (W48) | Geuse | 5 | $215.9M | $65.0M | ▲ 3.32× |
| Unhinged | 63.59%† (W34) | Geuse | 1 | $44.3M | $33.0M | ▲ 1.34× |
| Wonder Woman 1984 | 63.00%† (W52) | Geuse | 1 | $169.6M | $200.0M | ▼ 0.85× |
| Tenet | 58.57%† (W36) | Betelgeuse | 6 | $365.9M | $200.0M | ▲ 1.83× |
| Sonic the Hedgehog | 37.33%† (W7) | Mini-geuse | 1 | $319.7M | $85.0M | ▲ 3.76× |
| Onward | 36.98%† (W10) | Mini-geuse | 1 | $141.9M | $175.0M | ▼ 0.81× |
| The New Mutants | 36.92%† (W35) | Mini-geuse | 1 | $49.2M | $67.0M | ▼ 0.73× |
| The War with Grandpa | 35.36%† (W41) | Mini-geuse | 1 | $43.4M | $24.0M | ▲ 1.81× |
| Bad Boys for Life | 35.10%† (W3) | Mini-geuse | 2 | $426.5M | $90.0M | ▲ 4.74× |
| Let Him Go | 34.29%† (W45) | Mini-geuse | 1 | $11.6M | $21.0M | ▼ 0.55× |
| Birds of Prey and the Fantabulous Emancipation of One Harley Quinn | 33.04%† (W6) | Mini-geuse | 1 | $205.4M | $84.5M | ▲ 2.43× |
| Come Play | 31.85%† (W44) | Mini-geuse | 1 | $13.2M | $9.0M | ▲ 1.47× |
| Honest Thief | 31.59%† (W42) | Mini-geuse | 1 | $31.2M | $30.0M | ▲ 1.04× |
| Freaky | 31.27%† (W46) | Mini-geuse | 1 | $16.1M | $6.0M | ▲ 2.68× |
| The Invisible Man | 29.17%† (W9) | Mini-geuse | 1 | $144.5M | $7.0M | ▲ 20.64× |
| 1917 | 28.28%† (W2) | Mini-geuse | 1 | $384.6M | $95.0M | ▲ 4.05× |
| Monster Hunter | 27.71%† (W51) | Mini-geuse | 1 | $47.9M | $60.0M | ▼ 0.80× |
*Budgets are reported estimates (Box Office Mojo, The Numbers, trade press) and should be read as such. A green ▲ marks a film that returned at least its reported budget in worldwide gross; a red ▼ marks one that did not. Industry rules of thumb put real breakeven nearer 2–2.5× budget once print and advertising are counted, so a green arrow below that range is not the same as a profit. †2020 peaks are pandemic-market shares and are recorded in-year but excluded from all-time records.
2021: the audience trickles back, and Spider-Man breaks the meter
At $4.586 billion domestic across 53 chart weeks, 2021 produced twenty-eight distinct star movies (7 Geuse · 10 Betelgeuse · 11 Mini-geuse). That is the 2nd-largest crop in the twenty-year index. Forty-three of the year’s 53 measurable weeks had an owner; ten had none. Five weeks carried two owners at once (W17, W22, W23, W29, W41).
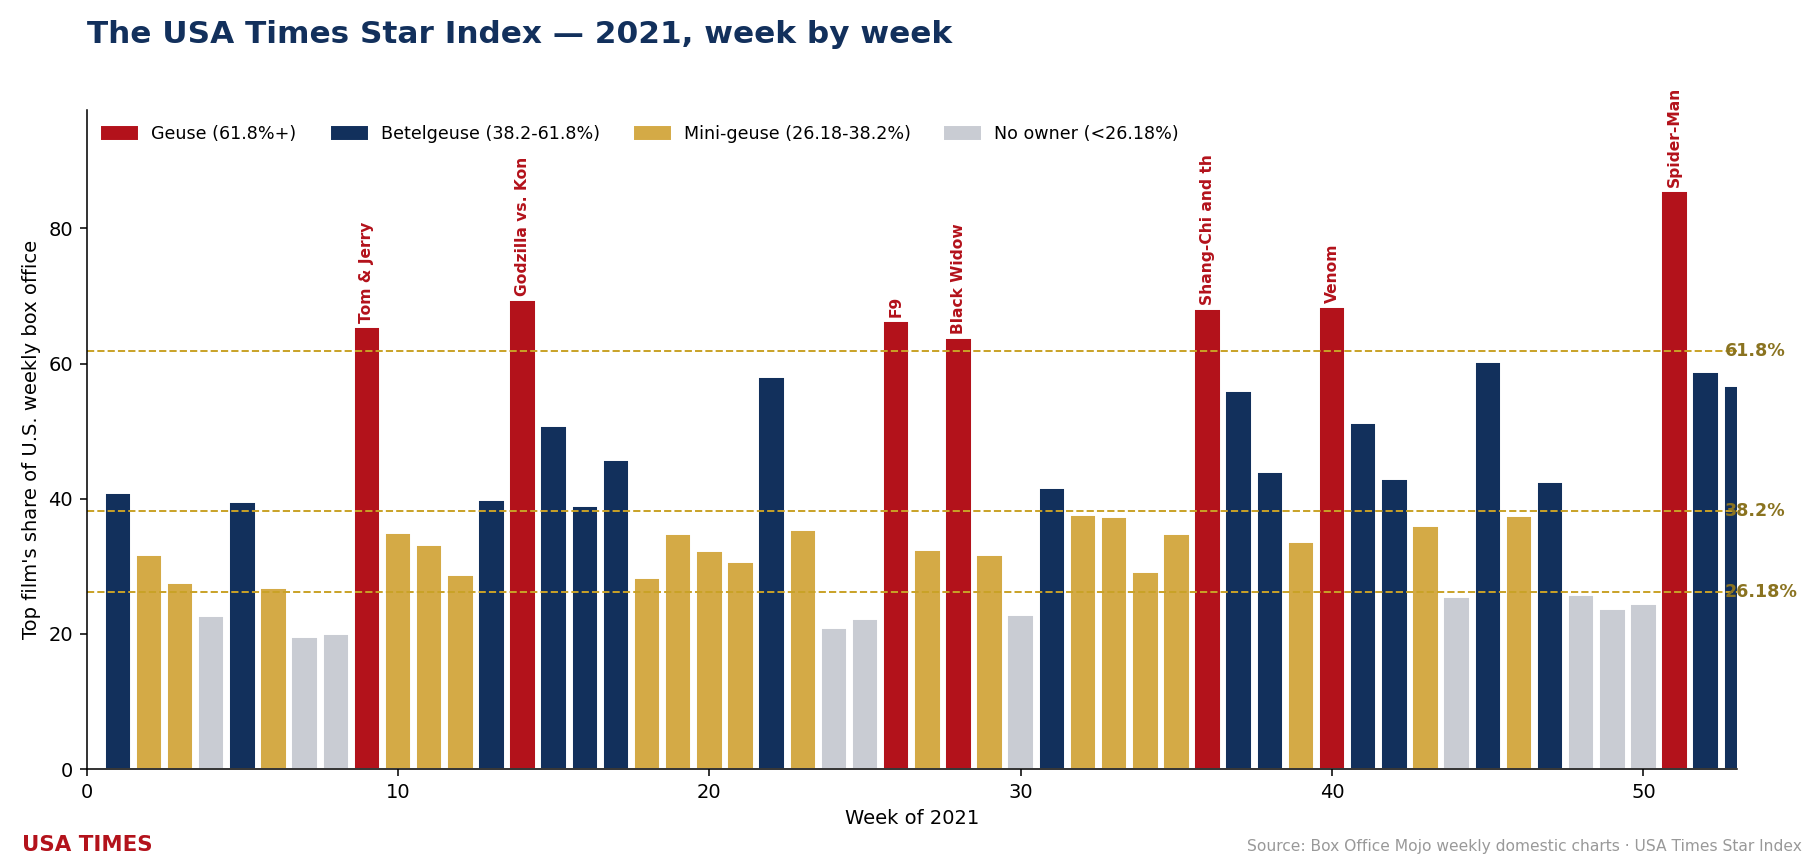
Seven films cleared the 61.8% Geuse line: Spider-Man: No Way Home (85.58%, W51), Godzilla vs. Kong (69.39%, W14), Venom: Let There Be Carnage (68.38%, W40), Shang-Chi and the Legend of the Ten Rings (68.06%, W36), F9: The Fast Saga (66.30%, W26), Tom & Jerry (65.38%, W9) and Black Widow (63.78%, W28). Ten more peaked in Betelgeuse territory (38.2–61.8%): Eternals (60.23%, W45), A Quiet Place Part II (57.99%, W22), No Time to Die (51.25%, W41), Demon Slayer: Kimetsu no Yaiba – The Movie: Mugen Train (45.66%, W17), Halloween Kills (42.84%, W42) and Ghostbusters: Afterlife (42.48%, W47), plus four more. Eleven finished as Mini-geuse-tier owners, from The Suicide Squad (37.61%) down to Cruella (27.22%, the year’s narrowest clearance of the 26.18% bar).
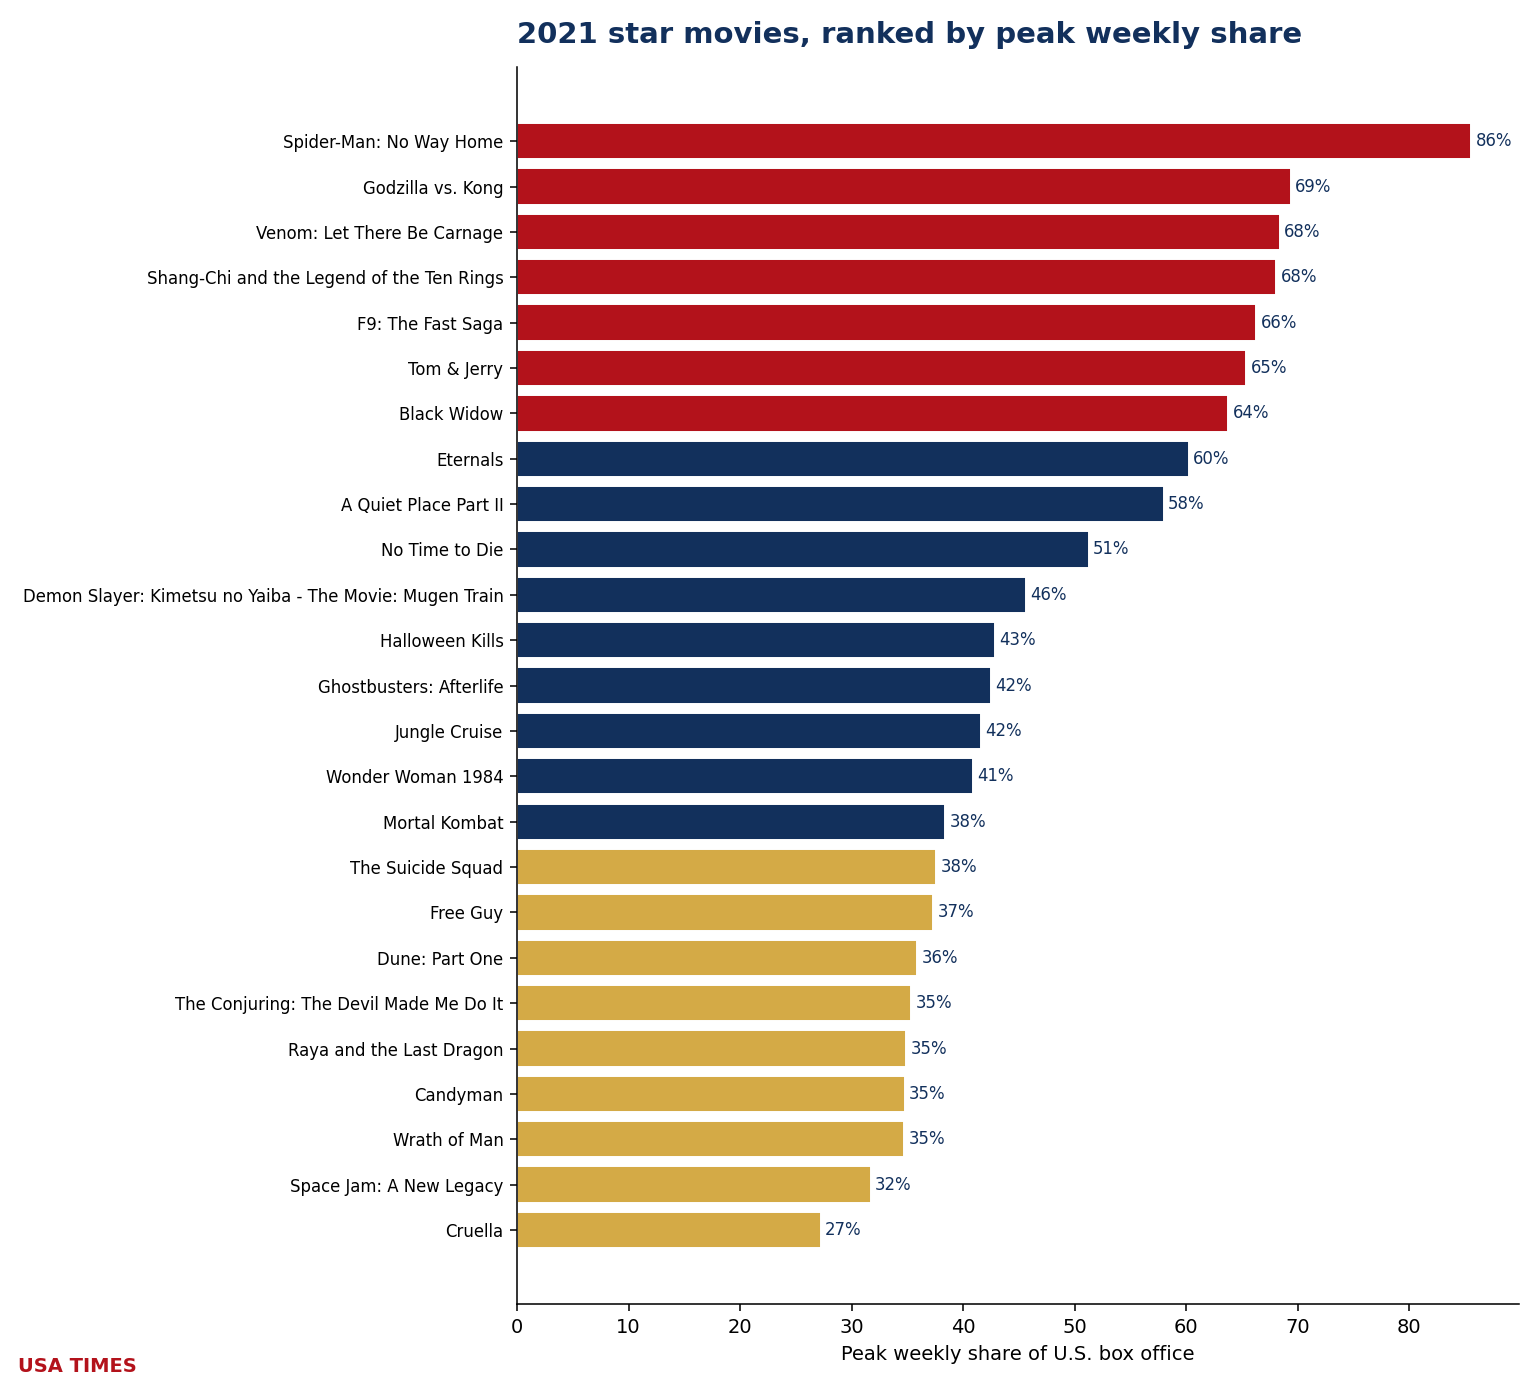
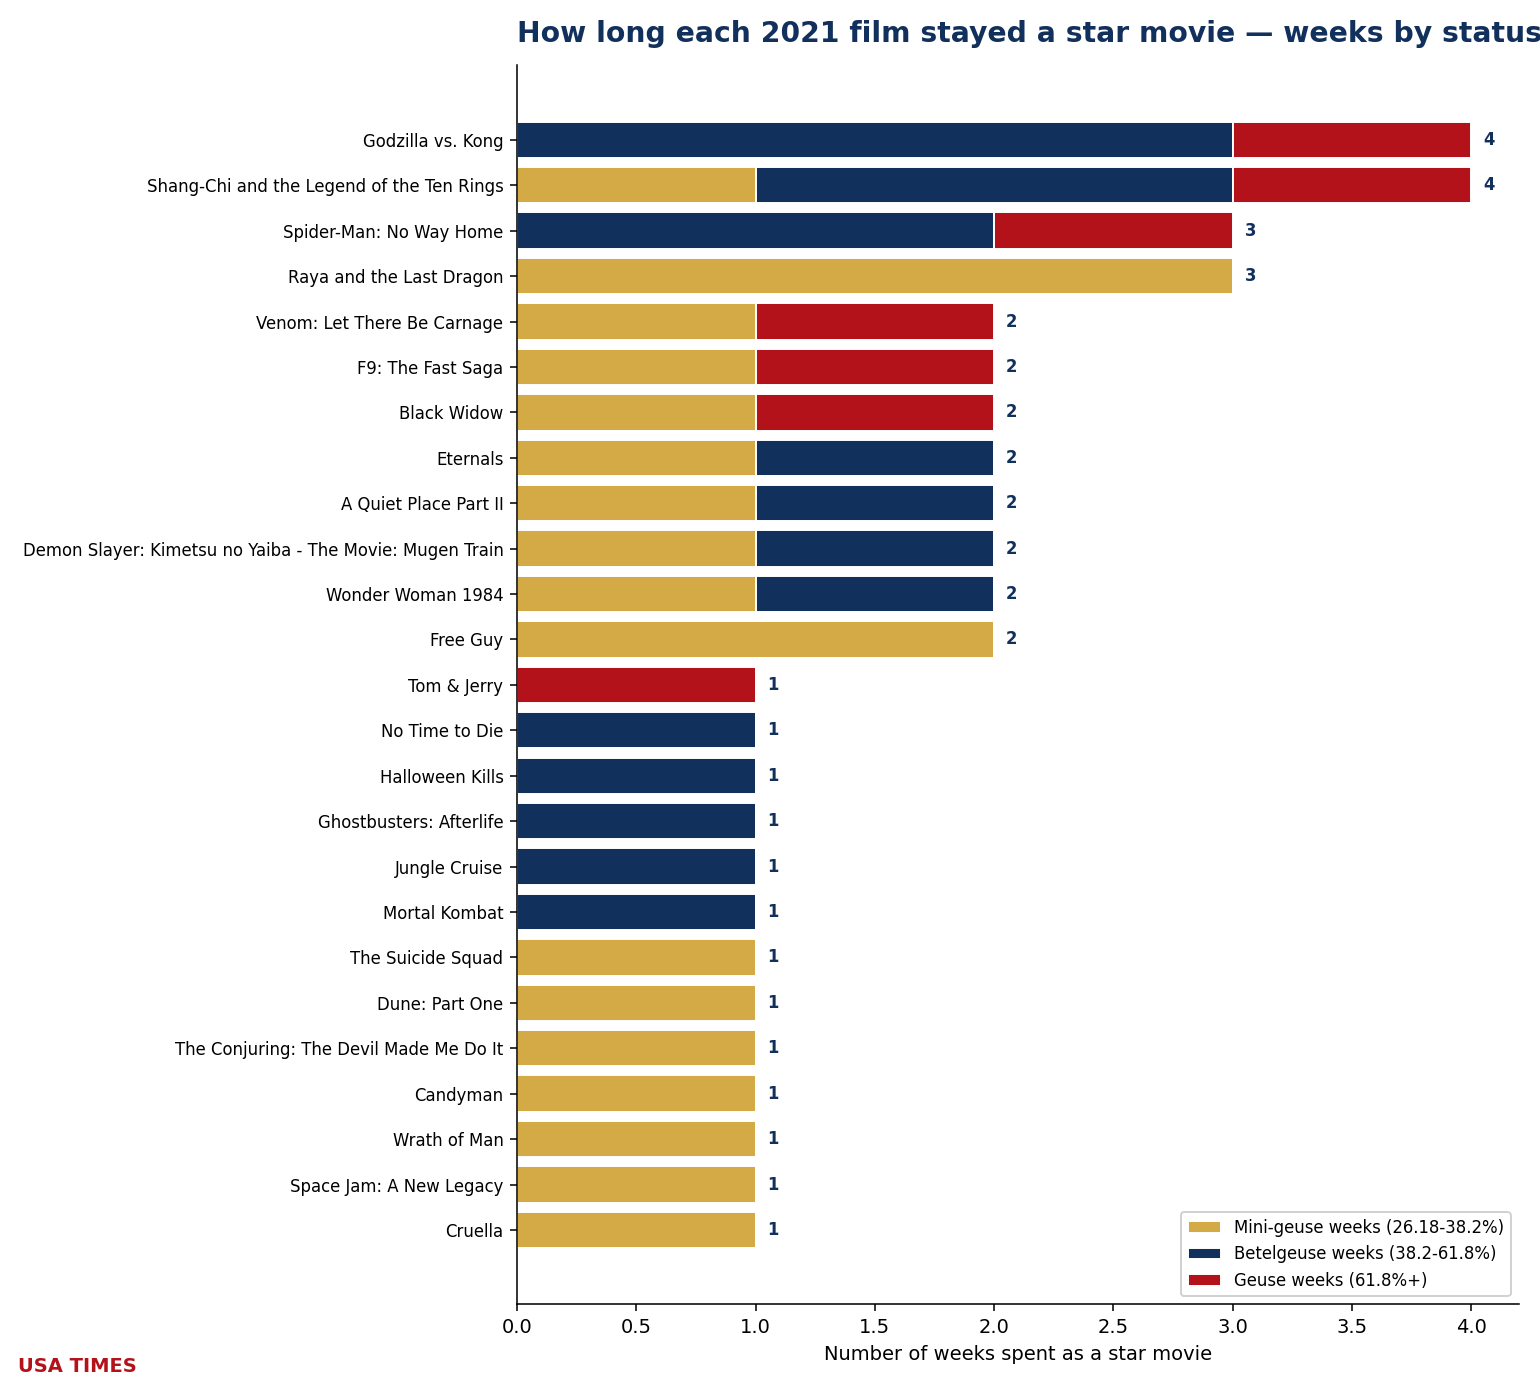
Two films tie for the longest hold at 4 weeks each: Godzilla vs. Kong and Shang-Chi and the Legend of the Ten Rings. Fourteen of the twenty-eight owners (50%) were one-week wonders. Money: 2021 is not a clean sweep — two owners finished below 1× budget: Wonder Woman 1984 (0.85×) and The Suicide Squad (0.91×). Best return of the year: Demon Slayer: Kimetsu no Yaiba – The Movie: Mugen Train at 32.26×, the 6th-best return anywhere in the twenty-year index. Concentration: the year’s owners took 48.9% of all domestic box office during the weeks they owned — the 2nd-highest in the index.
The 2021 ledger
| Film | Peak share | Tier at peak | Weeks as event | WW gross | Budget* | WW / budget |
|---|---|---|---|---|---|---|
| Spider-Man: No Way Home | 85.58% (W51) | Geuse | 3 | $1.922B | $200.0M | ▲ 9.61× |
| Godzilla vs. Kong | 69.39% (W14) | Geuse | 4 | $470.1M | $200.0M | ▲ 2.35× |
| Venom: Let There Be Carnage | 68.38% (W40) | Geuse | 2 | $501.0M | $110.0M | ▲ 4.55× |
| Shang-Chi and the Legend of the Ten Rings | 68.06% (W36) | Geuse | 4 | $432.2M | $150.0M | ▲ 2.88× |
| F9: The Fast Saga | 66.30% (W26) | Geuse | 2 | $726.2M | $200.0M | ▲ 3.63× |
| Tom & Jerry | 65.38% (W9) | Geuse | 1 | $136.5M | $50.0M | ▲ 2.73× |
| Black Widow | 63.78% (W28) | Geuse | 2 | $379.8M | $200.0M | ▲ 1.90× |
| Eternals | 60.23% (W45) | Betelgeuse | 2 | $402.1M | $200.0M | ▲ 2.01× |
| A Quiet Place Part II | 57.99% (W22) | Betelgeuse | 2 | $297.5M | $61.0M | ▲ 4.88× |
| No Time to Die | 51.25% (W41) | Betelgeuse | 1 | $774.2M | $250.0M | ▲ 3.10× |
| Demon Slayer: Kimetsu no Yaiba – The Movie: Mugen Train | 45.66% (W17) | Betelgeuse | 2 | $506.5M | $15.7M | ▲ 32.26× |
| Halloween Kills | 42.84% (W42) | Betelgeuse | 1 | $133.4M | $20.0M | ▲ 6.67× |
| Ghostbusters: Afterlife | 42.48% (W47) | Betelgeuse | 1 | $204.4M | $75.0M | ▲ 2.73× |
| Jungle Cruise | 41.59% (W31) | Betelgeuse | 1 | $220.9M | $200.0M | ▲ 1.10× |
| Wonder Woman 1984 | 40.87% (W1) | Betelgeuse | 2 | $169.6M | $200.0M | ▼ 0.85× |
| The Little Things | 39.55% (W5) | Betelgeuse | 2 | $30.8M | $30.0M | ▲ 1.03× |
| Mortal Kombat | 38.37% (W17) | Betelgeuse | 1 | $84.4M | $55.0M | ▲ 1.53× |
| The Suicide Squad | 37.61% (W32) | Mini-geuse | 1 | $168.7M | $185.0M | ▼ 0.91× |
| Free Guy | 37.34% (W33) | Mini-geuse | 2 | $331.5M | $110.0M | ▲ 3.01× |
| Dune: Part One | 35.90% (W43) | Mini-geuse | 1 | $410.7M | $165.0M | ▲ 2.49× |
| The Conjuring: The Devil Made Me Do It | 35.34% (W23) | Mini-geuse | 1 | $202.0M | $39.0M | ▲ 5.18× |
| Raya and the Last Dragon | 34.92% (W10) | Mini-geuse | 3 | $130.3M | $100.0M | ▲ 1.30× |
| Candyman | 34.75% (W35) | Mini-geuse | 1 | $77.4M | $25.0M | ▲ 3.10× |
| Wrath of Man | 34.73% (W19) | Mini-geuse | 1 | $104.0M | $40.0M | ▲ 2.60× |
| Spiral | 32.26% (W20) | Mini-geuse | 2 | $40.6M | $20.0M | ▲ 2.03× |
| Space Jam: A New Legacy | 31.70% (W29) | Mini-geuse | 1 | $163.7M | $150.0M | ▲ 1.09× |
| The Marksman | 27.51% (W3) | Mini-geuse | 1 | $23.1M | $23.0M | ▲ 1.00× |
| Cruella | 27.22% (W22) | Mini-geuse | 1 | $233.5M | $100.0M | ▲ 2.33× |
*Budgets are reported estimates (Box Office Mojo, The Numbers, trade press) and should be read as such. A green ▲ marks a film that returned at least its reported budget in worldwide gross; a red ▼ marks one that did not. Industry rules of thumb put real breakeven nearer 2–2.5× budget once print and advertising are counted, so a green arrow below that range is not the same as a profit.
2022: six Geuses, and the week the market hit its theoretical limit
At $7.367 billion domestic across 52 chart weeks, 2022 produced twenty-four distinct star movies (6 Geuse · 9 Betelgeuse · 9 Mini-geuse). Forty-two of the year’s 52 measurable weeks had an owner; ten had none. Four weeks carried two owners at once (W2, W15, W23, W24).
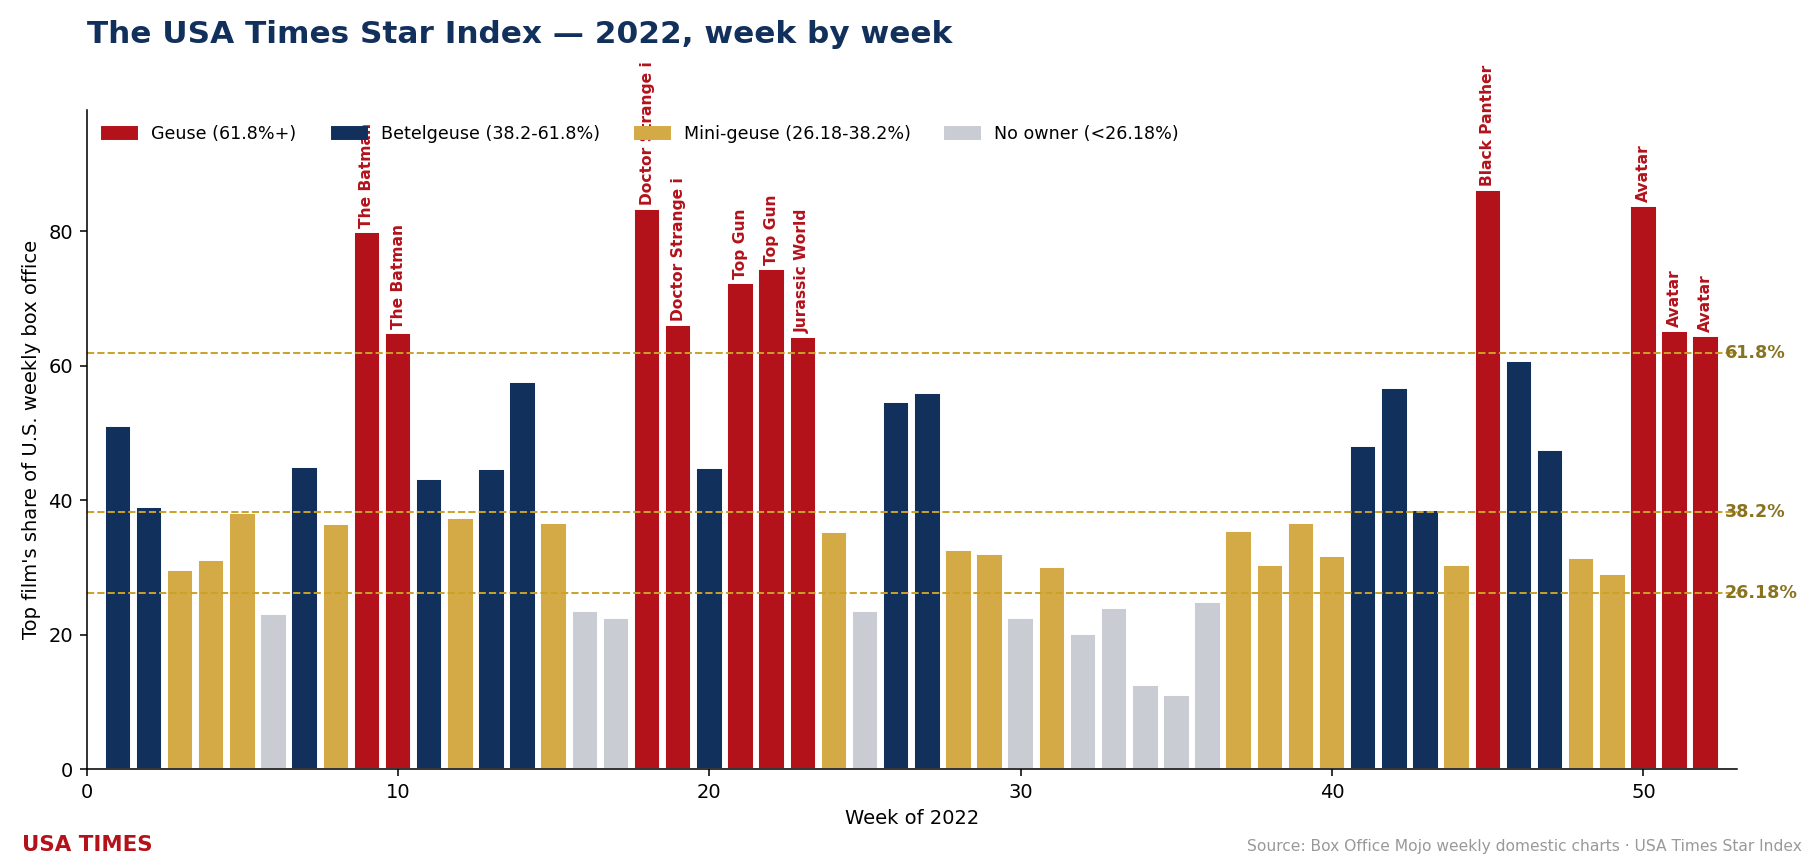
Six films cleared the 61.8% Geuse line: Black Panther: Wakanda Forever (86.07%, W45), Avatar: The Way of Water (83.65%, W50), Doctor Strange in the Multiverse of Madness (83.31%, W18), The Batman (79.82%, W9), Top Gun: Maverick (74.37%, W22) and Jurassic World: Dominion (64.30%, W23). Nine more peaked in Betelgeuse territory (38.2–61.8%): Sonic the Hedgehog 2 (57.53%, W14), Black Adam (56.71%, W42), Thor: Love and Thunder (55.94%, W27), Minions: The Rise of Gru (54.61%, W26), Spider-Man: No Way Home (50.99%, W1) and Halloween Ends (48.09%, W41), plus three more. Nine finished as Mini-geuse-tier owners, from Jackass Forever (38.13%) down to Lightyear (29.44%, the year’s narrowest clearance of the 26.18% bar).
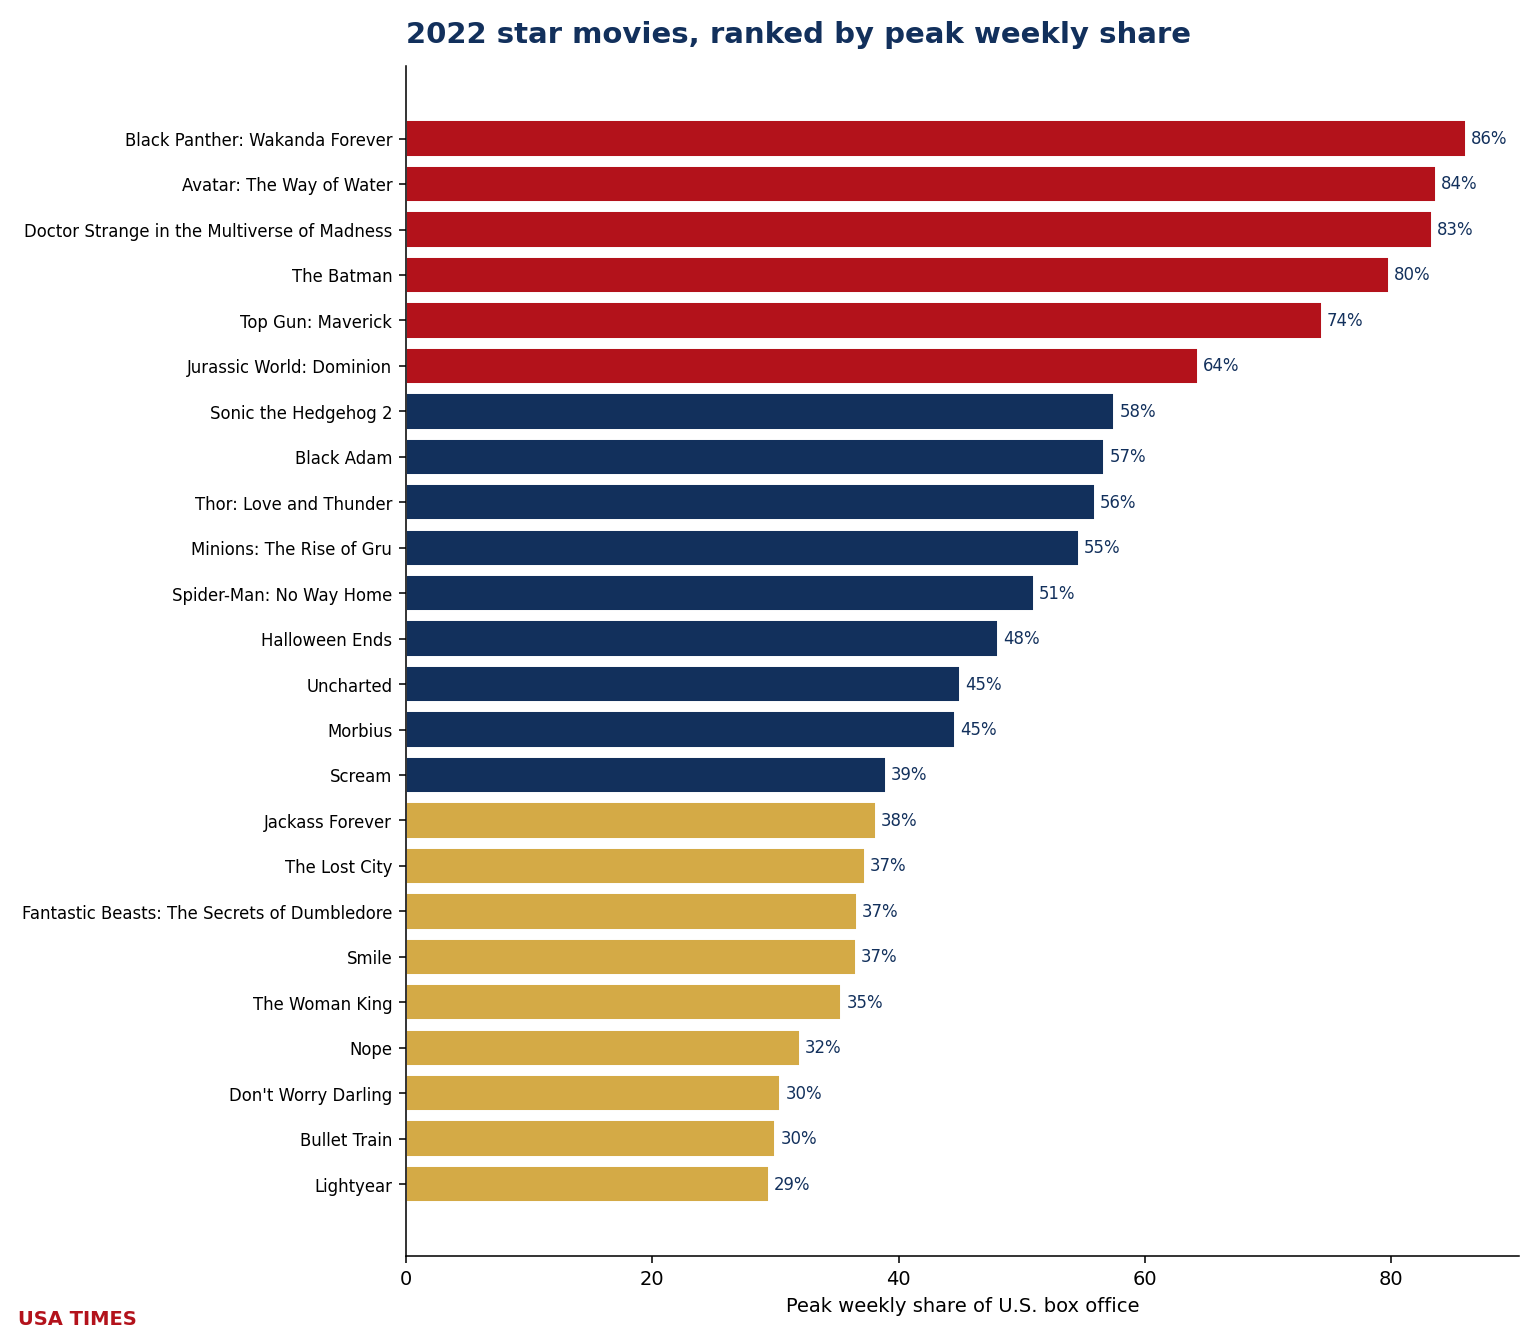
Longest hold: Black Panther: Wakanda Forever at 5 weeks as a star movie. Twelve of the twenty-four owners (50%) were one-week wonders. Money: 2022 is a clean-sweep year — all 24 owners with a reported budget finished at or above 1× that budget, one of fifteen such years in the twenty. The green arrows carry an asterisk, though: Lightyear (1.13×) and The Woman King (1.95×) sit below the informal ~2× real-world breakeven line that marketing spend imposes. Best return of the year: Smile at 12.79×. Concentration: the year’s owners took 49.9% of all domestic box office during the weeks they owned — the highest in the index.
The 2022 ledger
| Film | Peak share | Tier at peak | Weeks as event | WW gross | Budget* | WW / budget |
|---|---|---|---|---|---|---|
| Black Panther: Wakanda Forever | 86.07% (W45) | Geuse | 5 | $859.2M | $250.0M | ▲ 3.44× |
| Avatar: The Way of Water | 83.65% (W50) | Geuse | 3 | $2.321B | $400.0M | ▲ 5.80× |
| Doctor Strange in the Multiverse of Madness | 83.31% (W18) | Geuse | 3 | $955.8M | $200.0M | ▲ 4.78× |
| The Batman | 79.82% (W9) | Geuse | 3 | $772.2M | $200.0M | ▲ 3.86× |
| Top Gun: Maverick | 74.37% (W22) | Geuse | 3 | $1.496B | $170.0M | ▲ 8.80× |
| Jurassic World: Dominion | 64.30% (W23) | Geuse | 2 | $1.002B | $165.0M | ▲ 6.07× |
| Sonic the Hedgehog 2 | 57.53% (W14) | Betelgeuse | 2 | $405.4M | $110.0M | ▲ 3.69× |
| Black Adam | 56.71% (W42) | Betelgeuse | 3 | $393.5M | $195.0M | ▲ 2.02× |
| Thor: Love and Thunder | 55.94% (W27) | Betelgeuse | 2 | $760.9M | $250.0M | ▲ 3.04× |
| Minions: The Rise of Gru | 54.61% (W26) | Betelgeuse | 1 | $940.5M | $80.0M | ▲ 11.76× |
| Spider-Man: No Way Home | 50.99% (W1) | Betelgeuse | 4 | $1.922B | $200.0M | ▲ 9.61× |
| Halloween Ends | 48.09% (W41) | Betelgeuse | 1 | $104.4M | $30.0M | ▲ 3.48× |
| Uncharted | 44.97% (W7) | Betelgeuse | 2 | $407.1M | $120.0M | ▲ 3.39× |
| Morbius | 44.60% (W13) | Betelgeuse | 1 | $167.5M | $75.0M | ▲ 2.23× |
| Scream | 38.97% (W2) | Betelgeuse | 1 | $137.7M | $24.0M | ▲ 5.74× |
| Jackass Forever | 38.13% (W5) | Mini-geuse | 1 | $80.6M | $10.0M | ▲ 8.06× |
| The Lost City | 37.27% (W12) | Mini-geuse | 1 | $192.9M | $68.0M | ▲ 2.84× |
| Fantastic Beasts: The Secrets of Dumbledore | 36.62% (W15) | Mini-geuse | 1 | $407.2M | $200.0M | ▲ 2.04× |
| Smile | 36.55% (W39) | Mini-geuse | 2 | $217.4M | $17.0M | ▲ 12.79× |
| The Woman King | 35.36% (W37) | Mini-geuse | 1 | $97.6M | $50.0M | ▲ 1.95× |
| Nope | 31.99% (W29) | Mini-geuse | 1 | $171.2M | $68.0M | ▲ 2.52× |
| Don’t Worry Darling | 30.41% (W38) | Mini-geuse | 1 | $87.6M | $35.0M | ▲ 2.50× |
| Bullet Train | 30.00% (W31) | Mini-geuse | 1 | $239.3M | $90.0M | ▲ 2.66× |
| Lightyear | 29.44% (W24) | Mini-geuse | 1 | $226.4M | $200.0M | ▲ 1.13× |
*Budgets are reported estimates (Box Office Mojo, The Numbers, trade press) and should be read as such. A green ▲ marks a film that returned at least its reported budget in worldwide gross; a red ▼ marks one that did not. Industry rules of thumb put real breakeven nearer 2–2.5× budget once print and advertising are counted, so a green arrow below that range is not the same as a profit.
2023: the year of Barbenheimer — and the near-miss that proves the rule
At $8.868 billion domestic across 52 chart weeks, 2023 produced twenty-six distinct star movies (4 Geuse · 11 Betelgeuse · 11 Mini-geuse). Thirty-six of the year’s 52 measurable weeks had an owner; sixteen had none. Four weeks carried two owners at once (W1, W20, W23, W42).
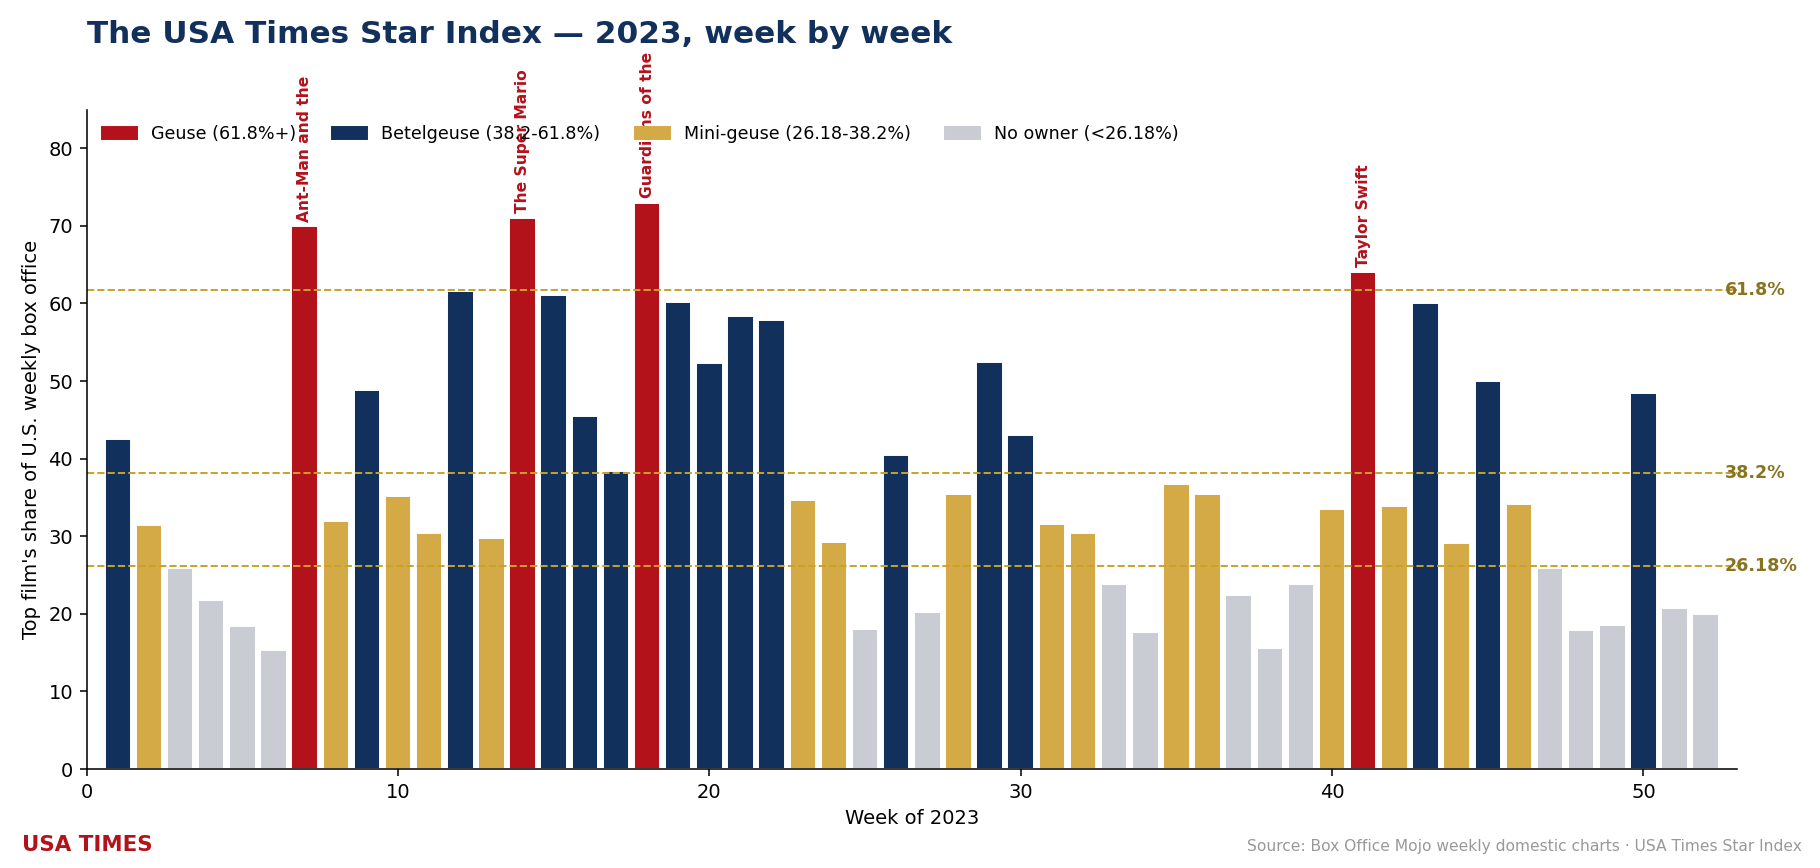
Four films cleared the 61.8% Geuse line: Guardians of the Galaxy Vol. 3 (72.99%, W18), The Super Mario Bros. Movie (71.08%, W14), Ant-Man and the Wasp: Quantumania (69.93%, W7) and Taylor Swift: The Eras Tour (64.06%, W41). Eleven more peaked in Betelgeuse territory (38.2–61.8%): John Wick: Chapter 4 (61.60%, W12), Five Nights at Freddy’s (60.11%, W43), The Little Mermaid (58.35%, W21), Spider-Man: Across the Spider-Verse (57.86%, W22), Barbie (52.48%, W29) and Fast X (52.38%, W20), plus five more. Eleven finished as Mini-geuse-tier owners, from The Equalizer 3 (36.70%) down to M3GAN (27.33%, the year’s narrowest clearance of the 26.18% bar).
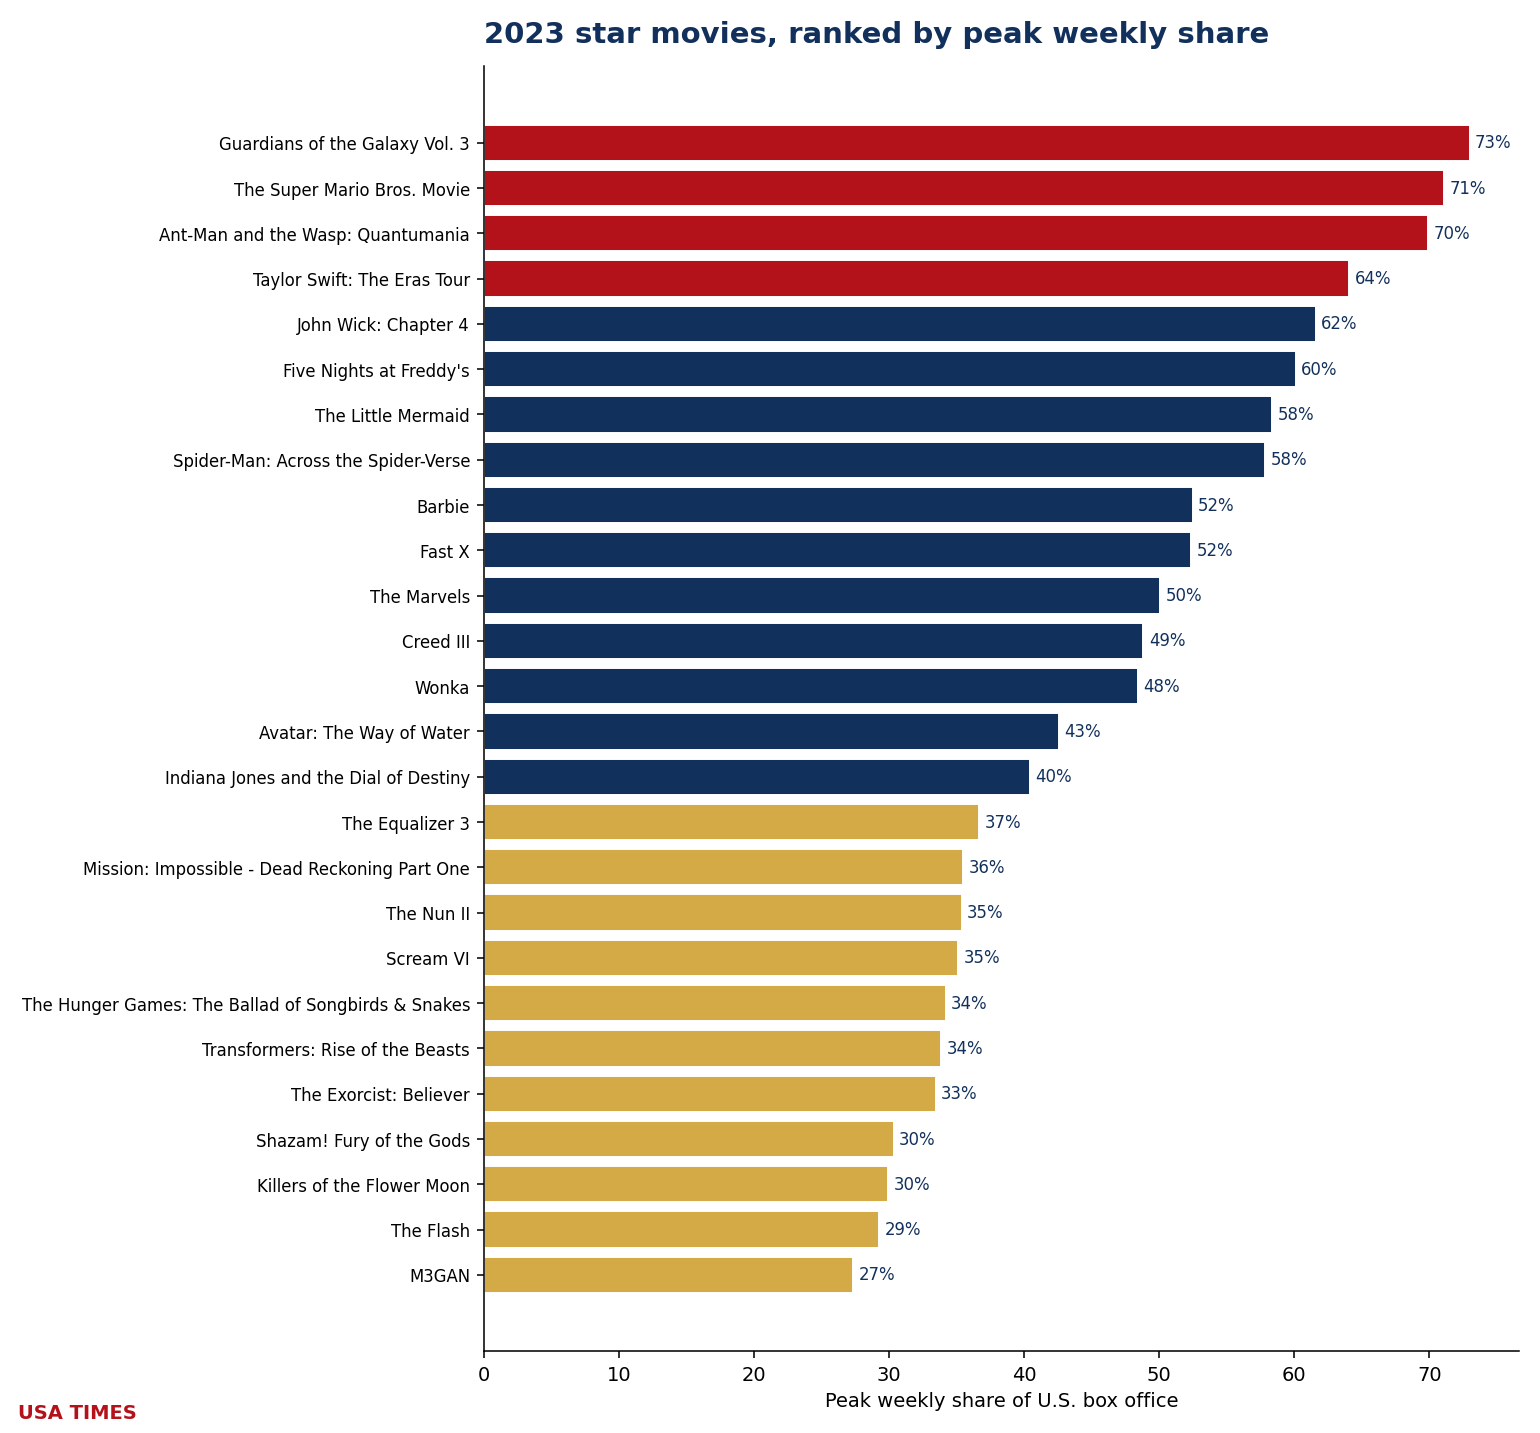
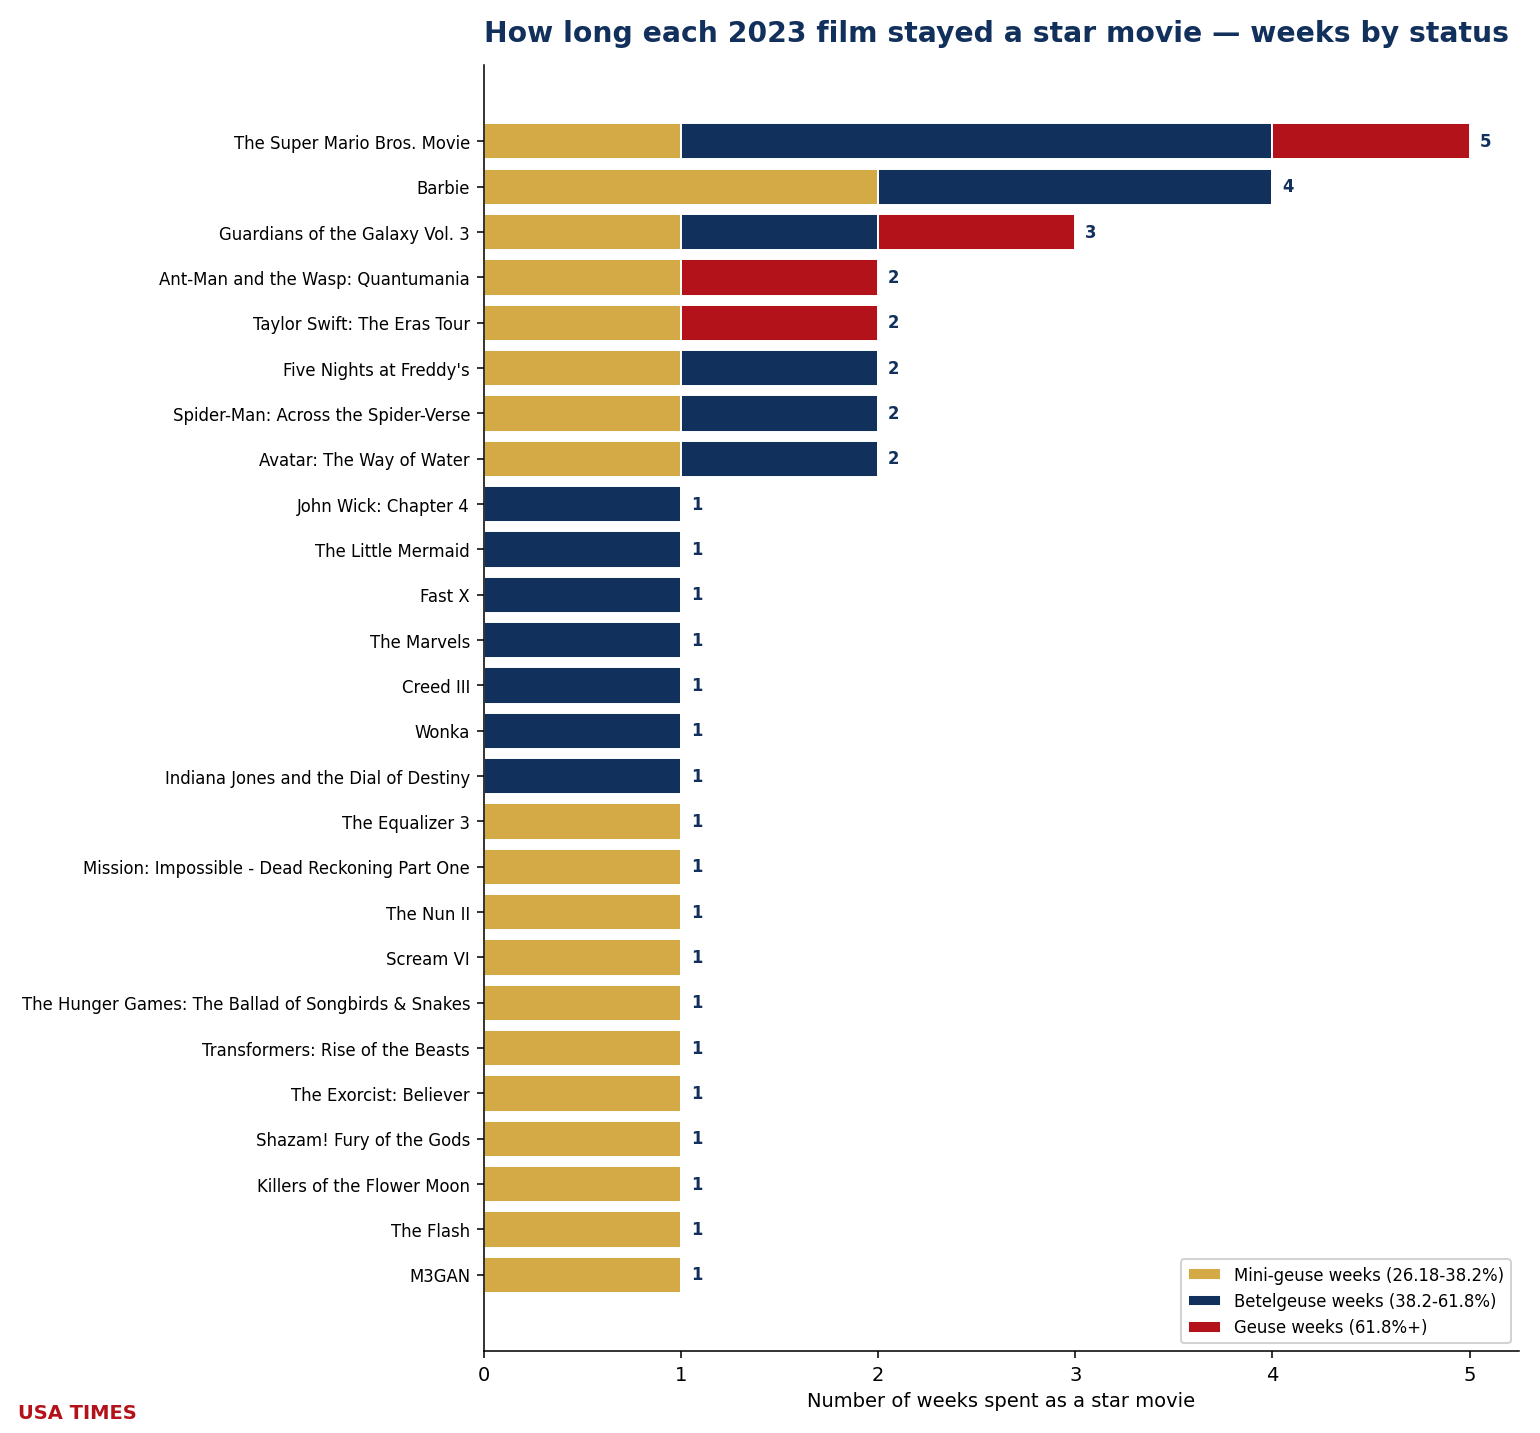
Longest hold: The Super Mario Bros. Movie at 5 weeks as a star movie. Eighteen of the twenty-six owners (69%) were one-week wonders. Money: 2023 is not a clean sweep — two owners finished below 1× budget: The Marvels (0.76×) and Killers of the Flower Moon (0.79×). Best return of the year: Taylor Swift: The Eras Tour at 17.45×. Concentration: the year’s owners took 37.3% of all domestic box office during the weeks they owned.
The 2023 ledger
| Film | Peak share | Tier at peak | Weeks as event | WW gross | Budget* | WW / budget |
|---|---|---|---|---|---|---|
| Guardians of the Galaxy Vol. 3 | 72.99% (W18) | Geuse | 3 | $845.6M | $250.0M | ▲ 3.38× |
| The Super Mario Bros. Movie | 71.08% (W14) | Geuse | 5 | $1.361B | $100.0M | ▲ 13.61× |
| Ant-Man and the Wasp: Quantumania | 69.93% (W7) | Geuse | 2 | $476.1M | $200.0M | ▲ 2.38× |
| Taylor Swift: The Eras Tour | 64.06% (W41) | Geuse | 2 | $261.7M | $15.0M | ▲ 17.45× |
| John Wick: Chapter 4 | 61.60% (W12) | Betelgeuse | 1 | $447.1M | $100.0M | ▲ 4.47× |
| Five Nights at Freddy’s | 60.11% (W43) | Betelgeuse | 2 | $291.5M | $20.0M | ▲ 14.57× |
| The Little Mermaid | 58.35% (W21) | Betelgeuse | 1 | $569.6M | $250.0M | ▲ 2.28× |
| Spider-Man: Across the Spider-Verse | 57.86% (W22) | Betelgeuse | 2 | $690.5M | $100.0M | ▲ 6.91× |
| Barbie | 52.48% (W29) | Betelgeuse | 4 | $1.447B | $145.0M | ▲ 9.98× |
| Fast X | 52.38% (W20) | Betelgeuse | 1 | $704.9M | $340.0M | ▲ 2.07× |
| The Marvels | 50.06% (W45) | Betelgeuse | 1 | $206.1M | $270.0M | ▼ 0.76× |
| Creed III | 48.83% (W9) | Betelgeuse | 1 | $276.1M | $75.0M | ▲ 3.68× |
| Wonka | 48.43% (W50) | Betelgeuse | 1 | $634.5M | $125.0M | ▲ 5.08× |
| Avatar: The Way of Water | 42.57% (W1) | Betelgeuse | 2 | $2.320B | $350.0M | ▲ 6.63× |
| Indiana Jones and the Dial of Destiny | 40.43% (W26) | Betelgeuse | 1 | $384.0M | $295.0M | ▲ 1.30× |
| The Equalizer 3 | 36.70% (W35) | Mini-geuse | 1 | $191.1M | $70.0M | ▲ 2.73× |
| Mission: Impossible – Dead Reckoning Part One | 35.51% (W28) | Mini-geuse | 1 | $571.1M | $290.0M | ▲ 1.97× |
| The Nun II | 35.39% (W36) | Mini-geuse | 1 | $269.7M | $38.5M | ▲ 7.00× |
| Scream VI | 35.14% (W10) | Mini-geuse | 1 | $166.6M | $35.0M | ▲ 4.76× |
| The Hunger Games: The Ballad of Songbirds & Snakes | 34.21% (W46) | Mini-geuse | 1 | $347.6M | $100.0M | ▲ 3.48× |
| Transformers: Rise of the Beasts | 33.89% (W23) | Mini-geuse | 1 | $441.7M | $200.0M | ▲ 2.21× |
| The Exorcist: Believer | 33.47% (W40) | Mini-geuse | 1 | $136.3M | $30.0M | ▲ 4.54× |
| Shazam! Fury of the Gods | 30.36% (W11) | Mini-geuse | 1 | $134.1M | $125.0M | ▲ 1.07× |
| Killers of the Flower Moon | 29.92% (W42) | Mini-geuse | 1 | $158.8M | $200.0M | ▼ 0.79× |
| The Flash | 29.27% (W24) | Mini-geuse | 1 | $271.4M | $200.0M | ▲ 1.36× |
| M3GAN | 27.33% (W1) | Mini-geuse | 1 | $180.1M | $12.0M | ▲ 15.01× |
*Budgets are reported estimates (Box Office Mojo, The Numbers, trade press) and should be read as such. A green ▲ marks a film that returned at least its reported budget in worldwide gross; a red ▼ marks one that did not. Industry rules of thumb put real breakeven nearer 2–2.5× budget once print and advertising are counted, so a green arrow below that range is not the same as a profit.
2024: twenty-eight owners, and the first year the money turned
At $8.557 billion domestic across 52 chart weeks, 2024 produced twenty-eight distinct star movies (4 Geuse · 12 Betelgeuse · 12 Mini-geuse). That is the largest crop in the twenty-year index. Thirty-eight of the year’s 52 measurable weeks had an owner; fourteen had none. Seven weeks carried two owners at once (W10, W11, W20, W32, W38, W48, W49).
Four films cleared the 61.8% Geuse line: Inside Out 2 (73.26%, W24), Beetlejuice Beetlejuice (72.92%, W36), Deadpool & Wolverine (71.64%, W30) and Dune: Part Two (71.22%, W9). Twelve more peaked in Betelgeuse territory (38.2–61.8%): Kingdom of the Planet of the Apes (58.30%, W19), Godzilla x Kong: The New Empire (55.22%, W13), Bad Boys: Ride or Die (52.53%, W23), Twisters (52.13%, W29), Venom: The Last Dance (50.25%, W43) and Despicable Me 4 (48.94%, W27), plus six more. Twelve finished as Mini-geuse-tier owners, from The Wild Robot (37.48%) down to Mean Girls (27.52%, the year’s narrowest clearance of the 26.18% bar).
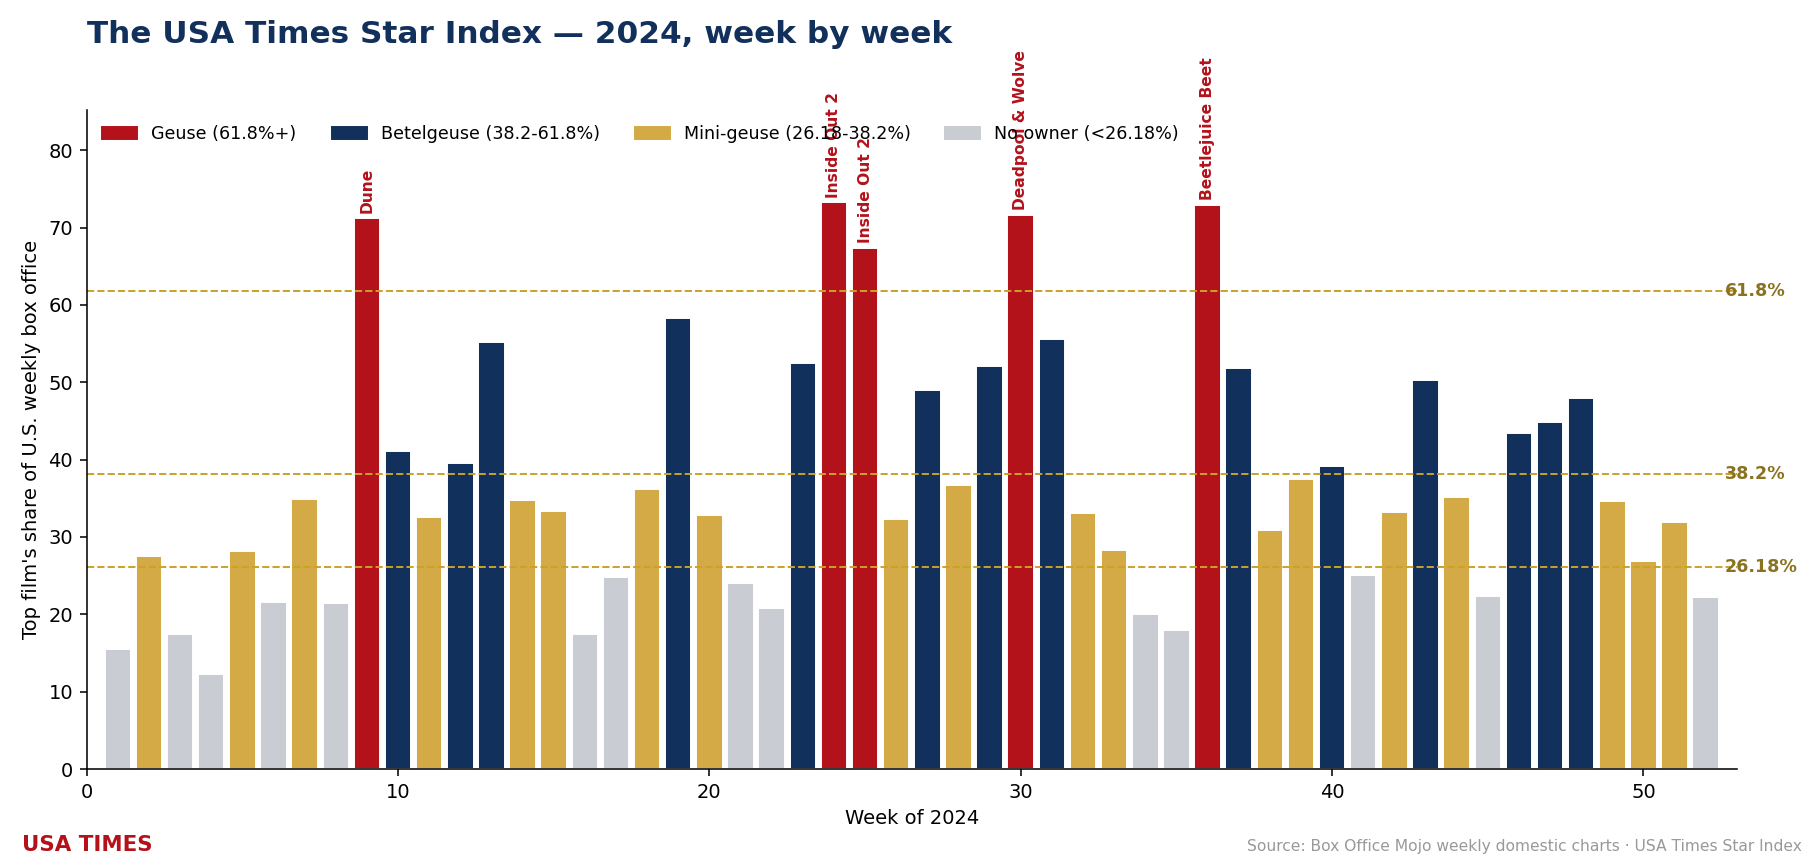
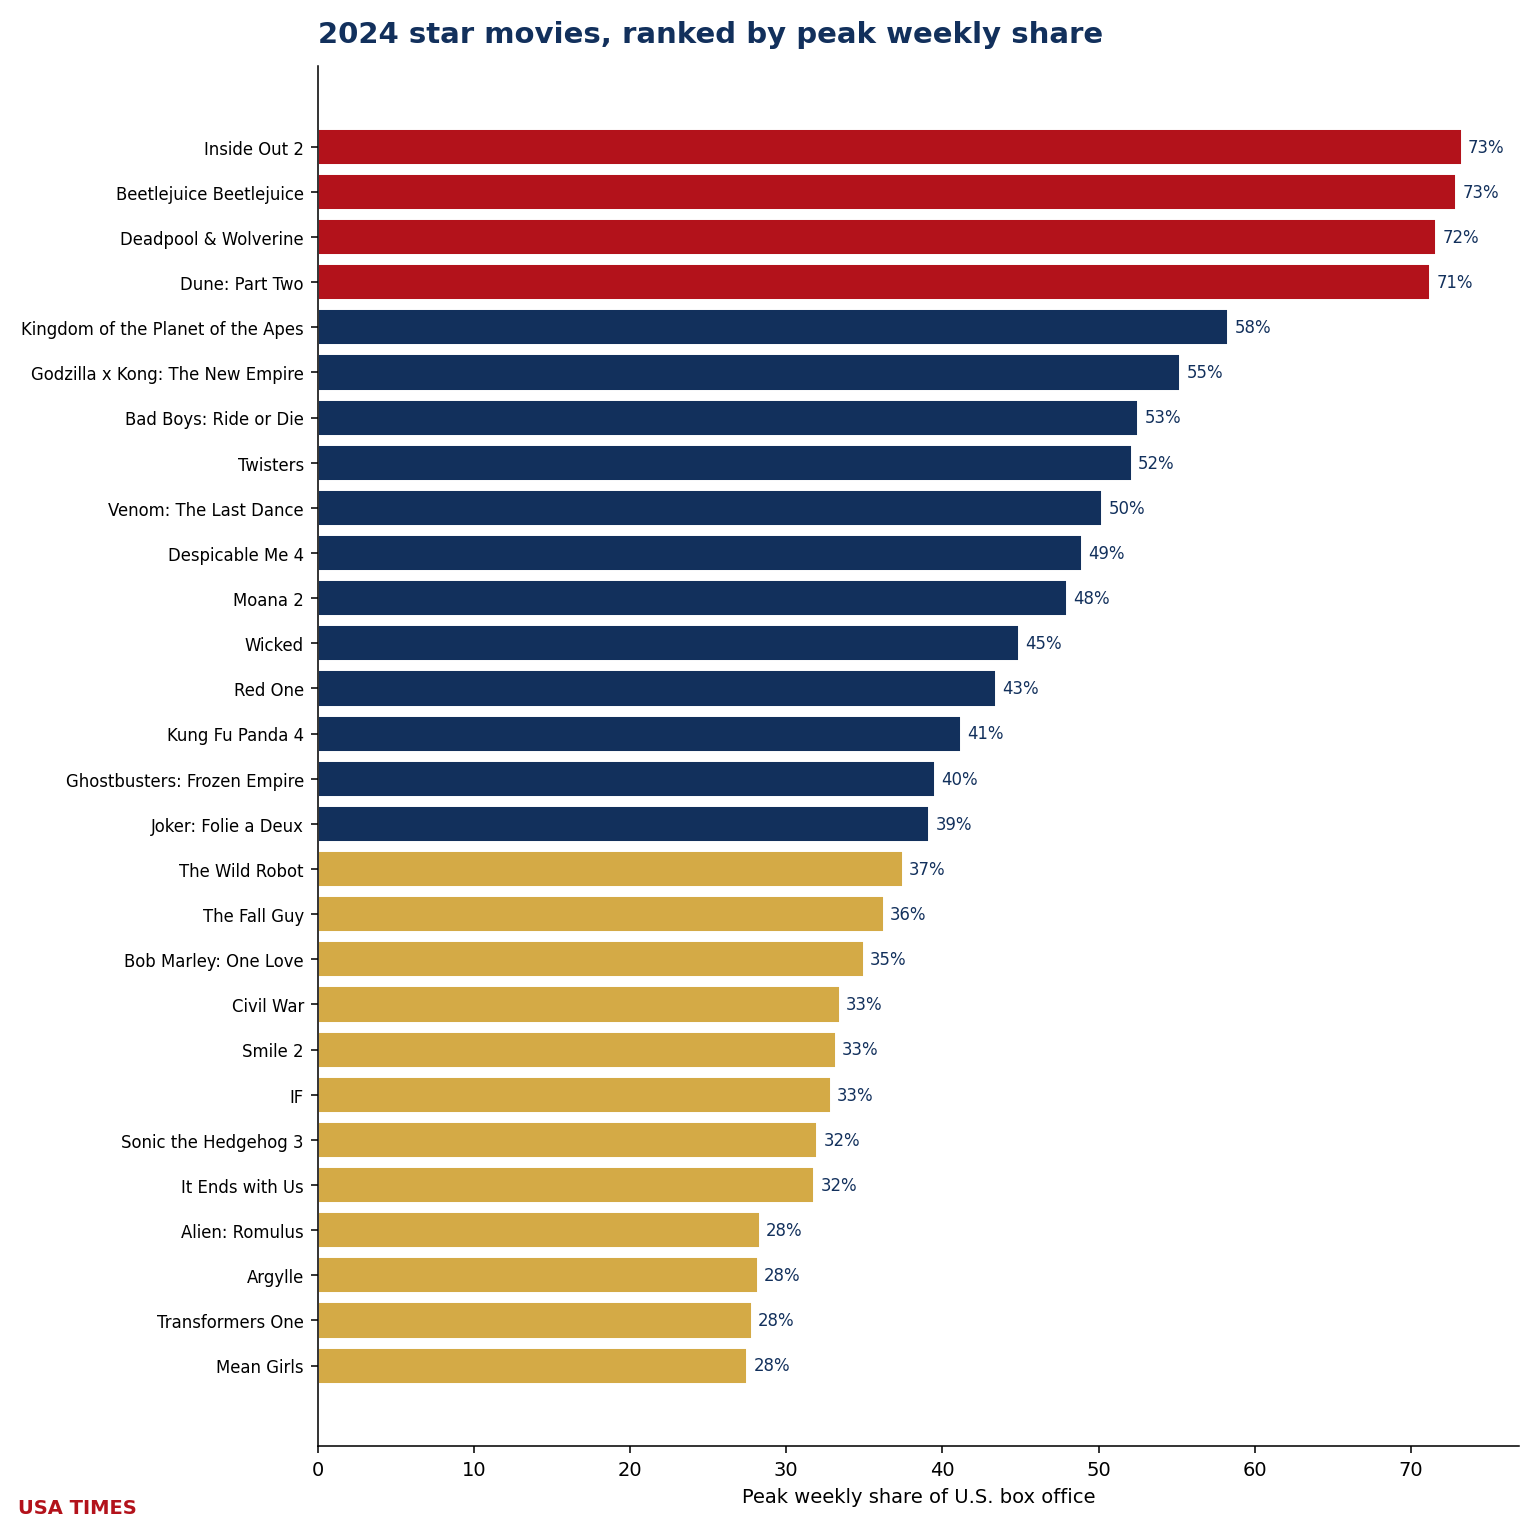
Six films tie for the longest hold at 3 weeks each: Inside Out 2, Beetlejuice Beetlejuice, Deadpool & Wolverine, Dune: Part Two, Moana 2 and Wicked. Seventeen of the twenty-eight owners (61%) were one-week wonders. Money: 2024 is not a clean sweep — two owners finished below 1× budget: Argylle (0.48×) and Red One (0.74×). Best return of the year: It Ends with Us at 14.04×. Concentration: the year’s owners took 42.2% of all domestic box office during the weeks they owned — the 3rd-highest in the index.
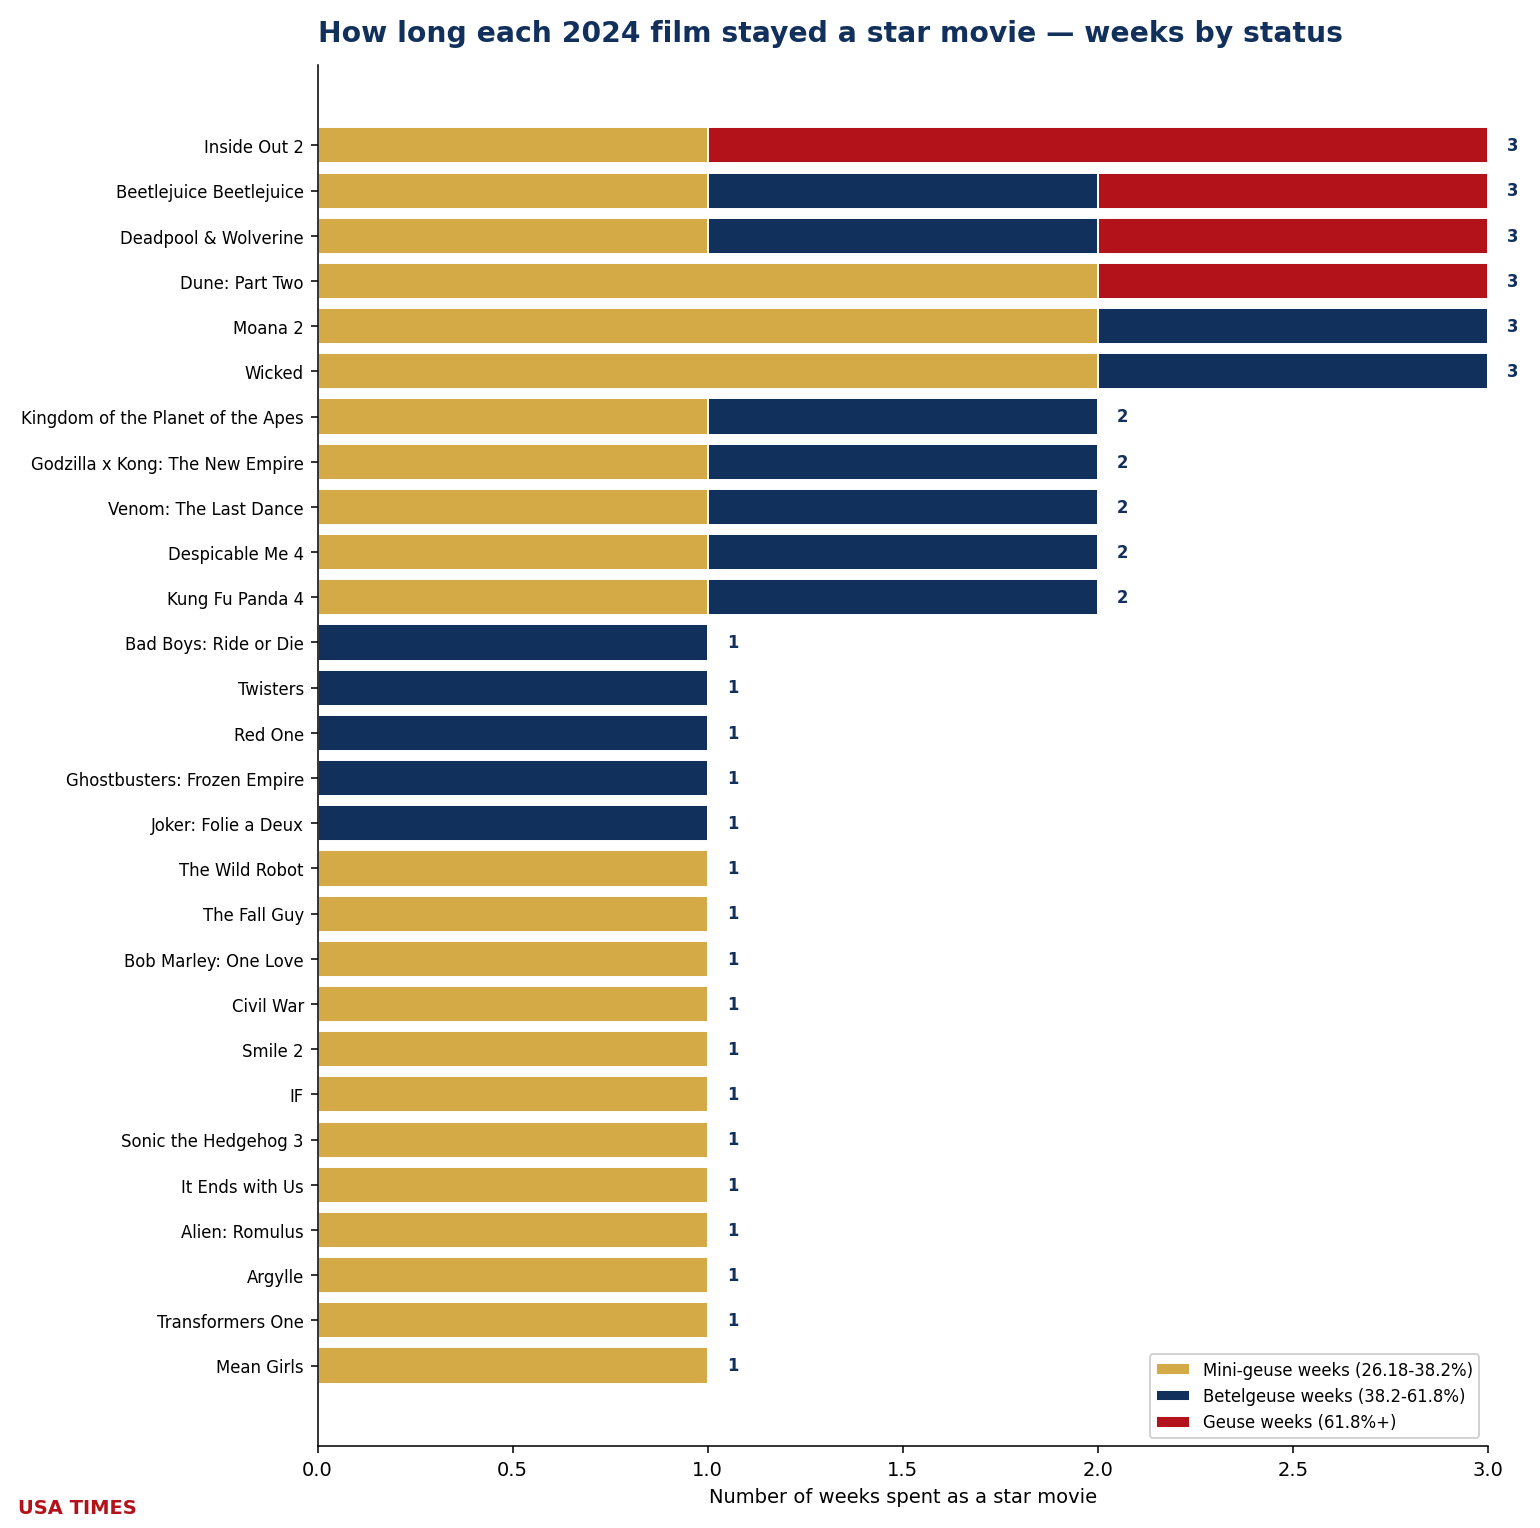
The 2024 ledger
| Film | Peak share | Tier at peak | Weeks as event | WW gross | Budget* | WW / budget |
|---|---|---|---|---|---|---|
| Inside Out 2 | 73.26% (W24) | Geuse | 3 | $1.698B | $200.0M | ▲ 8.49× |
| Beetlejuice Beetlejuice | 72.92% (W36) | Geuse | 3 | $451.0M | $100.0M | ▲ 4.51× |
| Deadpool & Wolverine | 71.64% (W30) | Geuse | 3 | $1.338B | $200.0M | ▲ 6.69× |
| Dune: Part Two | 71.22% (W9) | Geuse | 3 | $714.0M | $190.0M | ▲ 3.76× |
| Kingdom of the Planet of the Apes | 58.30% (W19) | Betelgeuse | 2 | $397.0M | $160.0M | ▲ 2.48× |
| Godzilla x Kong: The New Empire | 55.22% (W13) | Betelgeuse | 2 | $572.0M | $135.0M | ▲ 4.24× |
| Bad Boys: Ride or Die | 52.53% (W23) | Betelgeuse | 1 | $404.0M | $100.0M | ▲ 4.04× |
| Twisters | 52.13% (W29) | Betelgeuse | 1 | $371.0M | $155.0M | ▲ 2.39× |
| Venom: The Last Dance | 50.25% (W43) | Betelgeuse | 2 | $476.0M | $120.0M | ▲ 3.97× |
| Despicable Me 4 | 48.94% (W27) | Betelgeuse | 2 | $969.0M | $100.0M | ▲ 9.69× |
| Moana 2 | 47.96% (W48) | Betelgeuse | 3 | $1.059B | $150.0M | ▲ 7.06× |
| Wicked | 44.90% (W47) | Betelgeuse | 3 | $756.0M | $150.0M | ▲ 5.04× |
| Red One | 43.42% (W46) | Betelgeuse | 1 | $186.0M | $250.0M | ▼ 0.74× |
| Kung Fu Panda 4 | 41.17% (W10) | Betelgeuse | 2 | $548.0M | $85.0M | ▲ 6.45× |
| Ghostbusters: Frozen Empire | 39.50% (W12) | Betelgeuse | 1 | $226.0M | $100.0M | ▲ 2.26× |
| Joker: Folie a Deux | 39.17% (W40) | Betelgeuse | 1 | $206.0M | $190.0M | ▲ 1.08× |
| The Wild Robot | 37.48% (W39) | Mini-geuse | 1 | $325.0M | $78.0M | ▲ 4.17× |
| The Fall Guy | 36.26% (W18) | Mini-geuse | 1 | $181.0M | $130.0M | ▲ 1.39× |
| Bob Marley: One Love | 34.97% (W7) | Mini-geuse | 1 | $180.0M | $70.0M | ▲ 2.57× |
| Civil War | 33.42% (W15) | Mini-geuse | 1 | $127.0M | $50.0M | ▲ 2.54× |
| Smile 2 | 33.18% (W42) | Mini-geuse | 1 | $138.0M | $28.0M | ▲ 4.93× |
| IF | 32.86% (W20) | Mini-geuse | 1 | $190.0M | $110.0M | ▲ 1.73× |
| Sonic the Hedgehog 3 | 31.98% (W51) | Mini-geuse | 1 | $492.0M | $122.0M | ▲ 4.03× |
| It Ends with Us | 31.80% (W32) | Mini-geuse | 1 | $351.0M | $25.0M | ▲ 14.04× |
| Alien: Romulus | 28.30% (W33) | Mini-geuse | 1 | $351.0M | $80.0M | ▲ 4.39× |
| Argylle | 28.17% (W5) | Mini-geuse | 1 | $96.0M | $200.0M | ▼ 0.48× |
| Transformers One | 27.79% (W38) | Mini-geuse | 1 | $129.0M | $75.0M | ▲ 1.72× |
| Mean Girls | 27.52% (W2) | Mini-geuse | 1 | $105.0M | $36.0M | ▲ 2.92× |
*Budgets are reported estimates (Box Office Mojo, The Numbers, trade press) and should be read as such. A green ▲ marks a film that returned at least its reported budget in worldwide gross; a red ▼ marks one that did not. Industry rules of thumb put real breakeven nearer 2–2.5× budget once print and advertising are counted, so a green arrow below that range is not the same as a profit.
2025: the Betelgeuse-event year — seventeen films in the middle tier
At $8.621 billion domestic across 52 chart weeks, 2025 produced twenty-seven distinct star movies (3 Geuse · 17 Betelgeuse · 7 Mini-geuse). That is the 3rd-largest crop in the twenty-year index. Thirty-nine of the year’s 52 measurable weeks had an owner; thirteen had none. Four weeks carried two owners at once (W16, W19, W48, W49).
Three films cleared the 61.8% Geuse line: A Minecraft Movie (78.72%, W14), The Conjuring: Last Rites (65.97%, W36) and Wicked: For Good (63.86%, W47). Seventeen more peaked in Betelgeuse territory (38.2–61.8%): Superman (59.24%, W28), The Fantastic Four: First Steps (59.24%, W30), Jurassic World: Rebirth (57.03%, W27), Lilo & Stitch (54.47%, W21), Captain America: Brave New World (54.39%, W7) and How to Train Your Dragon (53.40%, W24), plus eleven more. Seven finished as Mini-geuse-tier owners, from Dog Man (37.63%) down to Now You See Me: Now You Don’t (28.13%, the year’s narrowest clearance of the 26.18% bar).
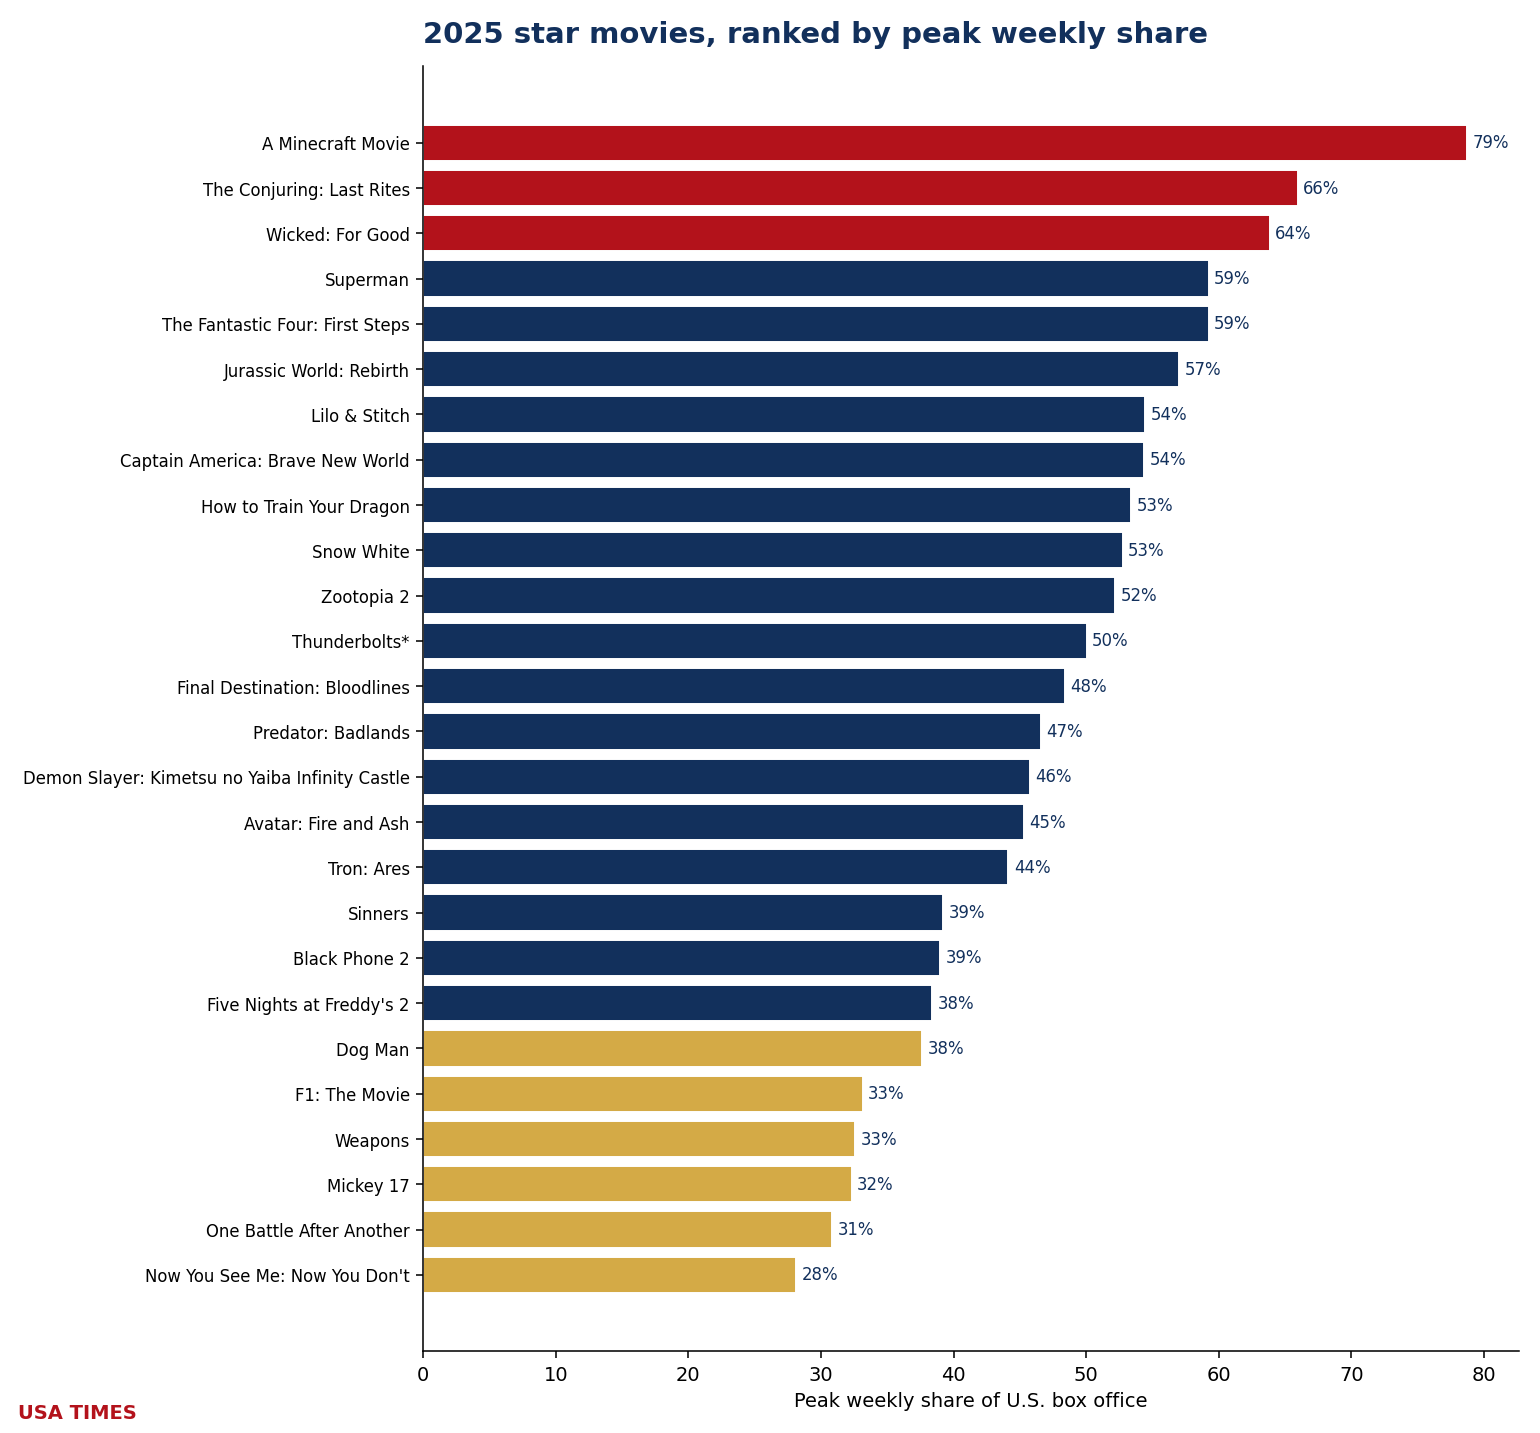
Four films tie for the longest hold at 3 weeks each: A Minecraft Movie, Lilo & Stitch, Zootopia 2 and Sinners. Fifteen of the twenty-seven owners (56%) were one-week wonders. Money: 2025 is not a clean sweep — two owners finished below 1× budget: Tron: Ares (0.65×) and Snow White (0.76×). Best return of the year: Demon Slayer: Kimetsu no Yaiba Infinity Castle at 40.15×, the 4th-best return anywhere in the twenty-year index. Concentration: the year’s owners took 41.7% of all domestic box office during the weeks they owned.
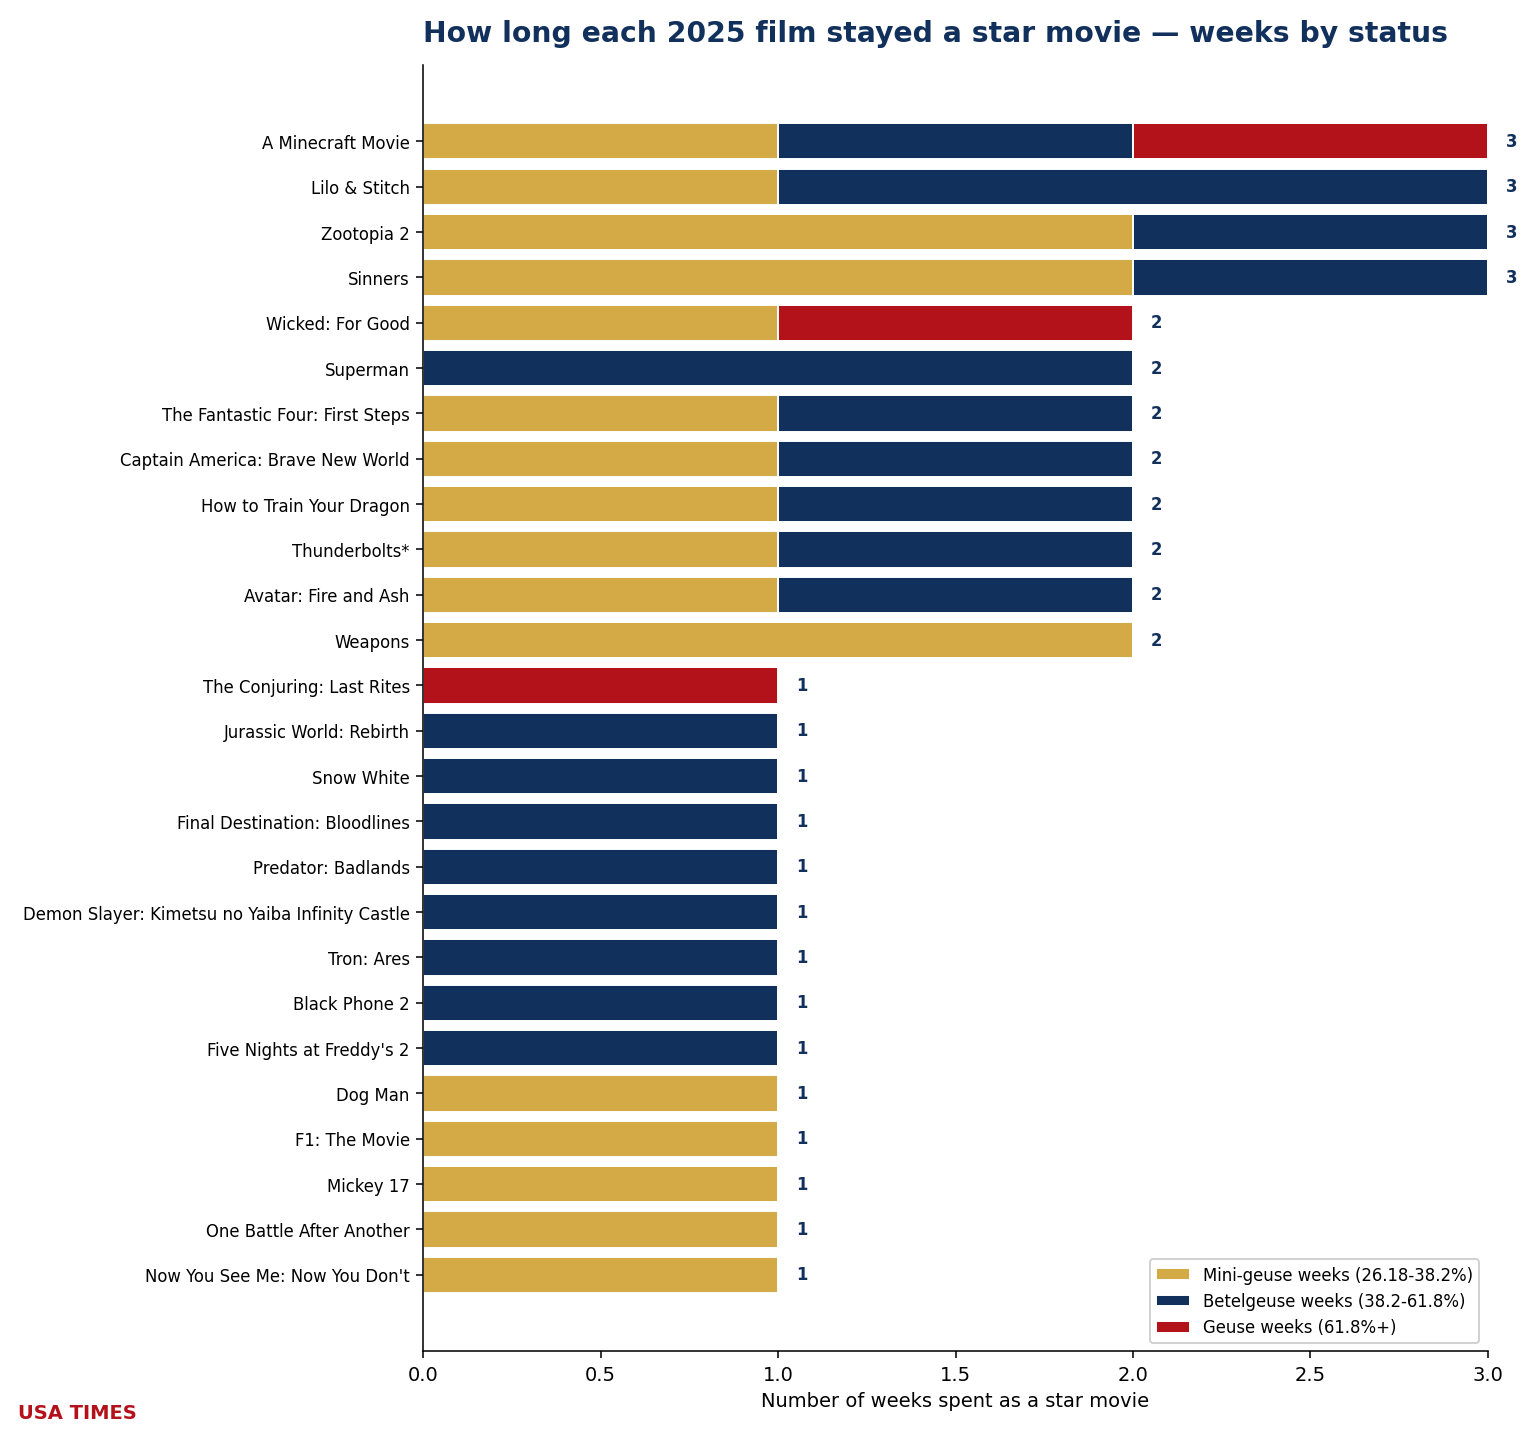
The 2025 ledger
| Film | Peak share | Tier at peak | Weeks as event | WW gross | Budget* | WW / budget |
|---|---|---|---|---|---|---|
| A Minecraft Movie | 78.72% (W14) | Geuse | 3 | $955.0M | $150.0M | ▲ 6.37× |
| The Conjuring: Last Rites | 65.97% (W36) | Geuse | 1 | $499.0M | $55.0M | ▲ 9.07× |
| Wicked: For Good | 63.86% (W47) | Geuse | 2 | $541.0M | $150.0M | ▲ 3.61× |
| Superman | 59.24% (W28) | Betelgeuse | 2 | $616.0M | $225.0M | ▲ 2.74× |
| The Fantastic Four: First Steps | 59.24% (W30) | Betelgeuse | 2 | $521.0M | $200.0M | ▲ 2.60× |
| Jurassic World: Rebirth | 57.03% (W27) | Betelgeuse | 1 | $861.0M | $180.0M | ▲ 4.78× |
| Lilo & Stitch | 54.47% (W21) | Betelgeuse | 3 | $1.038B | $100.0M | ▲ 10.38× |
| Captain America: Brave New World | 54.39% (W7) | Betelgeuse | 2 | $415.0M | $180.0M | ▲ 2.31× |
| How to Train Your Dragon | 53.40% (W24) | Betelgeuse | 2 | $636.0M | $150.0M | ▲ 4.24× |
| Snow White | 52.75% (W12) | Betelgeuse | 1 | $206.0M | $270.0M | ▼ 0.76× |
| Zootopia 2 | 52.20% (W48) | Betelgeuse | 3 | $1.867B | $150.0M | ▲ 12.45× |
| Thunderbolts* | 50.06% (W18) | Betelgeuse | 2 | $382.0M | $180.0M | ▲ 2.12× |
| Final Destination: Bloodlines | 48.41% (W20) | Betelgeuse | 1 | $318.0M | $50.0M | ▲ 6.36× |
| Predator: Badlands | 46.58% (W45) | Betelgeuse | 1 | $185.0M | $105.0M | ▲ 1.76× |
| Demon Slayer: Kimetsu no Yaiba Infinity Castle | 45.77% (W37) | Betelgeuse | 1 | $803.0M | $20.0M | ▲ 40.15× |
| Avatar: Fire and Ash | 45.33% (W51) | Betelgeuse | 2 | $1.480B | $400.0M | ▲ 3.70× |
| Tron: Ares | 44.14% (W41) | Betelgeuse | 1 | $142.0M | $220.0M | ▼ 0.65× |
| Sinners | 39.22% (W16) | Betelgeuse | 3 | $366.0M | $90.0M | ▲ 4.07× |
| Black Phone 2 | 39.01% (W42) | Betelgeuse | 1 | $132.0M | $30.0M | ▲ 4.40× |
| Five Nights at Freddy’s 2 | 38.39% (W49) | Betelgeuse | 1 | $221.0M | $51.0M | ▲ 4.33× |
| Dog Man | 37.63% (W5) | Mini-geuse | 1 | $146.0M | $40.0M | ▲ 3.65× |
| Taylor Swift: The Official Release Party of a Showgirl | 33.24% (W40) | Mini-geuse | 1 | $50.0M | — | — |
| F1: The Movie | 33.15% (W26) | Mini-geuse | 1 | $629.0M | $250.0M | ▲ 2.52× |
| Weapons | 32.60% (W32) | Mini-geuse | 2 | $270.0M | $38.0M | ▲ 7.11× |
| Mickey 17 | 32.32% (W10) | Mini-geuse | 1 | $132.0M | $118.0M | ▲ 1.12× |
| One Battle After Another | 30.83% (W39) | Mini-geuse | 1 | $213.0M | $130.0M | ▲ 1.64× |
| Now You See Me: Now You Don’t | 28.13% (W46) | Mini-geuse | 1 | $247.0M | $90.0M | ▲ 2.74× |
*Budgets are reported estimates (Box Office Mojo, The Numbers, trade press) and should be read as such. A green ▲ marks a film that returned at least its reported budget in worldwide gross; a red ▼ marks one that did not. Industry rules of thumb put real breakeven nearer 2–2.5× budget once print and advertising are counted, so a green arrow below that range is not the same as a profit.
Method & sources
Every weekly figure traces to a Box Office Mojo weekly domestic chart (boxofficemojo.com/weekly/{YEAR}W{NN}). The weekly denominator is the “Overall Gross” column of Box Office Mojo’s weekly by-year page for that year; where that page has returned incomplete data, the denominator is instead the sum of every film’s gross on that week’s own chart, and the substitution is footnoted in the year’s method note below. The two methods agree closely — for 2006 they agree to the dollar in all 52 weeks. Every week’s No. 1 film is additionally cross-checked against the “#1 Release” column of the by-year index before any share is computed. A film counts as a star movie in a week when it is No. 1 or No. 2 with at least 26.18% of that week’s domestic total; the global 6.18% test is a secondary route to qualification but every grade above is computed on domestic shares. Concentration is computed on a uniform owner-week basis across all twenty years. Worldwide grosses come from Box Office Mojo release pages; production budgets are reported estimates (Box Office Mojo, The Numbers, trade press and, where noted, Wikipedia infoboxes) and should be read as estimates, not audited figures. No figure anywhere in this index is reconstructed from memory or inference; where a page could not be retrieved, the gap is recorded rather than filled. The backfill is complete: 2006 through 2025, twenty consecutive years. 2026 continues on the live tracker.
2006 method note. Denominators are the official “Overall Gross” column of Box Office Mojo’s 2006 weekly index; as an independent check, the sum of every film’s gross on each week’s own chart was computed separately and matched that column exactly, to the dollar, in all 52 weeks. Per-film weekly figures are taken directly from BOM’s 52 weekly charts (/weekly/2006W01–W52) using the widened row regex; every week’s No. 1 film matched the by-year index’s “#1 Release” column, 52 of 52, with no discrepancies. There is no partial week 53 — /weekly/2006W53/ returns HTTP 400. Worldwide gross and production budget were available on Box Office Mojo’s own release page for all thirteen star movies, so no outside budget estimates were needed for this year. Two figures deserve a footnote. Inside Man qualifies by 0.0019 percentage points — $37,070,295 of $141,587,260 is 26.1819%, the narrowest clearance of the 26.18% bar anywhere in the twenty-year index. And week 46 came within 0.21 points of being a two-owner week: Casino Royale took 26.41% while Happy Feet took 25.97%, which is why 2006 records zero two-owner weeks rather than one.
2020 method note. Denominators are the official “Overall Gross” column of Box Office Mojo’s 2020 weekly index. Per-film weekly figures come from BOM’s weekly charts where retrievable; for weeks whose charts no longer render, figures are reconstructed exactly by differencing BOM’s own cumulative totals across adjacent weekly and weekend charts (the reconstruction reproduces published weekly charts to the dollar wherever both exist). Weeks 12–33, in which the national market fell below $5 million under COVID-19 closures, are recorded but excluded from star-movie status; 2020’s pandemic-market share peaks are likewise excluded from all-time records. Honest Thief’s opening week (Oct 9–15) was not reported to BOM’s weekly chart and is carried per BOM’s own accounting.
2019 method note. Denominators are the official “Overall Gross” column of Box Office Mojo’s 2019 weekly index. Per-film weekly figures are taken directly from BOM’s 52 weekly charts (/weekly/2019W01–W52); every week’s No.1 film was additionally cross-checked against the “#1 Release” column of the by-year index, with no discrepancies. Shares are computed domestic-only; the global 6.18% threshold was not separately evaluated.
2018 method note. Denominators are the official “Overall Gross” column of Box Office Mojo’s 2018 weekly index. Per-film weekly figures are taken directly from BOM’s 52 weekly charts (/weekly/2018W01–W52); every week’s No.1 film was additionally cross-checked against the “#1 Release” column of the by-year index, with no discrepancies. Shares are computed domestic-only; the global 6.18% threshold was not separately evaluated.
2017 method note. Denominators are the official “Overall Gross” column of Box Office Mojo’s 2017 weekly index. Per-film weekly figures are taken directly from BOM’s 52 weekly charts (/weekly/2017W01–W52); every week’s No.1 film and weekly total were additionally cross-checked against the by-year index, with no discrepancies in 52 weeks. Shares are computed domestic-only; the global 6.18% threshold was not separately evaluated.
2016 method note. Denominators are the official “Overall Gross” column of Box Office Mojo’s 2016 weekly index (53 weeks, including the partial Dec 30–Jan 5 week 53). Per-film weekly figures are taken directly from BOM’s weekly charts (/weekly/2016W01–W53); every week’s No.1 film and weekly total were cross-checked against the by-year index, with no discrepancies across all 53 weeks. Shares are computed domestic-only; the global 6.18% threshold was not separately evaluated.
2015 method note. Denominators are the official “Overall Gross” column of Box Office Mojo’s 2015 weekly index (52 weeks; no partial week 53). Per-film weekly figures are taken directly from BOM’s weekly charts (/weekly/2015W01–W52); every week’s No.1 film and weekly total were cross-checked against the by-year index, with no discrepancies across all 52 weeks after a scraping fix (an initial pass using a regex that only matched bare <tr> tags silently dropped rank-1 rows Box Office Mojo marks “New This Week” — those carry a class attribute on the row — which shifted the computed No.1 down a rank for about half the year’s weeks until caught by the by-year cross-check and corrected). Shares are computed domestic-only; the global 6.18% threshold was not separately evaluated. Worldwide grosses and budgets are Box Office Mojo’s current lifetime figures and reported studio/press estimates, respectively.
2014 method note. Denominators are the official “Overall Gross” column of Box Office Mojo’s 2014 weekly index (52 weeks; no partial week 53 — confirmed directly, /weekly/2014W53/ returns HTTP 400). Per-film weekly figures are taken directly from BOM’s weekly charts (/weekly/2014W01–W52); every week’s No.1 film and weekly total were cross-checked against the by-year index, with zero discrepancies across all 52 weeks. Shares are computed domestic-only; the global 6.18% threshold was not separately evaluated. Worldwide grosses and budgets are Box Office Mojo/The Numbers current lifetime figures and reported studio/press estimates, respectively; the widest-ranging reported budgets were The Amazing Spider-Man 2 ($200–293 million depending on source) and Godzilla (worldwide gross reported $524.98–529 million) — this ledger uses the more conservative, commonly-cited figure in both cases.
2013 method note. Denominators are the official “Overall Gross” column of Box Office Mojo’s 2013 weekly index (52 weeks; no partial week 53 — confirmed directly, /weekly/2013W53/ returns HTTP 400). Per-film weekly figures are taken directly from BOM’s weekly charts (/weekly/2013W01–W52); every week’s No.1 film and weekly total were cross-checked against the by-year index, with zero discrepancies across all 52 weeks. Shares are computed domestic-only; the global 6.18% threshold was not separately evaluated. Worldwide grosses and budgets are Box Office Mojo/The Numbers current lifetime figures and reported studio/press estimates, respectively; several budgets carry genuine uncertainty and are flagged in the film_summary data file — The Hobbit: The Desolation of Smaug ($217–250 million reported range, used $225 million), The Great Gatsby (reported net production budget ~$105 million vs. a ~$190 million gross budget before an Australian tax rebate, used the $105 million net figure), and World War Z (escalated during reshoots; commonly reported at $190 million, though figures folding in reshoots and marketing run as high as $260–269 million).
2012 method note. Denominators are the official “Overall Gross” column of Box Office Mojo’s 2012 weekly index (52 weeks; no partial week 53 — confirmed directly, /weekly/2012W53/ returns HTTP 400). Per-film weekly figures are taken directly from BOM’s weekly charts (/weekly/2012W01–W52); every week’s No.1 film was cross-checked against the by-year index’s “#1 Release” column, with zero discrepancies across all 52 weeks. Shares are computed domestic-only; the global 6.18% threshold was not separately evaluated. Worldwide grosses and budgets are Box Office Mojo current lifetime figures and reported studio/press estimates, respectively; a few budgets carry genuine uncertainty and are flagged in the film_summary data file — The Hobbit: An Unexpected Journey (per-film cost commonly cited $180–270 million against a $500–745 million trilogy-wide figure, used $180 million, the figure most often attributed specifically to this film), Skyfall (raw cost reported ~$210 million against a ~$150 million net-of-UK-tax-incentive figure; BOM/IMDb commonly list $200 million, used here — at the $150 million net figure the ratio would be 7.39× rather than 5.54×), and Prometheus (reported $120–130 million range plus roughly $10 million for 3D conversion, used $130 million as the most commonly cited final figure).
2011 method note. Denominators are the official “Overall Gross” column of Box Office Mojo’s 2011 weekly index (52 weeks; no partial week 53 — confirmed directly, /weekly/2011W53/ returns HTTP 400; the year’s 52nd week runs Dec 30, 2011–Jan 5, 2012). Per-film weekly figures are taken directly from BOM’s weekly charts (/weekly/2011W01–W52); every week’s No.1 film was cross-checked against the by-year index’s “#1 Release” column, with zero discrepancies across all 52 weeks. Shares are computed domestic-only; the global 6.18% threshold was not separately evaluated. Worldwide grosses and budgets are Box Office Mojo current lifetime figures and reported studio/press estimates, respectively; budgets carrying genuine uncertainty are flagged in the film_summary data file — Harry Potter and the Deathly Hallows: Part 2 (reported $125 million individually, also cited as part of a combined $250 million two-part budget with Part 1, used $125 million), The Twilight Saga: Breaking Dawn – Part 1 (reported $110–127 million range, used $110 million), Pirates of the Caribbean: On Stranger Tides (widely reported $250 million production budget, though marketing-inclusive and escalated figures as high as $378.5–410 million have been cited, making it one of the most expensive films ever made — used the $250 million production-budget figure for comparability with the rest of the index), and X-Men: First Class (reported $140–160 million range, used $160 million). The Lion King’s entry reflects its 2011 3D theatrical re-release (Box Office Mojo tracks it as a release group distinct from the 1994 original); its original production budget is seventeen years older and not a comparable figure, so no worldwide/budget ratio is computed for it. This run also found and removed a stray, incomplete 23-row partial stub for 2011 already present in the shared em_index.db — its owner-week figures matched this run’s own from-scratch computation film-for-film, an independent cross-check of the methodology, but it was missing all 29 ownerless weeks and all profitability data; it has been replaced in full by this run’s complete 52-week, 21-film dataset.
2010 method note. Denominators are the official “Overall Gross” column of Box Office Mojo’s 2010 weekly index (53 weeks, including the partial Dec 31, 2010–Jan 6, 2011 week 53; confirmed directly — /weekly/2010W53/ returns HTTP 200, /weekly/2010W54/ returns HTTP 404). Per-film weekly figures are taken directly from BOM’s weekly charts (/weekly/2010W01–W53); every week’s No.1 film and weekly domestic total were cross-checked against the by-year index’s “Overall Gross” and “#1 Release” columns, with zero discrepancies across all 53 weeks (seven weeks were additionally spot-checked against a fresh, independent parse of their own chart pages using the widened <tr[^>]*> row regex, per the scraping-bug fix documented in the 2015 method note, with identical results). Shares are computed domestic-only; the global 6.18% threshold was not separately evaluated. Worldwide grosses and budgets are Box Office Mojo current lifetime figures and reported studio/press estimates, respectively; budgets carrying genuine uncertainty are flagged in the film_summary data file — Iron Man 2 (reported $170–200 million range, used $200 million, the more commonly cited figure across BOM/IMDb databases), Alice in Wonderland (reported $150–200 million range, used $200 million), Harry Potter and the Deathly Hallows: Part 1 (reported $125 million individually, also cited as part of a combined $250 million two-part budget with Part 2, used $125 million, consistent with the 2011 run’s treatment of Part 2), Avatar (reported $237 million production budget, with some post-production/marketing-inclusive estimates running $280–310 million, used $237 million), Clash of the Titans (reported $125 million base production budget, with reshoots, 3D conversion and marketing pushing total studio investment to an estimated $187.5–225 million, used the $125 million production-budget figure for comparability), and Tron: Legacy (reported $170–200 million range, used $170 million; an additional estimated $150 million in worldwide marketing is not counted here). Avatar’s worldwide gross reflects its full theatrical run beginning Dec 18, 2009; its December 2009 weeks (W51–52) are now measured as part of 2009’s own ledger entry (added in a later pass; see the 2009 method note), and only its January 2010 weeks are counted toward 2010’s star-movie status here. This run found em_index.db already containing a stray, incomplete 27-row partial stub for 2010 (owner-weeks only, no ownerless weeks, and no profitability data) left over from an earlier, interrupted session; the year’s working data files (weekly ingestion, tier computation, and analysis JSON) had already been completed to a 52-week-plus-partial-W53 standard in that earlier session and were independently re-verified against fresh Box Office Mojo fetches this run (the by-year page’s Overall Gross and #1 Release columns re-fetched and matched 53/53 weeks; seven individual weekly chart pages spot-checked in full detail against the existing ingestion, with identical films and dollar figures) before being trusted; the stray 27-row stub was then deleted and replaced in full by this run’s complete, independently verified 53-week, 19-film dataset. The stray, out-of-scope stubs for 2006 (14 rows), 2007 (18 rows), 2008 (20 rows) and 2009 (23 rows) were confirmed present and unmodified at both the start and the end of this run.
2009 method note. Denominators are the official “Overall Gross” column of Box Office Mojo’s 2009 weekly index (52 weeks; no partial week 53 — confirmed directly on the by-year table, Week 1 = Jan 2–8, Week 52 = Dec 25–31, each week a Friday–Thursday span). Per-film weekly figures are taken directly from BOM’s 52 weekly charts (/weekly/2009W01–W52), fetched via direct shell request rather than the web_fetch tool (whose literal-URL provenance restriction blocked a prior pass at this year, which had only solved 23 of 52 weeks via WebSearch-surfaced URLs before stopping per this project’s own quality gate rather than publish an incomplete year); this run’s own per-week sum of every film’s Gross column matched the by-year page’s Overall Gross figure exactly for all 52 weeks, and every week’s No.1 film matched the by-year index’s “#1 Release” column, both zero discrepancies. Shares are computed domestic-only; the global 6.18% threshold was not separately evaluated. Worldwide grosses are Box Office Mojo current lifetime figures (fetched from each film’s BOM release page); production budgets are BOM’s own listed figure where available (18 of 20 films) and Wikipedia-cited estimates otherwise — Madea Goes to Jail ($17.5 million; Lionsgate did not disclose an official figure, and Tyler Perry films are consistently reported in the $15–20 million range) and This Is It ($60 million; a concert-film production/post-production cost, not a traditional studio budget). Harry Potter and the Half-Blood Prince’s BOM-listed $250 million is on the high end of commonly cited figures (some press reports cite $150–175 million for the film alone, with $250 million reflecting a marketing-inclusive studio investment); used BOM’s figure for consistency with this index’s BOM-first sourcing rule. Avatar’s worldwide gross reflects its full theatrical run beginning Dec 18, 2009; its December 2009 weeks (W51–52) are measured here as part of 2009’s own ledger entry, and only its January 2010 weeks are counted toward 2010’s star-movie status (see the 2010 method note, updated accordingly this run). This run found em_index.db already containing a stray, incomplete 23-row weekly / 20-row film_summary partial stub for 2009 (owner-weeks only, missing all 29 ownerless weeks and all profitability data) left over from the earlier, stopped pass referenced above; the stray stub’s 23 solved weeks matched this run’s own from-scratch computation film-for-film and share-for-share, an independent cross-check of the methodology, but it was deleted and replaced in full by this run’s complete 52-week, 20-film dataset. The stray, out-of-scope stubs for 2006 (14 rows), 2007 (18 rows) and 2008 (20 rows) were confirmed present and unmodified at both the start and the end of this run.
2008 method note. Denominators are the official “Overall Gross” column of Box Office Mojo’s 2008 weekly index (52 weeks; no partial week 53 — confirmed directly on the by-year table, Week 1 = Jan 4–10, Week 52 = Dec 26–Jan 1, 2009, each week a Friday–Thursday span). Per-film weekly figures are taken directly from BOM’s 52 weekly charts (/weekly/2008W01–W52), fetched via direct shell request (curl) rather than the web_fetch tool, per the tooling workaround established in the 2009 run; this run’s own per-week sum of every film’s Gross column matched the by-year page’s Overall Gross figure exactly for all 52 weeks, and every week’s No.1 film matched the by-year index’s “#1 Release” column, both zero discrepancies. Shares are computed domestic-only; the global 6.18% threshold was not separately evaluated. Worldwide grosses and production budgets for all 18 star movies were both sourced from each film’s Box Office Mojo release page (Worldwide summary figure; Budget field, a reported estimate) — BOM listed a budget figure for all 18 of 18 films, so no Wikipedia fallback was needed this run. This run found em_index.db already containing a stray, incomplete 20-row weekly / 18-row film_summary partial stub for 2008 (owner-weeks only, missing all 32 ownerless weeks, all No.2-film data, and all profitability data) left over from an earlier, unfinished session, referenced in both the 2009 and 2010 method notes above; the stray stub’s 20 solved weeks matched this run’s own from-scratch computation film-for-film and share-for-share exactly (Iron Man 61.16%, The Dark Knight 59.78%, and so on down the list), an independent cross-check of the methodology, but it was deleted and replaced in full by this run’s complete 52-week, 18-film dataset with No.2-film shares and full profitability data added. The stray, out-of-scope stubs for 2006 (14 rows) and 2007 (18 rows) were confirmed present and unmodified at both the start and the end of this run; no stray stub remains for 2008 or 2009.
2007 method note. Denominators are the official “Overall Gross” column of Box Office Mojo’s 2007 weekly index (52 weeks; no partial week 53 — confirmed both on the by-year table and directly, since a request to /weekly/2007W53/ returns HTTP 400; Week 1 = Jan 5–11, Week 52 = Dec 28–Jan 3, 2008, each week a Friday–Thursday span). Per-film weekly figures are taken directly from BOM’s 52 weekly charts (/weekly/2007W01–W52), fetched via direct shell request (curl) rather than the web_fetch tool, per the tooling workaround established in earlier runs, and parsed with the widened <tr[^>]*> row regex (title in cell index 2, gross in cell index 3, both verified against raw HTML before bulk parsing) to avoid the annotation-class row-drop bug diagnosed in the 2015 method note. This run’s own per-week #1 film matched the by-year index’s “#1 Release” column for all 52 weeks, zero discrepancies, and num1_gross≤overall_domestic and num2_gross≤num1_gross held for all 52 weeks. Shares are computed domestic-only; the global 6.18% threshold was not separately evaluated. Worldwide grosses and production budgets for 16 of the 18 star movies were both sourced from each film’s Box Office Mojo release page (Worldwide summary figure; Budget field, a reported estimate); Box Office Mojo did not list a budget for two films, Wild Hogs and Saw IV, so their budgets ($60 million and $10 million respectively) are Wikipedia infobox estimates, corroborated by each film’s Wikipedia box-office figure matching Box Office Mojo’s own worldwide-gross figure almost exactly. This run found em_index.db already containing a stray, incomplete 18-row weekly / 16-row film_summary partial stub for 2007 (all num1-only owner weeks, no No.2-film data at all, no ownerless weeks recorded, and no profitability data) left over from an earlier, unfinished session, referenced in the 2008, 2009 and 2010 method notes above. Sixteen of the stray stub’s 18 solved weeks matched this run’s own from-scratch computation film-for-film and share-for-share exactly, an independent partial cross-check of the methodology — but the stray stub was missing two owner-weeks this run’s widened-regex parse correctly recovered (W11, 300 at 29.26%; W27, Transformers at 32.06%), and it never captured either of the year’s two genuine two-owner weeks (W21’s Shrek the Third at 26.42% as a No.2 owner; W44’s Bee Movie at 26.97% as a No.2 owner) because it recorded no No.2-film data whatsoever — a data-quality gap consistent with the annotation-class row-drop bug this project diagnosed and fixed in the 2015 method note, though this run cannot confirm that was the specific cause of the 2007 stub’s gaps versus a simpler num2-column omission in whatever process produced it. The stray stub was deleted in full and replaced by this run’s complete 52-week, 18-film dataset with full No.2-film shares and profitability data added. The stray, out-of-scope stub for 2006 (14 rows) was confirmed present and unmodified at both the start and the end of this run; no stray stub remains for 2007, 2008 or 2009.
- The IMAX PassportOf every box-office Geuse in 20 years, how many opened on a giant screen?
- Holding the ThroneThe rarest event in modern cinema: one film owning the U.S. box office two weeks running.
- One Movie, Most of the MoneyHow total box-office domination went from exception to the norm.
- The Star Movies of 2026, So FarUpdated weekly: which films are taking the whole market this year.
Related from the USA Times Data Desk
- Wikipedia Credits a 1982 Bollywood Film With Nearly Double Sholay's Gross. Its Citations Are About Completely Different Movies.
- The Star Movies of 2024: Every Film That Took Over a Week at the Box Office
- The Star Movies of 2025: Every Film That Took Over a Week at the Box Office
- Since 1940: Every Year's Biggest Indian Film — and the Budget Boom That Changed the Math
- Box-office coverage index · the Star Index methodology
Sources
- Box Office Mojo — Weekend Domestic Box Office
- Box Office Mojo — Yearly Domestic Box Office
- The Numbers — Weekly Box Office Chart
- USA Times — Star Index methodology & data sources